Canned Salmon Market Size and Share
Market Overview
| Study Period | 2021 - 2031 |
|---|---|
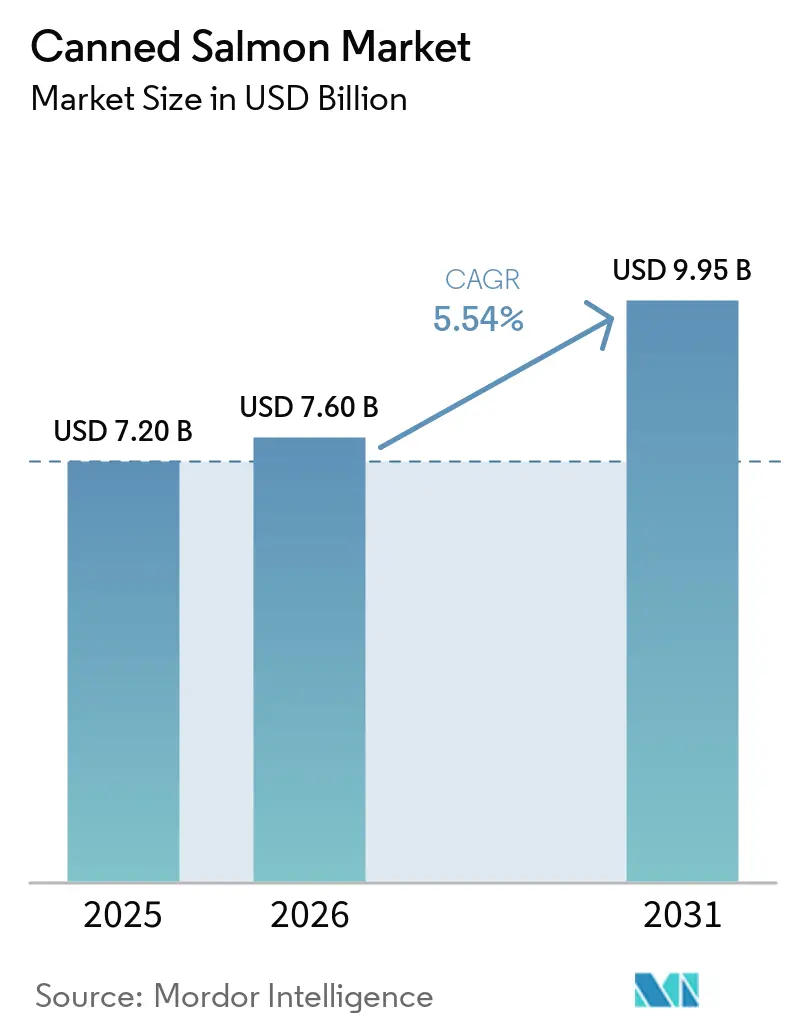
| Market Size (2026) | USD 7.60 Billion |
| Market Size (2031) | USD 9.95 Billion |
| Growth Rate (2026 - 2031) | 5.54% CAGR |
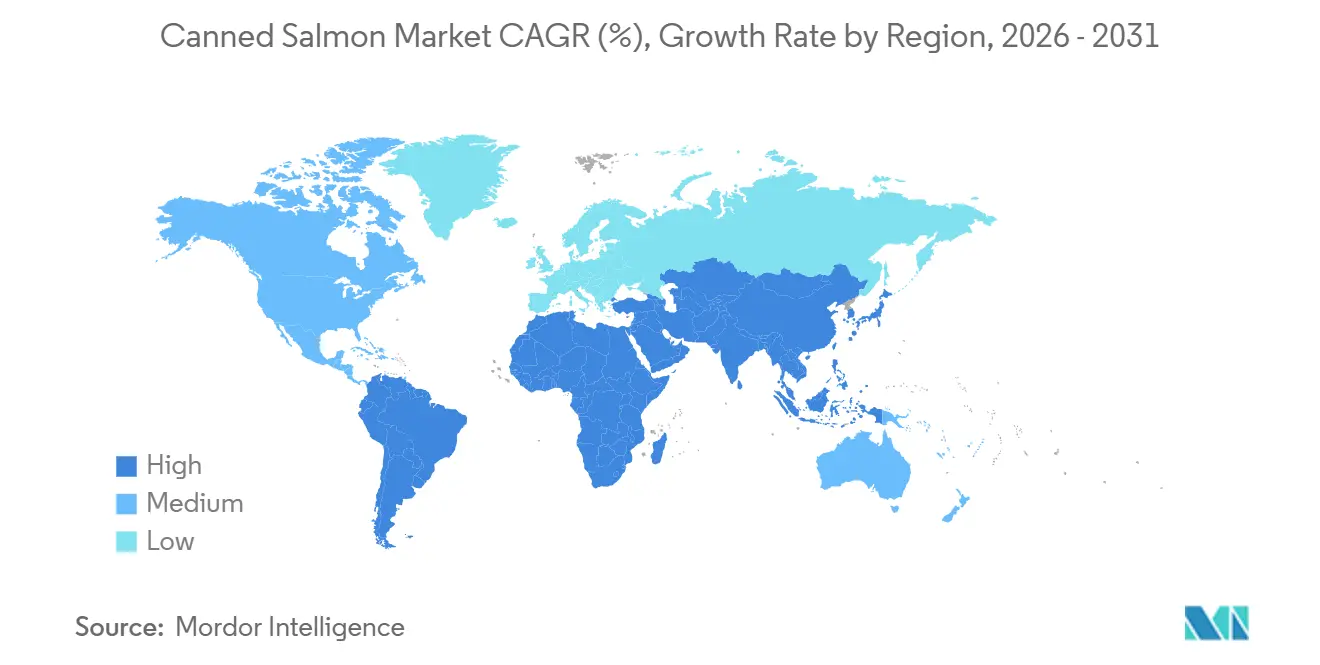
| Fastest Growing Market | Middle East and Africa |
| Largest Market | Asia Pacific |
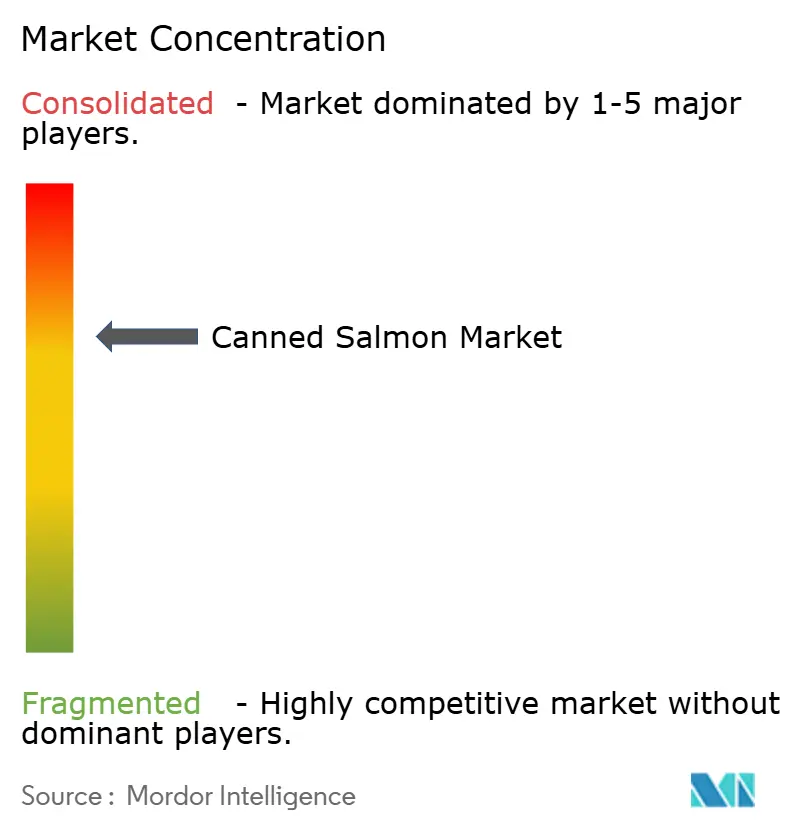
| Market Concentration | Medium |
Major Players *Disclaimer: Major Players sorted in no particular order Image © Mordor Intelligence. Reuse requires attribution under CC BY 4.0. | |
Canned Salmon Market Analysis by Mordor Intelligence
By 2025, the canned salmon market is anticipated to reach USD 7.20 billion, with projections indicating growth to USD 7.60 billion in 2026 and further expansion to USD 9.95 billion by 2031. This growth corresponds to a CAGR of 5.54% during the forecast period from 2026 to 2031. The increasing demand is primarily fueled by the clinical validation of omega-3 health benefits, which has strengthened consumer trust. Additionally, the rise of e-commerce has effectively mitigated cold-chain constraints, while advancements in packaging technology address consumer concerns regarding bisphenol A and microplastics. Certified wild-caught and responsibly farm-raised supply chains provide brands with a competitive edge in sustainability. Furthermore, the growing prevalence of single-person households has driven the demand for portion-controlled pouches, catering to individual consumption needs. Retailers are leveraging online platforms to promote premium MSC- or ASC-certified variants, enhancing their market positioning. Simultaneously, processors are adopting automated deboning technologies to reduce labor dependency and improve production yields, ensuring operational efficiency.
Key Report Takeaways
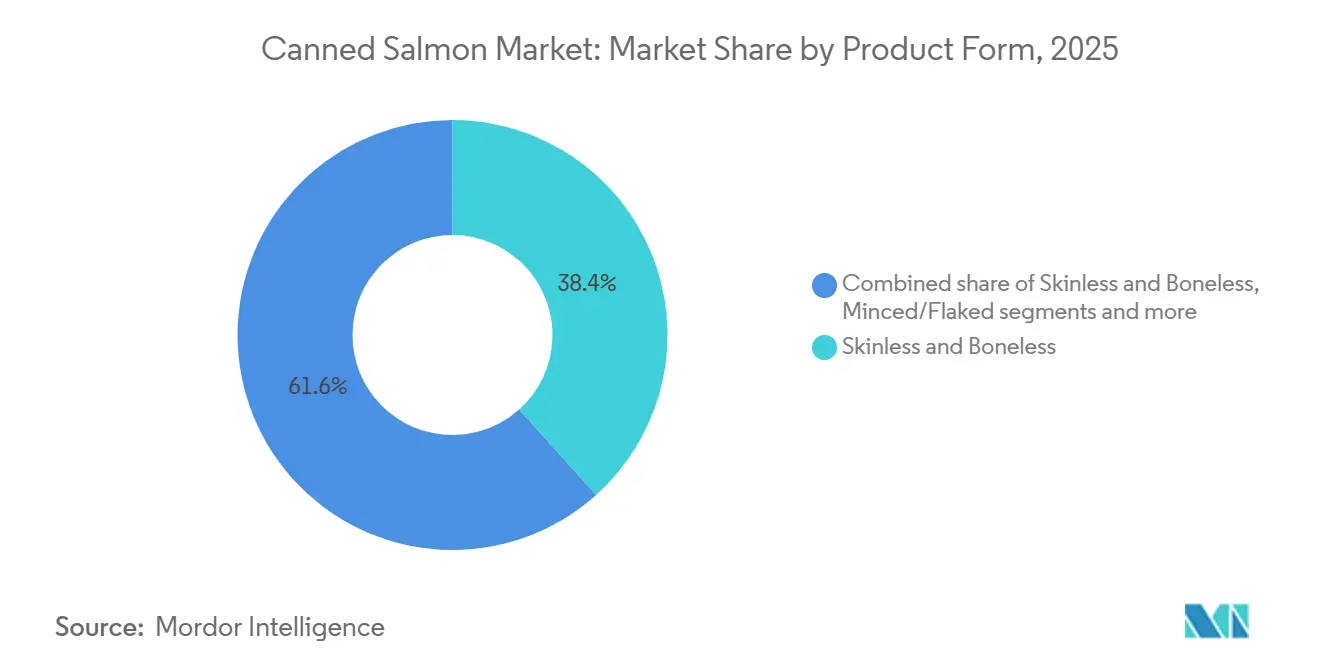
- By product form, skinless and boneless formats led with 38.35% of the canned salmon market share in 2025, while fillets are advancing at a 7.21% CAGR through 2031.
- By source, wild-caught salmon dominated with 65.45% share in 2025, whereas farm-raised salmon is projected to grow at 7.81% CAGR to 2031.
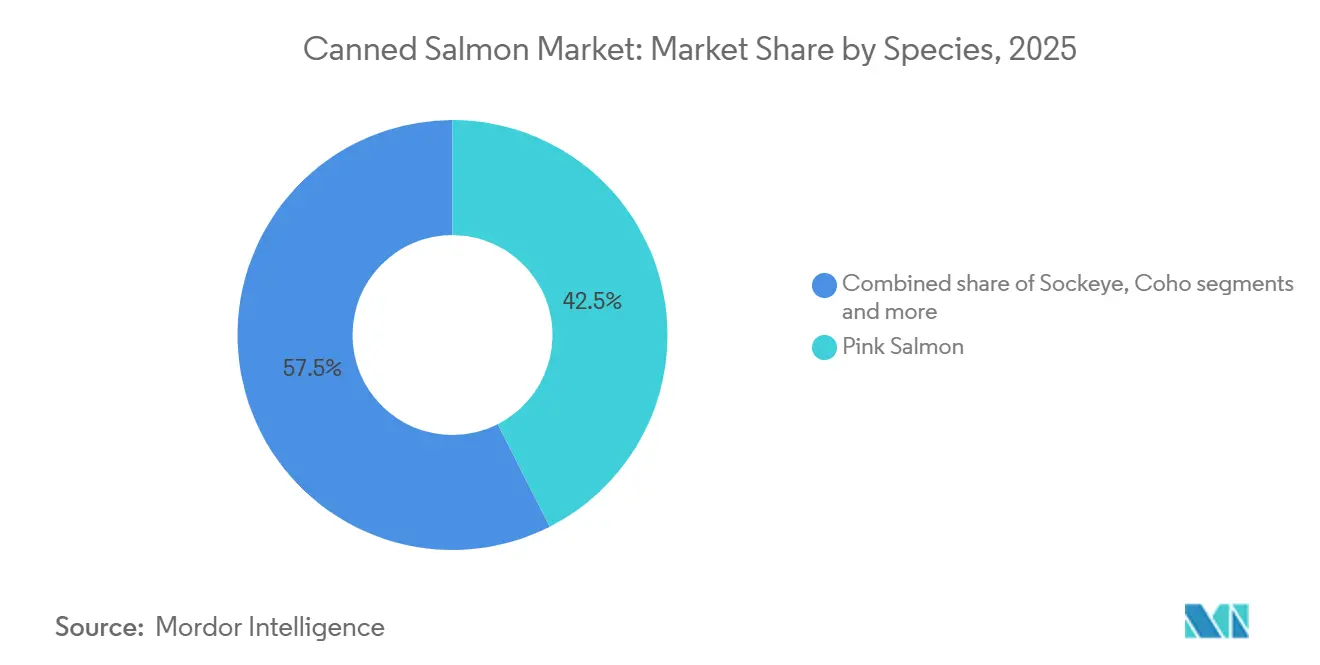
- By species, pink salmon held 42.52% share of the canned salmon market size in 2025, and Atlantic salmon is forecast to expand at a 6.72% CAGR through 2031.
- By distribution channel, retail captured 78.34% in 2025, while foodservice is progressing at 6.34% CAGR over 2026-2031.
- By geography, Asia-Pacific accounted for 39.45% of the value in 2025, and the Middle East & Africa region is expected to register the fastest 7.85% CAGR to 2031
Note: Market size and forecast figures in this report are generated using Mordor Intelligence’s proprietary estimation framework, updated with the latest available data and insights as of January 2026.
Global Canned Salmon Market Trends and Insights
Drivers Impact Analysis*
| Driver | (~) % Impact on CAGR Forecast | Geographic Relevance | Impact Timeline |
|---|---|---|---|
| Increasing Consumer Demand for Shelf-Stable and Protein-Rich Food Products | +0.8% | Global, with pronounced uptake in Asia-Pacific and Middle East & Africa | Medium term (2-4 years) |
| Rapid Expansion of E-Commerce and Direct-to-Consumer Seafood Delivery Channels | +0.6% | North America, Europe, and urban Asia-Pacific markets | Short term (≤ 2 years) |
| Rising Health Awareness Supporting Omega-3 Enriched Seafood Consumption | +1.0% | Global, led by North America and Europe | Long term (≥ 4 years) |
| Strong Preference for Convenient and Ready-to-Eat Meal Solutions | +0.7% | North America, Europe, and emerging Asia-Pacific urban centers | Medium term (2-4 years) |
| Continuous Product Development and Packaging Innovations | +0.5% | Global, with early adoption in North America and Europe | Medium term (2-4 years) |
| Growing Consumer Preference for Sustainably Sourced and Wild-Caught Seafood | +0.9% | Europe, North America, and premium segments in Asia-Pacific | Long term (≥ 4 years) |
| Source: Mordor Intelligence | |||
Increasing Consumer Demand for Shelf-Stable and Protein-Rich Food Products
Shelf-stable protein demand is accelerating as households prioritize food security, extended pantry life, and cost-per-serving economics amid persistent inflation. Canned salmon delivers 20 grams of protein per 5-ounce serving with negligible carbohydrates, positioning it as a nutrient-dense alternative to fresh meat and poultry that require continuous refrigeration. NOAA data show U.S. per capita canned fish consumption held steady at 4.2 pounds in 2022, with canned salmon representing 0.2 pounds per person annually, yet total canned pack for human consumption reached 499.7 million pounds valued at USD 1.2 billion. Emerging markets in the Middle East and Africa are stockpiling canned seafood as part of sovereign food security strategies, with governments prioritizing shelf-stable protein to mitigate supply-chain disruptions. Retail data from November 2025 showed canned seafood generating USD 253 million in four weeks, with all species up and sardines posting the highest gains. The convergence of protein affordability, long shelf life, and minimal preparation requirements positions canned salmon to capture share from fresh and frozen formats in price-sensitive and infrastructure-constrained markets.
Rapid Expansion of E-Commerce and Direct-to-Consumer Seafood Delivery Channels
E-commerce penetration in seafood is reshaping distribution economics and consumer access. E-commerce accounted for 15% of fresh salmon sales and nearly 30% of mackerel in 2026, with fresh fish home delivery emerging as a trust and quality marker. For shelf-stable canned salmon, online grocery platforms eliminate cold-chain constraints and enable direct-to-consumer subscription models that lock in recurring revenue. Retailers are leveraging digital channels to introduce premium canned salmon SKUs, such as MSC-certified wild sockeye and skinless boneless pouches, that command higher margins than commodity tuna. The shift to online also allows niche brands like Wild Planet and Safe Catch to bypass traditional retail gatekeepers and build direct relationships with health-conscious consumers willing to pay premiums for sustainability certifications and low-mercury claims. November 2025 U.S. retail data showed shelf-stable seafood aligned with canned vegetable performance, suggesting cross-category bundling opportunities in online grocery baskets. As logistics providers optimize last-mile delivery for ambient-temperature goods, canned salmon's long shelf life and lightweight packaging reduce fulfillment costs relative to fresh and frozen seafood, accelerating e-commerce channel share gains.
Rising Health Awareness Supporting Omega-3 Enriched Seafood Consumption
Clinical evidence linking omega-3 fatty acids to cardiovascular and cognitive health is driving mainstream adoption of oily fish consumption. The Mayo Clinic recommends at least two servings of omega-3-rich fish per week, citing benefits including reduced triglycerides, lower blood pressure, and decreased risk of sudden cardiac death, with canned salmon listed among low-mercury, high-EPA+DHA choices[1]Source: Mayo Clinic Staff, “Omega-3 in Fish: How Eating Fish Helps Your Heart,” mayoclinic.org. A 2026 study in Scientific Reports found that current dietary guidelines, two seafood portions per week, fail to deliver the recommended EPA+DHA intake for 75% of combinations, prompting calls to increase guidance to three portions with two oily fish servings. Canned salmon provides 510 milligrams of EPA+DHA per 5-ounce serving, meeting a significant portion of weekly targets in a single affordable serving. A 2025 randomized controlled trial demonstrated that consuming UK guideline-level fish intake (140 grams oily fish per week, including salmon) increased the omega-3 index by 2 percentage points over 8 weeks, shifting participants into lower cardiovascular risk categories. Regulatory bodies, including the FDA and EFSA, continue to affirm the safety and efficacy of seafood-derived omega-3s, reinforcing consumer confidence and supporting product claims on canned salmon labels.
Strong Preference for Convenient and Ready-to-Eat Meal Solutions
Time-constrained consumers are prioritizing ready-to-eat and minimally prepared meal solutions, a trend that favors the zero-cook convenience of canned salmon. Skinless and boneless formats eliminate preparation barriers, enabling direct consumption from the can or pouch for salads, sandwiches, and snack occasions. Chicken of the Sea markets its 5-ounce skinless boneless pink salmon pouch as handcrafted in small batches with 31 grams of protein, preservative-free, and MSC-certified, targeting health-conscious consumers seeking clean-label convenience. Meal-kit providers and quick-service restaurants are incorporating canned salmon into ready-to-assemble offerings, leveraging its shelf stability to reduce spoilage and inventory risk. November 2025 U.S. retail data showed fresh salmon dominated seafood sales at USD 293 million, nearly half of all seafood dollars, but canned formats captured incremental occasions where refrigeration and cooking are impractical. The rise of single-person households and declining birth rates in developed markets, trends highlighted in China's 2026 seafood consumption report by the Norwegian Seafood Council, further amplify demand for portion-controlled, no-waste canned salmon formats.
Restraints Impact Analysis*
| Restraint | (~) % Impact on CAGR Forecast | Geographic Relevance | Impact Timeline |
|---|---|---|---|
| Fluctuating Wild-Catch Supply and Raw Material Price Volatility | -0.6% | Alaska, Pacific Northwest, and global supply chains dependent on wild salmon | Short term (≤ 2 years) |
| Increasing Adoption of Vegan and Plant-Based Dietary Alternatives | -0.3% | North America and Europe, with emerging signals in urban Asia | Medium term (2-4 years) |
| Intensifying Competition from Fresh Seafood and Alternative Protein Sources | -0.5% | Global, with strongest pressure in developed markets | Medium term (2-4 years) |
| Rising Concerns Regarding Packaging Chemicals and Microplastic Contamination | -0.4% | Europe and North America, with regulatory spillover to Asia-Pacific | Long term (≥ 4 years) |
| Source: Mordor Intelligence | |||
Fluctuating Wild-Catch Supply and Raw Material Price Volatility
Wild salmon supply is subject to biennial pink salmon cycles and climate-driven abundance shifts that create pronounced year-to-year volatility. Alaska's 2026 commercial salmon harvest is forecast at 125.5 million fish, down 36% from 197 million in 2025, with pink salmon declining from 120 million to 56 million due to the species' strict two-year life cycle, according to the Alaska Department of Fish and Game[2]Source: Alaska Department of Fish and Game, “Run Forecasts and Harvest Projections for 2026 Alaska Salmon Fisheries,” adfg.alaska.gov. Prince William Sound experienced a fishery resource disaster in 2024, with pink salmon harvests 75% below the five-year average and chum salmon 57% below average, resulting in estimated losses exceeding USD 85 million. NOAA's 2023 Arctic Report documented divergent climate responses among Western Alaska salmon species, with Chinook and chum reaching record low abundances while sockeye reached record highs, complicating species-mix planning for processors. Raw material price volatility is amplified by competition for wild-caught salmon from fresh and frozen channels, which command higher margins than canned formats.
Increasing Adoption of Vegan and Plant-Based Dietary Alternatives
Plant-based seafood alternatives are emerging as a long-term structural threat, though current market penetration remains limited. Global plant-based meat and seafood retail sales reached USD 6.1 billion in 2024, growing approximately 4% year-on-year, with plant-based seafood included in this aggregate. U.S. plant-based meat and seafood sales totaled USD 1.2 billion in 2024, down 7% from 2023, reflecting consumer price sensitivity and sensory performance gaps. Revo Foods partnered with Paleo to develop plant-based salmon using pea protein and opened a 3D food printing facility in Vienna, while FDA draft guidance released in January 2025 permits the use of animal-food names for plant-based alternatives if labeling is not misleading. Sensory research shows many plant-based products lag on seafood-specific attributes such as flakiness, umami, and fish flavor, limiting adoption among core seafood consumers. However, younger demographics and flexitarians seeking protein diversity represent a growing addressable market. For canned salmon, the threat is moderated by the category's strong omega-3 and clean-label positioning, which plant-based analogs struggle to replicate without fortification, and by canned salmon's established price competitiveness relative to premium plant-based alternatives.
*Our forecasts treat driver/restraint impacts as directional, not additive. The impact forecasts reflect baseline growth, mix effects, and variable interactions.
Segment Analysis
By Product Form: Convenience Drives Boneless Dominance
Skinless and boneless formats captured 38.35% of market share in 2025, reflecting consumer demand for zero-preparation convenience and elimination of textural barriers associated with bones and skin. Fillets are forecast to grow fastest at 7.21% CAGR through 2031, driven by premiumization trends and restaurant-quality presentation that narrows the perception gap with fresh salmon. Chunks and minced/flaked formats serve distinct use cases—chunks for salads and sandwiches where visible salmon pieces signal quality, and minced/flaked for spreads, dips, and processed foods where uniform texture is prioritized. Packaging innovation is accelerating across all formats, with flexible pouches gaining share due to resealability, lighter weight, and modern shelf appeal compared to traditional rigid cans. Chicken of the Sea's 5-ounce skinless boneless pink salmon pouch delivers 31 grams of protein, is preservative-free, and carries MSC certification, targeting health-conscious consumers willing to pay premiums for clean-label convenience. Bumble Bee's skinless and boneless pink salmon in water provides 510 milligrams of EPA+DHA per 5-ounce serving, positioning the product for omega-3 health claims.
Regulatory influence is minimal for product forms, as FDA standards of identity for canned salmon (21 CFR §161.170) permit various styles without mandating specific formats, though USDA procurement specifies skinless and boneless as well as fillet requirements for federal feeding programs[3]Source: United States Department of Agriculture, “Supplement 507 Salmon,” ams.usda.gov. The shift toward boneless formats is particularly pronounced in North America and Europe, where aging demographics and single-person households prioritize ease of use, while bone-in formats retain share in price-sensitive markets where consumers accept additional preparation in exchange for lower cost per ounce. Manufacturers are investing in automated deboning and portioning equipment to reduce labor costs and improve yield consistency, with SalMar's InnovaMar and InnovaNor processing facilities in Norway providing combined harvest capacity of 300,000 tonnes annually and advanced secondary processing capabilities.


By Source: Wild-Caught Trust Meets Farmed Scalability
Wild-caught salmon commanded 65.45% market share in 2025, underpinned by consumer trust in sustainability certifications and perceived superior flavor and nutritional profile. Farm-raised salmon is forecast to grow fastest at 7.81% CAGR through 2031, driven by production recovery in Norway and Chile, tightening ASC standards that enhance credibility, and cost advantages that support mass-market penetration. The Marine Stewardship Council reports that 62.4% of global wild salmon catch is MSC-certified, with Alaska's fishery, the largest wild salmon source, maintaining certification since 2000 and recommended for recertification in October 2024. Wild salmon's two-year pink salmon cycle creates pronounced supply volatility, with Alaska's 2026 harvest forecast at 125.5 million fish, down 36% from 2025's 197 million, as pink salmon declines from 120 million to 56 million.
Farmed Atlantic salmon production is expanding, with Scotland producing 192,000 tonnes in 2024, up 27% year-on-year, and Norway harvesting 733,000 tonnes in H1 2025, up 19.6%. The Aquaculture Stewardship Council's updated Salmon Standard (Version 1.5, October 2025) mandates fishmeal forage fish dependency ratios below 1.2 and fish oil ratios below 2.52 for salmonids, with requirements for 100% RTRS-certified soy and traceability for all feed ingredients over 1% of volume. SalMar achieved 77% ASC certification across active sites in 2024, with 42% of distributed volume undergoing local secondary processing to reduce transport emissions and support value-added product development. Farmed salmon's consistent year-round availability and lower cost per pound relative to wild sockeye and Chinook position it to capture share in price-sensitive retail channels and foodservice applications where sustainability certification and omega-3 content are sufficient differentiation.
By Species: Pink's Volume Edge Versus Atlantic's Premium Trajectory
Pink salmon held 42.52% market share in 2025, benefiting from Alaska's large-scale harvests, mild flavor profile, and cost competitiveness that align with mass-market canned salmon positioning. Atlantic salmon is forecast to grow fastest at 6.72% CAGR through 2031, driven by farmed production recovery, premiumization trends, and consumer association with restaurant-quality salmon. Sockeye, Coho, and Chinook occupy premium niches, with sockeye prized for deep red color and firm texture, Coho for balanced flavor and medium oil content, and Chinook for the highest omega-3 levels and luxury positioning. NOAA data show pink salmon dominated U.S. canned production in 2022 at 73.6 million pounds valued at USD 212 million, down from 91.3 million pounds in 2021 due to biennial run cycles, while canned sockeye increased to 20.1 million pounds valued at USD 112 million.
Climate-driven species divergence is reshaping supply availability, with NOAA's 2023 Arctic Report documenting record low Chinook and chum abundances and record high sockeye abundances in Western Alaska. Bristol Bay, the world's largest sockeye fishery, is forecast to produce 45.3 million sockeye in 2026, supporting approximately 32 million commercial harvest FAO. Chum salmon, historically used for canning and smoking, faces demand headwinds as Alaska restricts chum fishing to conserve Chinook stocks, reducing raw material availability for processors
By Distribution Channels: Retail Dominance Meets Foodservice Acceleration
Retail channels captured 78.34% of canned salmon distribution in 2025, reflecting the category's pantry-staple positioning and strong presence in supermarkets, hypermarkets, and online grocery platforms. Foodservice is forecast to grow fastest at 6.34% CAGR through 2031, driven by quick-service restaurant adoption, meal-kit incorporation, and institutional feeding programs seeking shelf-stable protein. Within retail, supermarkets and hypermarkets dominate due to extensive shelf space allocation, promotional activity, and consumer habits of purchasing canned goods during weekly shopping trips. Convenience stores are expanding canned salmon assortments to capture on-the-go protein snacking occasions, with single-serve pouches and pull-tab cans enabling immediate consumption. Online retail is accelerating, with e-commerce accounting for 15% of fresh salmon sales and nearly 30% of mackerel in 2026, and shelf-stable formats benefiting from the elimination of cold-chain logistics constraints.
November 2025 U.S. retail data showed canned seafood generating USD 253 million in four weeks, with a strong rebound after a softer October performance and all species posting gains. Foodservice adoption is concentrated in quick-service restaurants incorporating canned salmon into salads, sandwiches, and grain bowls, and in institutional settings such as schools, hospitals, and military bases where USDA procurement mandates domestic-origin, NOAA-approved salmon with full traceability. Meal-kit providers are leveraging canned salmon's shelf stability to reduce spoilage and enable longer subscription cycles without compromising protein variety. HoReCa (hotels, restaurants, catering) channels face headwinds from consumer preference for fresh salmon in dining-out occasions, but canned formats are gaining traction in back-of-house applications such as salmon cakes, spreads, and blended dishes where cost and consistency outweigh fresh presentation. Direct-to-consumer subscription models are emerging, with brands like Wild Planet and Safe Catch building recurring revenue streams and capturing higher margins by bypassing retail intermediaries.
Geography Analysis
Asia-Pacific accounted for 39.45% of the canned salmon market value in 2025, propelled by China's import surge, rising middle-class demand for protein-rich convenience foods across Japan and India, and expanding retail infrastructure in Southeast Asia. The Middle East and Africa region is forecast to grow fastest at 7.85% CAGR through 2031, supported by government-led food security initiatives, halal certification adoption, and urbanization driving modern retail penetration. China's Atlantic salmon imports exceeded 52,500 metric tonnes in Q1 2026, up 59% year-on-year, with chilled salmon as the main growth driver and Norway supplying 67%. Norwegian Seafood Council data show China moved from the 6th largest to the 3rd largest market for Norwegian seafood in 2025, with export value up NOK 2.9 billion (31%) to NOK 12.3 billion.
However, salmon consumption in China skews toward fresh sashimi and premium positioning, with limited localization into cooked or canned formats, suggesting that canned salmon growth in China will depend on product innovation and consumer education around convenience and omega-3 benefits. North America remains a mature market with stable per capita consumption, though Alaska's 2026 harvest decline of 36% to 125.5 million fish may tighten domestic supply and elevate raw material costs Alaska Department of Fish and Game. Europe faces regulatory headwinds from the December 2024 EU BPA ban on can coatings, requiring 18-month reformulation and potential supply disruptions European Commission, but benefits from strong sustainability certification demand, with MSC-certified wild salmon accounting for 15.2% of preserved seafood in North America versus only 0.3% in Central Europe, signaling untapped growth potential.
South America, led by Chile as the second-largest Atlantic salmon producer after Norway, exported 224,384 tonnes of Atlantic salmon in H1 2025 valued at USD 2.29 billion, with coho exports of 103,201 tonnes valued at USD 815 million. The Middle East and Africa's growth is concentrated in UAE and Saudi Arabia, where rising disposable incomes, expatriate populations familiar with canned seafood, and government stockpiling programs are driving demand, though infrastructure gaps in cold-chain logistics favor shelf-stable formats over fresh and frozen alternatives.

Competitive Landscape
The canned salmon market is moderately consolidated, significantly impacting processing capacities and shaping competitive dynamics. In 2024, Silver Bay Seafoods strategically expanded its operations by acquiring Trident Seafoods' Ketchikan and False Pass facilities, along with Peter Pan Seafoods' Alaska operations. These acquisitions highlight how leading companies capitalize on economies of scale to effectively manage supply chain fluctuations and ensure consistent profitability in a competitive landscape.
Technology adoption within the market is centered on enhancing sustainability and improving operational efficiency, rather than introducing disruptive innovations. Companies are channeling investments into advanced packaging solutions and optimizing supply chain processes to meet evolving market demands. A notable example is SalMar's Marine Donut, a closed-containment aquaculture system that represents a significant technological advancement. This system not only enhances production efficiency but also addresses critical environmental concerns, aligning with the industry's growing focus on sustainable practices.
Emerging opportunities in the market lie within direct-to-consumer channels and premium product segments. Brands such as Wild Alaskan Company are setting benchmarks by implementing scalable business models that bypass traditional retail gatekeepers, enabling them to directly connect with consumers. The market increasingly rewards companies that combine large-scale operations with distinctive brand identities. This trend is particularly evident among firms that prioritize sustainability and develop products catering to consumer preferences for convenience and environmental responsibility, thereby aligning with broader market expectations.
Canned Salmon Industry Leaders
Trident Seafoods
Thai Union Group
Starkist Co.
Alaska Seafood Company
FCF Co. Ltd (Bumble Bee)
- *Disclaimer: Major Players sorted in no particular order

Recent Industry Developments
- August 2025: Silver Bay Seafoods, based in Sitka, Alaska, won a US Department of Agriculture (USDA) contract worth USD 877,000 for 100 metric tons of canned pink salmon. The salmon is destined for Sri Lanka under the McGovern-Dole International Food for Education and Child Nutrition Program, which aids education, child development, and food security in low-income countries.
- April 2024: Silver Bay Seafoods completed acquisition of Peter Pan Seafoods' Valdez facility and obtained licensing for Humpty Dumpty, Demmings, and Double Q canned salmon brands. The acquisition includes operations at additional facilities in Port Moller and Dillingham for enhanced processing diversity.
- April 2024: Silver Bay Seafoods finalized acquisition of Trident Seafoods' Ketchikan processing facility, enhancing operational capacity in Southeast Alaska salmon fisheries. This transaction represents part of broader industry consolidation addressing supply chain optimization needs.


Global Canned Salmon Market Report Scope
| Skinless and Boneless |
| Minced/Flaked |
| Chunks |
| Fillets |
| Wild Caught |
| Fam Raised |
| Pink |
| Sockeye |
| Coho |
| Chinook |
| Atlantic |
| Others |
| Retail | Supermarkets/Hypermarkets |
| Convenience Stores | |
| Online Retail | |
| Others | |
| Foodservice/HoReCa |
| North America | United States |
| Canada | |
| Mexico | |
| Rest of North America | |
| Europe | Germany |
| United Kingdom | |
| France | |
| Italy | |
| Spain | |
| Netherlands | |
| Sweden | |
| Poland | |
| Belgium | |
| Rest of Europe | |
| Asia-Pacific | China |
| India | |
| Japan | |
| Australia | |
| South Korea | |
| Vietnam | |
| Indonesia | |
| Rest of Asia-Pacific | |
| South America | Brazil |
| Argentina | |
| Chile | |
| Peru | |
| Colombia | |
| Rest of South America | |
| Middle East and Africa | United Arab Emirates |
| Saudi Arabia | |
| South Africa | |
| Nigeria | |
| Rest of Middle East and Africa |
| Product Form | Skinless and Boneless | |
| Minced/Flaked | ||
| Chunks | ||
| Fillets | ||
| Source | Wild Caught | |
| Fam Raised | ||
| Species | Pink | |
| Sockeye | ||
| Coho | ||
| Chinook | ||
| Atlantic | ||
| Others | ||
| Distribution Channels | Retail | Supermarkets/Hypermarkets |
| Convenience Stores | ||
| Online Retail | ||
| Others | ||
| Foodservice/HoReCa | ||
| Geography | North America | United States |
| Canada | ||
| Mexico | ||
| Rest of North America | ||
| Europe | Germany | |
| United Kingdom | ||
| France | ||
| Italy | ||
| Spain | ||
| Netherlands | ||
| Sweden | ||
| Poland | ||
| Belgium | ||
| Rest of Europe | ||
| Asia-Pacific | China | |
| India | ||
| Japan | ||
| Australia | ||
| South Korea | ||
| Vietnam | ||
| Indonesia | ||
| Rest of Asia-Pacific | ||
| South America | Brazil | |
| Argentina | ||
| Chile | ||
| Peru | ||
| Colombia | ||
| Rest of South America | ||
| Middle East and Africa | United Arab Emirates | |
| Saudi Arabia | ||
| South Africa | ||
| Nigeria | ||
| Rest of Middle East and Africa | ||


Key Questions Answered in the Report
What is the market size for canned salmon market in 2026-2031?
The global canned salmon market was valued at USD 7.20 billion in 2025, is estimated at USD 7.60 billion in 2026, and is forecast to reach USD 9.95 billion by 2031, expanding at a compound annual growth rate of 5.54% during 2026-2031.
Which region is expected to record the fastest growth through 2031?
The Middle East & Africa region is projected to post the highest 7.85% CAGR on the back of food-security programs and expanding modern retail
Which product form currently leads volume?
Skinless and boneless formats commanded 38.35% canned salmon market share in 2025, driven by convenience demand
How big is the opportunity for farm-raised canned salmon?
Farm-raised supply is forecast to grow at 7.81% CAGR as ASC standards improve credibility and year-round volumes stabilize pricing
Page last updated on:


