
Market Overview
| Study Period | 2021 - 2031 |
|---|---|
| Forecast Data Period | 2026 - 2031 |
| Base Year Market Size (2025) | USD 38.51 Billion |
| Market Size (2026) | USD 38.93 Billion |
| Market Size (2031) | USD 41.1 Billion |
| Growth Rate (2026 - 2031) | 1.09 % |
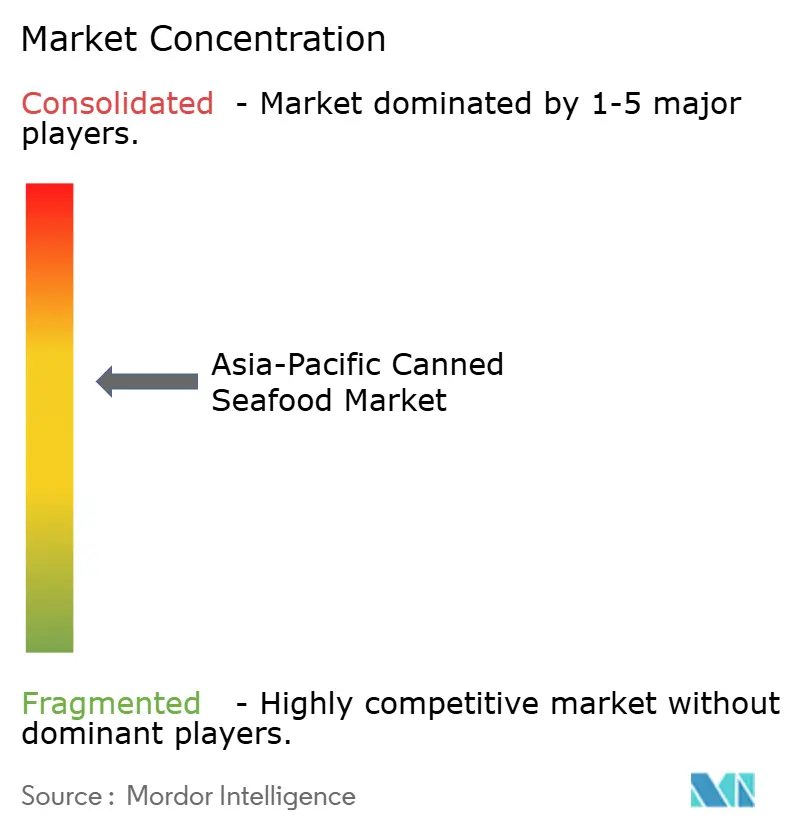
| Market Concentration | Medium |
Major Players
*Disclaimer: Major Players sorted in no particular order Image © Mordor Intelligence. Reuse requires attribution under CC BY 4.0. |
|
Asia-Pacific Canned Seafood Market Analysis by Mordor Intelligence
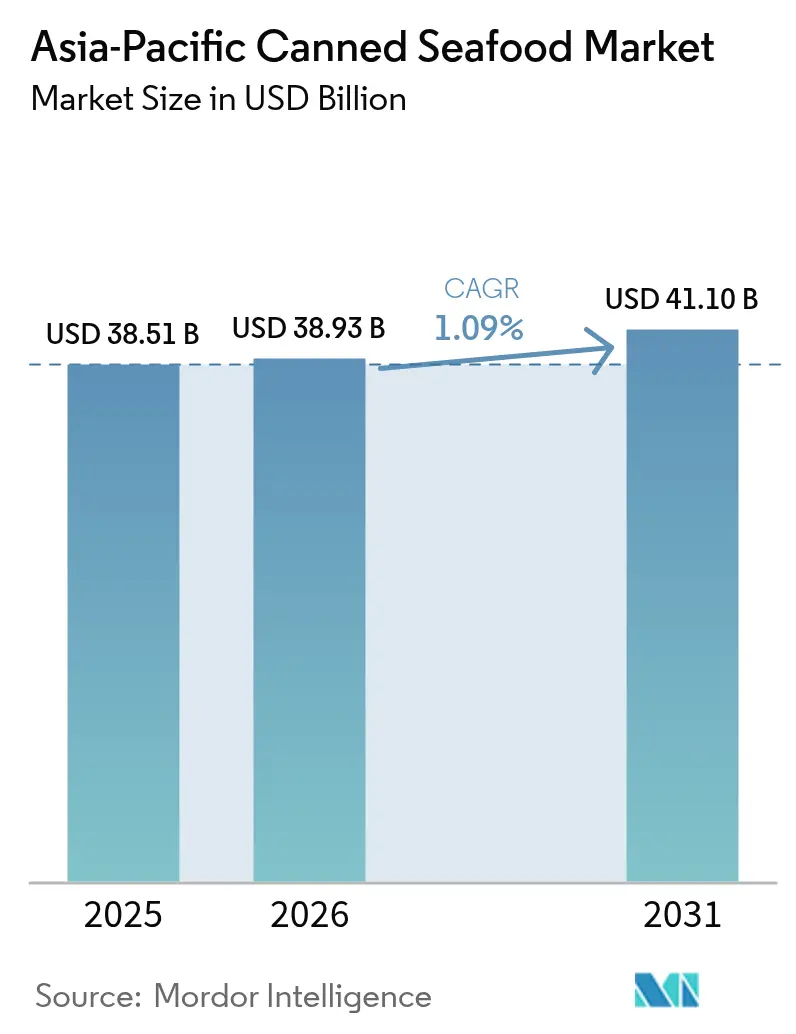
The Asia-Pacific canned seafood market size was valued at USD 38.51 billion in 2025 and estimated to grow from USD 38.93 billion in 2026 to reach USD 41.1 billion by 2031, at a CAGR of 1.09% during the forecast period (2026-2031). This growth is driven by several factors, including increasing urban migration, a rise in single-person households, and a widening protein gap in middle-income economies. These trends are prompting consumers to transition from chilled seafood options to shelf-stable alternatives such as canned fish, shrimp, and mollusks. Retailers are actively supporting this shift by expanding their private-label product assortments, while processors are implementing strategies to maintain their market share. These strategies include the adoption of traceability platforms, the use of BPA-free can linings, and the rollout of retort pouches, which offer convenience and extended shelf life. Sustainability has become a critical factor in the market, with eco-conscious consumers increasingly favoring responsibly sourced products. The Marine Stewardship Council's certification of 14 additional fisheries in 2024 has further encouraged mainstream shoppers to prioritize sustainable options. Although strict quotas on wild-catch fisheries present challenges, the market is benefiting from a strong aquaculture sector. In 2024, aquaculture production exceeded 78 million metric tons, ensuring a consistent supply of raw materials to support the industry's growth.
Key Report Takeaways
- By species, canned fish led with 75.62% revenue share in 2025 and is advancing at a 2.71% CAGR through 2031.
- By packaging material, steel cans accounted for 64.82% of the Asia-Pacific canned seafood market share in 2025, while retort pouches posted the fastest 1.39% CAGR to 2031.
- By product form, chunks and pieces captured 66.21% of the Asia-Pacific canned seafood market size in 2025 and are expanding at a 1.18% CAGR.
- By distribution channel, off-trade outlets held 63.97% of the 2025 value, with online grocery inside off-trade growing at a 1.28% CAGR.
Note: Market size and forecast figures in this report are generated using Mordor Intelligence’s proprietary estimation framework, updated with the latest available data and insights as of 2026.
Market Trends and Insights
Drivers Impact Analysis of Asia-Pacific Canned Seafood Market*
| Driver | (~) % Impact on CAGR Forecast | Geographic Relevance | Impact Timeline |
|---|---|---|---|
| Convenience attributes and extended shelf life capabilities in canned seafood | +0.25% | China, Japan, South Korea | Medium term (2-4 years) |
| Demand generation through urbanization and fast-paced lifestyles | +0.30% | China, Indonesia, India, Thailand, Vietnam | Long term (≥4 years) |
| Advancements in canning technology and packaging | +0.15% | Japan, South Korea, Australia, New Zealand | Medium term (2-4 years) |
| Protein-rich food products driven by health consciousness | +0.20% | Singapore, Australia, Japan, urban China | Short term (≤2 years) |
| Cultural familiarity with seafood-based diets driving consistent consumption | +0.18% | Japan, South Korea, coastal China, Thailand | Long term (≥4 years) |
| Growth in aquaculture production providing reliable raw material sources | +0.22% | China, Indonesia, Thailand, Vietnam, India | Long term (≥4 years) |
| Source: Mordor Intelligence | |||
Convenience attributes and extended shelf life capabilities in canned seafood
Canned seafood, which is often fully cooked and deboned, provides the convenience of being ready-to-eat or ready-to-use. This enables consumers to prepare meals quickly without the need for thawing, cleaning, or complex cooking. Such convenience caters to the fast-paced lifestyles of urban residents, single-person households, and busy families. Consequently, products like canned tuna, salmon, and mixed seafood have become staples for salads, sandwiches, rice bowls, and lunchboxes, both at home and in foodservice. For example, as of the end of 2024, South Korea's welfare ministry reported that single-person households totaled 8.05 million, accounting for 36.1% of the population[1]Source: South Korean ministry of health and welfare, "Social Security Factbook", mohw.go.kr. With a shelf life exceeding 24 months, canned seafood serves as a critical pantry item, particularly in markets where cold-chain infrastructure lags behind consumption needs. In Indonesia, for instance, rural electrification reached 99% in 2024, yet refrigerator ownership remains limited in outer islands [2]Source: World Bank, "Indonesia Sustainable Least-cost Electrification", worldbank.org. In such areas, ambient-stable protein sources like canned seafood address a significant gap. Additionally, retort processing at 121 degrees Celsius ensures safety by eliminating microbial risks without requiring preservatives. This process appeals to health-conscious consumers who carefully examine ingredient labels. Beyond regular consumption, emergency preparedness also drives demand. For instance, the Tokyo Metropolitan Government recommends households stock three days' worth of shelf-stable food. Following earthquake advisories, canned tuna sales experienced a significant increase.
Demand generation through urbanization and fast-paced lifestyles
Urban populations in the Asia-Pacific region are growing, with China's urbanization rate reached 67% in 2024, according to the National Bureau of Statistics of China [3]Source: National Bureau of Statistics of China, "Degree of urbanization in China", stats.gov.cn. In rapidly growing megacities, professionals with limited time are increasingly turning to ready-to-eat solutions as an alternative to traditional meal preparation. Canned seafood has emerged as a convenient option, offering a quick 90-second microwave preparation time while delivering 20 grams of protein per 100-gram serving, catering to the nutritional needs of these busy individuals. In India, the expanding middle class is driving a shift in consumption patterns, with canned tuna gaining traction in modern trade channels. It is being adopted as a versatile ingredient for sandwiches and salad toppings, categories that were previously dominated by chicken. Additionally, the rise in single-person households across the region has brought greater focus to portion control and minimizing food waste. These priorities align well with the inherent benefits of 150-gram and 200-gram canned formats, which are designed to meet the needs of this growing demographic.
Protein-rich food products driven by health consciousness
In urban areas, the per capita protein intake has increased significantly, surpassing the World Health Organization's recommended levels for adult males. Despite this growth, consumers are increasingly shifting their preferences from red meat to marine-based protein sources, which are widely regarded as having lower saturated fat content. Canned salmon and tuna, in particular, are gaining popularity due to their high omega-3 fatty acid content, specifically eicosapentaenoic acid (EPA) and docosahexaenoic acid (DHA). These fatty acids have been clinically proven to offer cardiovascular health benefits, a point that brands in markets such as Singapore and Australia have effectively highlighted in their marketing strategies. Additionally, in South Korea, fitness influencers have actively promoted canned mackerel as an ideal post-workout snack through social media platforms. This targeted promotion has driven a notable increase in consumption among individuals under the age of 35, further boosting the demand for canned marine products in this demographic.
Growth in aquaculture production providing reliable raw material sources
As aquaculture production expands, it's bolstering the Asia-Pacific canned seafood market. This growth ensures a reliable supply of key raw materials, such as tuna, shrimp, and salmon. By doing so, it reduces the unpredictability associated with wild capture fisheries, leading to more stable canning operations. Notably, farmed salmon from Tasmania and shrimp from Thailand are now making their way into canning lines. This shift diversifies the supply chain, moving beyond the traditionally wild-caught tuna and sardines, which are often affected by quota-related volatility. Vertical integration in the industry is on the rise. For instance, Thai Union Group has taken a proactive approach, operating 14 aquaculture sites throughout Southeast Asia. This strategy shields the company from the price fluctuations of the spot market, a challenge that has squeezed margins for its smaller competitors in 2024. Thanks to the reduced price volatility from aquaculture, canned seafood products can be competitively priced. This advantage not only facilitates entry into price-sensitive market segments but also opens doors to emerging channels, including e-commerce.
Restraints Impact Analysis of Asia-Pacific Canned Seafood Market*
| Restraint | (~) % Impact on CAGR Forecast | Geographic Relevance | Impact Timeline |
|---|---|---|---|
| Environmental sustainability concerns including overfishing and depletion of marine stocks constraining supply | -0.18% | Japan, Philippines, Indonesia | Long term (≥4 years) |
| Strict fishing quotas, regulatory measures, and environmental guidelines | -0.12% | Japan, Australia, New Zealand, South Korea | Medium term (2-4 years) |
| Supply chain disruptions from climate change | -0.10% | Philippines, Vietnam, coastal Thailand | Short term (≤2 years) |
| BPA-free can-lining mandates raising conversion costs | -0.08% | South Korea, Australia, Japan | Short term (≤2 years) |
| Source: Mordor Intelligence | |||
Environmental sustainability concerns including overfishing and depletion of marine stocks constraining supply
Concerns over environmental sustainability, especially regarding overfishing and the depletion of marine stocks, are putting the brakes on the Asia-Pacific canned seafood market. These issues are limiting the availability of raw materials, driving up procurement costs, and introducing regulatory challenges that disrupt both production and exports. Wild tuna stocks, particularly in the Western and Central Pacific, a key source for the global canned-tuna supply, are facing increasing pressures. Notably, the biomass of bigeye tuna is declining, straining its sustainable yield. In response to these pressures, Japan's Fisheries Agency slashed bluefin tuna quotas by 15% in 2024. This move has compelled processors to pivot towards skipjack and yellowfin varieties, which come with lower price premiums. Furthermore, processors without certified supply chains are feeling the pinch, as they grapple with eroding margins while competing for a dwindling volume of compliant raw materials.
Strict fishing quotas, regulatory measures, and environmental guidelines
In the Asia-Pacific canned seafood market, strict fishing quotas, regulatory measures, and environmental guidelines are limiting access to raw materials, driving up compliance costs, and disrupting production schedules. These disruptions particularly affect processors reliant on wild-caught tuna, sardines, and shrimp. For instance, Japan's Fisheries Agency has implemented vessel-specific catch limits and seasonal closures, leading to a reduced total allowable catch for mackerel, which in turn has a direct effect on domestic canning operations. Similarly, Australia's Commonwealth Fisheries Harvest Strategy ensures that fish stocks remain above 20% of their unfished biomass. This policy led to quota reductions for sardines and anchovies in 2024. Furthermore, in 2024, the International Commission for the Conservation of Atlantic Tunas expanded its catch documentation schemes to the Pacific, imposing additional administrative responsibilities on exporters. As a result of these collective measures, canneries find it challenging to scale production in response to consumer demand, as they are bound by regulated harvest levels.
*Our forecasts treat driver/restraint impacts as directional, not additive. The impact forecasts reflect baseline growth, mix effects, and variable interactions.
Asia-Pacific Canned Seafood Market Segment Analysis
By Species/Type:
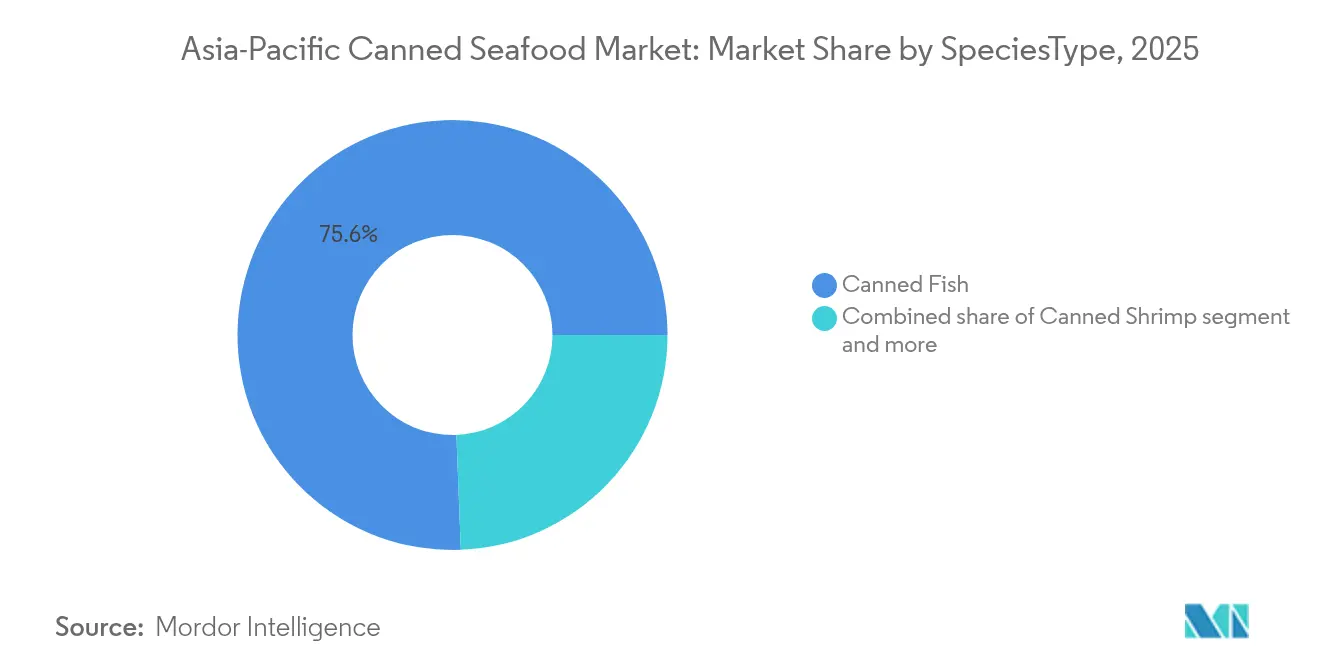
Tuna Variants Anchor Volume While Salmon PremiumizesCanned fish accounted for 75.62% of the market share in 2025 and is expected to grow at a rate of 2.71% through 2031, surpassing all other species categories. Tuna fish, including skipjack, yellowfin, and albacore, lead this segment, supported by robust supply chains in Thailand and the Philippines, where major players like Thai Union Group and Century Pacific Food operate large-scale processing facilities. Salmon is establishing a premium niche, with Australian and Japanese brands introducing single-origin, wild-caught variants priced higher than standard tuna SKUs. These premium products attract affluent consumers seeking higher omega-3 content and lower mercury levels. Sardines and mackerel continue to be staples in cost-sensitive markets such as Indonesia and the Philippines, but climate-induced catch variability is undermining their role as reliable budget options.
Canned shrimp and prawns, while holding a smaller share of the market, are gaining traction, particularly in China's food-service industry. Hot-pot and noodle chains in the region prefer these products for their convenience, portion control, and extended shelf life, which align with operational efficiency. Other seafood types, including crab, clams, and squid, cater to niche culinary applications but face stiff competition from frozen alternatives that offer superior texture retention. To stay competitive and meet evolving consumer preferences, processors are focusing on innovation by introducing value-added products such as flavored tuna pouches and ready-to-eat salmon salads. These new formats aim to enhance convenience and appeal to health-conscious and time-pressed consumers.



By Packaging Material:
Retort Pouches Challenge Steel Can IncumbencySteel cans maintained a significant 64.82% market share in 2025, primarily due to their exceptional durability, high recyclability, and compatibility with high-temperature retort processing methods. These attributes make steel cans a preferred choice for various applications, ensuring their continued dominance in the market. On the other hand, retort pouches are anticipated to grow at a steady rate of 1.39% through 2031. This growth is largely attributed to their lightweight nature, which significantly reduces freight costs, particularly for long-haul shipments originating from Southeast Asia and destined for markets in Australia and Japan. Aluminum cans occupy an intermediate position in the market, offering a lighter alternative to steel cans but at a higher material cost. These cans are predominantly used in premium segments where brands prioritize recyclability and enhanced shelf appeal to attract environmentally conscious consumers.
In 2024, regulatory changes in Australia and South Korea mandated the use of BPA-free epoxy linings for food-contact cans. This requirement increased coating costs, compelling smaller processors to either consolidate operations or exit the market altogether. Retort pouches, however, completely avoid this issue by utilizing polyester and nylon laminates, which do not require phenolic resins. Additionally, Japan's Toyo Seikan Group introduced an innovative transparent retort pouch in 2024, allowing consumers to visually inspect product quality before making a purchase. Other packaging materials, such as glass jars and rigid plastic containers, continue to face limitations due to their susceptibility to breakage and higher per-unit costs, which restrict their market penetration. The shift toward retort pouches is particularly noticeable in single-serve packaging formats, which are increasingly popular among urban millennials seeking convenience and portability.
By Product Form:
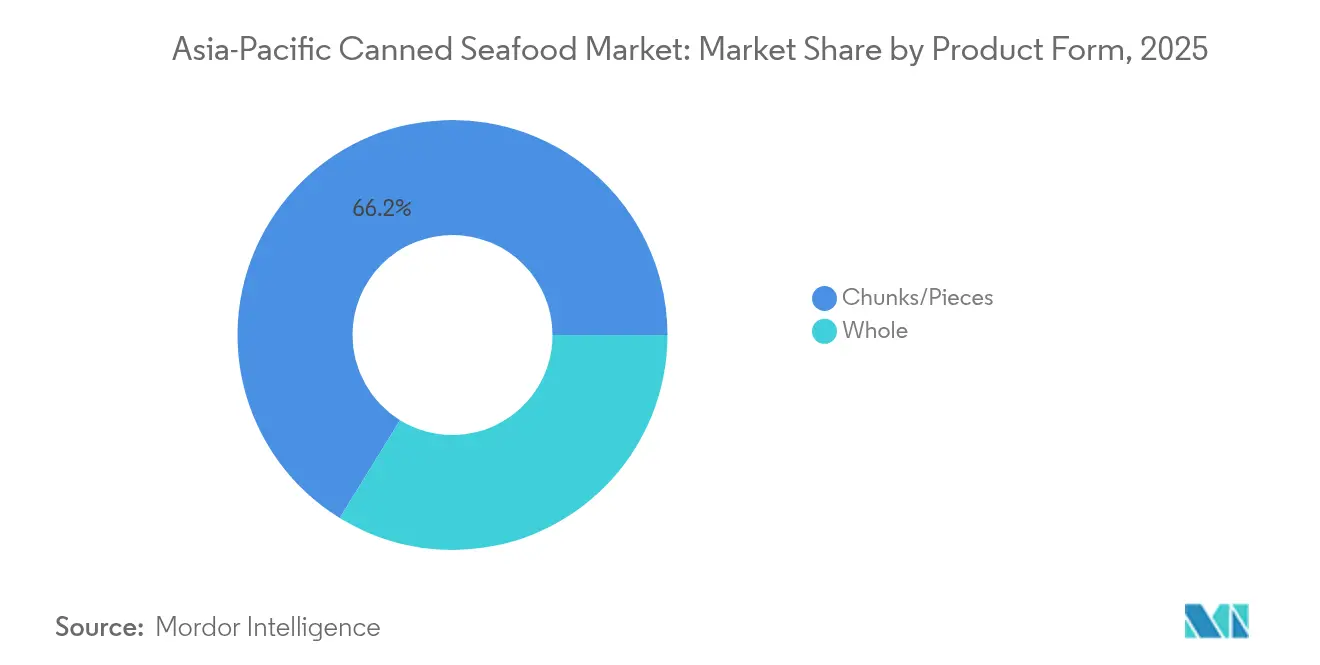
Chunks and Pieces Dominate Food-Service and Ready-Meal ChannelsChunks and pieces accounted for a significant 66.21% market share in 2025 and are expected to grow at a rate of 1.18% through 2031, highlighting their versatility in sandwiches, salads, and pasta dishes. Food-service operators in China and Japan prefer this format due to its labor-saving preparation and consistent portioning. Whole fish, particularly sardines and mackerel, appeal to traditional consumers in the Philippines and Indonesia, who value visual authenticity. However, this segment is losing ground as younger consumers prioritize convenience over traditional preferences, and whole-fish products face higher breakage rates during logistics.
Chunks and pieces are experiencing the fastest growth, driven by demand from ready-meal manufacturers. For instance, Thailand's Pataya Food Group supplies pre-seasoned tuna to instant-noodle producers across Southeast Asia. This growth aligns with urbanization trends; as meal-kit subscriptions and ghost kitchens expand in Singapore and South Korea, the demand for pre-portioned, shelf-stable proteins is increasing. Proponents of whole fish emphasize the nutritional benefits of bone-in formats, such as calcium and collagen, which are often absent in boneless chunks. However, this messaging has primarily resonated with Japan's senior demographic and has seen limited acceptance elsewhere.
By Distribution Channel:
Off-Trade Consolidates While Online Penetration AcceleratesOff-trade channels accounted for a significant 63.97% share of the market in 2025, with a projected growth rate of 1.29% through 2031. This growth is primarily driven by the rapid expansion of supermarkets in tier-2 and tier-3 cities across China and India. Supermarkets and hypermarkets continue to dominate as the largest sub-channel within off-trade distribution. These outlets capitalize on extensive promotional campaigns and the introduction of private-label products, which exert pressure on branded product margins. In Japan and South Korea, convenience stores are undergoing a transformation into meal-solution hubs. For instance, FamilyMart and 7-Eleven have introduced heated canned-seafood displays, strategically positioning this category alongside popular ready-to-eat items such as bento boxes and onigiri, thereby enhancing consumer convenience and variety.
Specialty stores, including fishmongers and gourmet retailers, specifically target premium market segments by offering carefully curated assortments of imported canned seafood, particularly from Spain and Portugal. These stores cater to consumers seeking high-quality and unique products. Additionally, other off-trade channels, such as discount stores and cash-and-carry outlets, play a crucial role in serving small restaurants and catering businesses. These businesses prioritize cost efficiency and bulk pricing over brand loyalty, making these channels essential for their operations. On the other hand, on-trade distribution, which includes restaurants, hotels, and catering services, holds the remaining 36.03% share of the market. However, growth in this segment is hindered by persistent challenges, including labor shortages and rising food-service costs, particularly in key markets like Japan and Australia.
Geography Analysis
China Canned Seafood Market
China maintained a significant 30.88% share of the Asia-Pacific canned seafood revenue in 2025, primarily driven by the increasing consumption of canned fish in tier-2 cities. This growth is supported by the expanding presence of modern retail outlets in these areas, which make canned seafood more accessible to consumers. Additionally, China's dominance in aquaculture plays a pivotal role in ensuring a steady supply of cost-effective raw material base for local processors. Companies such as Shanghai Maling Aquarius and China Tuna Industry Group benefit from this competitive advantage, enabling them to cater to the growing domestic demand effectively.
APAC Canned Seafood Market
Indonesia emerged as the fastest-growing geography in the region, with a projected CAGR of 1.45% through 2031. This growth trajectory is underpinned by a combination of factors, including a rapidly expanding population and government-led initiatives aimed at increasing protein consumption, particularly in rural areas where nutritional deficiencies are more prevalent. On the other hand, Thailand has solidified its position as the processing hub of the Asia-Pacific region. The country primarily exports its processed seafood products to key markets such as Japan, Australia, and the Middle East, leveraging its well-established processing infrastructure and expertise. In contrast, India's canned seafood market is still at a nascent stage. However, urban millennials in cities like Mumbai and Bengaluru are increasingly adopting canned tuna as a convenient, high-protein, and low-carbohydrate snack option. This trend is further amplified by the growing fitness culture and rising disposable incomes in these metropolitan areas, which are driving demand for healthier and more convenient food choices.
APAC and Oceania Canned Seafood Market
Singapore and South Korea are witnessing a clear trend toward premiumization in the canned seafood market. Consumers in these countries are increasingly opting for products that are sustainably sourced, low in sodium, and available in a variety of innovative flavors. These premium offerings are gaining traction over standard products, reflecting a shift in consumer preferences toward healthier and more environmentally conscious choices. Meanwhile, Australia and New Zealand are focusing on traceability and local sourcing as key differentiators in their canned seafood markets. In 2024, Australian processors, such as Spectra International Limited, highlighted their wild-caught tuna sourced from the Coral Sea. This initiative specifically targeted eco-conscious consumers who are willing to pay a premium for products certified by the Marine Stewardship Council, underscoring the growing importance of sustainability and ethical sourcing in the region.
Regulatory Landscape
Food safety and fisheries controls in Asia-Pacific canned seafood are tightening around sterilization performance, contaminant limits, and supply-chain documentation. In China, the national standard GB 7098-2025 for canned foods was issued on March 16, 2025 and implemented on March 16, 2026, reinforcing requirements for commercially sterile canned products and heat sterilization. China also implemented GB/T 24403-2023 for canned tuna on December 1, 2024, adding clearer requirements on product quality, inspection, and authenticity markers across major tuna species.
Across key trade flows, import clearance is increasingly tied to traceability and conformity declarations, not only end-product testing. The Philippines notified a 2026 measure (Fisheries Administrative Order No. 275, in force from December 7, 2025) that strengthens food safety controls, inspection, and traceability requirements for imported fish and aquatic products intended for canning, while Vietnam issued Decree No. 46/2026/ND-CP (January 26, 2026) detailing implementation elements of the Law on Food Safety, including conformity declarations for pre-packaged processed foods and primary packaging. At a regional level, ASEAN coordination through the ACCSQ Prepared Foodstuff Product Working Group (PFPWG) and Codex-aligned contaminant principles continues to shape harmonization pathways for exporters managing multi-market label, testing, and documentation requirements.
Value Chain Analysis
The value chain begins with capture fisheries and fast-growing aquaculture supply, followed by primary processing (cleaning, loining, precooking), canning/retort processing, packaging procurement (tinplate/steel, aluminum, and retort pouch laminates), and then distribution through off-trade retail, online grocery, and on-trade foodservice. Thailand remains a central processing hub for the region, with clusters of facilities in Samut Sakhon and Songkhla supporting large-scale exports and contract manufacturing. Processors also depend on imported frozen tuna loins from distant-water fleets (including Taiwan, Korea, Japan, Spain, and the United States) where domestic catch is insufficient.
Key pinch points include volatility in compliant wild-catch supply under quota regimes, archipelagic distribution constraints in parts of Southeast Asia, uneven last-mile cold-chain infrastructure, and exposure to concentrated tinplate supply. Companies have responded with network optimization and procurement programs, for example Thai Union Group implemented volume reallocation across its global production network in June 2025 to improve supply-chain efficiency, and completed a selective supplier price relief program by November 2025 to address procurement plan variances. Packaging shifts toward lighter formats (such as retort pouches) and broader traceability adoption (QR-code and platform-based documentation) are increasingly used to reduce freight weight sensitivity and align with import compliance expectations in premium markets.
Competitive Landscape
The Asia-Pacific canned seafood market demonstrates moderate consolidation, with key players such as Thai Union Group, Nippon Suisan Kaisha, Dongwon Industries, Century Pacific Food, and Tri Marine Group accounting for a significant share of regional revenues. These leading companies adopt vertical integration strategies, protecting themselves from raw material price volatility and optimizing profit margins across the value chain. In contrast, smaller processors focus on cost efficiency, sourcing products from spot markets and contract packers. In 2024, private-label brands gained significant traction in Australia and New Zealand, prompting established brands to differentiate through sustainability certifications, innovative flavors, and premium packaging formats like retort pouches and easy-open lids.
Global companies have prioritized expanding their presence in the Asia-Pacific's emerging economies. With rising income levels and growing awareness of healthy eating in these regions, companies are addressing the evolving demand for canned seafood. The convenience of handling and storing canned seafood further enhances its market potential. Regional private-label brands are gaining market share by appealing to cost-conscious consumers, while global brands maintain a strong presence due to their established reputation. Expanding into new geographies has been a key strategy to build a larger consumer base, while product innovation, particularly in flavor combinations, remains a critical approach to navigating market dynamics.
India offers significant growth opportunities, with organized retail expanding and canned seafood underpenetrated compared to frozen and fresh alternatives. Dongwon Industries, for example, implemented AI-powered quality inspection systems in its Thai facilities in 2024, reducing defect rates by 14% and increasing throughput by 9%, according to company reports. In Japan and South Korea, emerging disruptors are transforming the market by bypassing traditional retail channels. These direct-to-consumer brands leverage subscription models and social media marketing to attract younger consumers. The rise in patent filings for innovations such as oxygen-scavenging can linings and microwave-safe retort pouches highlights the importance of packaging innovation as brands compete to extend shelf life and improve convenience.
Asia-Pacific Canned Seafood Industry Leaders
-
Thai Union Group
-
Nippon Suisan Kaisha
-
Dongwon Industries
-
Century Pacific Food
-
Tri Marine Group
- *Disclaimer: Major Players sorted in no particular order
Asia-Pacific Canned Seafood Market Companies Covered in this Report
- Thai Union Group
- Nippon Suisan Kaisha (NISSUI)
- Dongwon Industries
- Century Pacific Food Inc.
- Yuehai Feed Group Co., Ltd.
- Kyokuyo Co., Ltd.
- Tri Marine Group
- Tropical TC Boy Sdn Bhd.
- Spectra International Limited
- FCF Co., Ltd.
- Pataya Food Group
- Princes Group
- Bumble Bee Foods LLC
- King Oscar AS
- Wild Planet Foods Inc.
- Shanghai Maling Aquarius Co., Ltd.
- China Tuna Industry Group
- PT Jaya Wirawan (Indonesian Canning)
- Abad Fisheries Pvt Ltd.
- Maruha Nichiro Corporation

Market Opportunities and Future Outlook
Opportunity is concentrated in trade-access corridors where tariff schedules and compliance readiness favor canned tuna and other shelf-stable seafood exports. The United Kingdom joining the CPTPP in December 2024 created a defined tariff-reduction schedule for Vietnam’s canned tuna exports to reach zero over seven years, increasing the relevance of Vietnam-based processors that can meet rules of origin and documentation requirements. At the same time, the region is standardizing traceability expectations through mechanisms such as the ASEAN Catch Documentation Scheme and SEAFDEC-led guidance aimed at reducing illegal, unreported, and unregulated (IUU) product entry, which creates room for platforms, labeling systems, and audited chain-of-custody programs that reduce friction for cross-border shipments.
Product and process differentiation is also centered on packaging and processing technologies that reduce compliance and logistics penalties. With BPA-free can-lining mandates cited as a cost driver in markets such as South Korea and Australia, processors have more incentive to expand retort pouch offerings that sidestep epoxy-lining conversion constraints while improving freight efficiency. In addition, industry movement toward automation, robotics, and data-driven quality systems supports higher-throughput plants competing for retailer private-label volumes and export contracts, while emerging preservation approaches discussed in technical literature (such as high-pressure processing and microwave heating) point to an R&D pipeline aimed at improving texture and shelf-life performance in premium SKUs.
Recent Industry Developments in Asia-Pacific Canned Seafood Market
- July 2026: Thai Union Group launched an industry-first shelf-stable tuna product in a recyclable mono-material pouch under its John West brand in Europe. The product expands a scalable packaging alternative to metal cans and supports its positioning with retailers and consumers focused on recyclability and convenience formats.
- January 2026: Nippon Suisan Kaisha (Nissui) announced the acquisition of Chilean salmon-farming company Pesquera Yadran S.A. The deal deepens vertical integration in salmon aquaculture and secures additional raw material access for value-added seafood lines that compete with premium canned fish offerings in Asia-Pacific channels. The move enhances supply security for canned salmon portfolios in Asia-Pacific and supports continuity of raw material flows for premium products.
- April 2024: Kyokuyo established a joint venture with Clear Ocean Seafood to expand its operating footprint and capabilities in seafood. The partnership supports broader sourcing and processing coordination, which can improve access to stable inputs for shelf-stable seafood portfolios.


Asia-Pacific Canned Seafood Market Report Scope and Research Methodology
Market Definition and Coverage
For this study, the market covers retail and foodservice sales of shelf-stable seafood that is preserved and sold as canned or pouch-packed products across Asia Pacific, counted in value terms.
Scope exclusions: Fresh or chilled seafood, frozen seafood, and non-seafood canned proteins are excluded from this market sizing.
Segments Covered in This Report
-
By Species/Type
-
Canned Fish
- Tuna
- Salmon
- Sardines
- Mackerel
- Other Canned Fish
- Canned Shrimp
- Canned Prawns
- Other Types
-
Canned Fish
-
By Packaging Material
- Steel Cans
- Aluminum Cans
- Retort Pouches
- Other Packaging Material
-
By Product Form
- Whole
- Chunks/Pieces
-
By Distribution Channel
- On- Trade
-
Off-Trade
- Supermarkets/Hypermarkets
- Convenience Stores
- Online Retail
- Specialty Stores
- Other Off-Trade Distribution Channels
-
By Country
- China
- Japan
- India
- Thailand
- Singapore
- Indonesia
- South Korea
- Australia
- New Zealand
- Rest of Asia-Pacific
Data Sources, Market Sizing, and Validation
Desk Research
Desk research was used to set the market boundary, build country context, and ground the demand drivers behind canned seafood purchases. We reviewed public sources such as FAO fishery and aquaculture statistics, UN Comtrade trade flows, national seafood production releases from ministries and statistics offices, and seafood safety and labeling rules shared by food regulators.
To keep the model realistic, we also cross-checked signals from industry bodies and technical sources, such as canned food and seafood associations, peer-reviewed journals covering processing and packaging, and customs or port publications where available. Company annual reports, investor presentations, and reputable business press were used to understand product mix shifts like tuna versus other fish, retort pouch adoption, and price movement patterns. In addition, paid subscriptions for company financials and an import-export shipment-level view were used in a limited way to validate major exporter and importer corridors. The sources listed here are illustrative, and many other public and paid references were used to clarify, validate, and close data gaps.
Primary Interviews and Surveys
Primary work focused on validating how volumes move through the supply chain and what price points are actually realized by country and channel. We spoke with a mix of brand owners, contract packers, importers, distributors, and large retail buyers across major Asia Pacific markets, and then we used follow-up checks to confirm assumptions that were unclear in desk research.
Distribution of primary research fieldwork respondents
| Company type | Respondent position |
|---|---|
| Top tier: 31% | CXOs: 19% |
| Mid tier: 49% | Functional/Unit leaders: 26% |
| Smaller Players: 20% | Managers: 55% |
Market-Sizing & Forecasting
The sizing starts with a top-down build where production, trade, and apparent consumption signals are used to reconstruct the canned seafood demand pool for Asia Pacific, and then country totals are translated into market value using average realized pricing by product group and channel. After that, selective bottom-up checks were added, such as sampling supplier and brand revenue splits, checking importer volumes in key corridors, and testing price bands seen in retail and foodservice.
A few inputs that mattered most were canned fish and shellfish import-export trends, local canning capacity utilization direction, retail penetration of shelf-stable seafood versus chilled alternatives, pack format mix (steel cans versus retort pouches), and typical price per kilogram movement by species. Where direct data was thin for smaller countries, values were bridged using proxy indicators like trade intensity, urban consumption trends, and neighboring market price relationships, and then adjusted during expert re-contacts.
For forecasting, we used scenario analysis supported by short time-series trend checks, because growth is influenced by a mix of pricing, household behavior, and supply availability. Assumptions on drivers like inflation-led price changes, packaging material cost pressure, and channel mix were validated with primary respondents before finalizing the forward curve.
Data Validation & Update Cycle
Outputs were validated through triangulation across independent signals, and the checks were run at both the regional total level and key country level. We reviewed variances against trade values, seafood consumption indicators, and company revenue direction, and then outliers were reworked until the logic could be explained in a repeatable way.
Before sign-off, the model goes through multi-step analyst reviews, with re-contact triggers when a country result deviates from known import or pricing movements. The report is refreshed annually, and interim updates are made when material events occur, such as sudden tariff changes, major supply disruptions, or sharp packaging cost shifts. Right before delivery, an analyst performs a fresh pass so clients receive the latest updated view.
Mordor Intelligence's Asia Pacific Canned Seafood Market Size Compared With Other Published Estimates
Published market values for canned seafood in Asia Pacific often disagree because researchers draw the line differently on what counts as canned, how they treat pouches, and whether pricing is measured at retail, ex-factory, or import value. Differences also come from currency timing, the year selected as the base, and how much the total is cross-checked with trade and consumption signals.
Frozen seafood, chilled seafood, and broader shelf-stable seafood kits often get pulled into some totals, but those items sit outside Mordor Intelligence's scope here, which keeps the value tied to canned and comparable shelf-stable pack formats only. Other gaps typically show up when a single regional growth assumption is applied across countries, when tuna is used as a proxy for all species, or when price per kilogram is projected without being revalidated with channel checks.
Benchmark comparison
| Source | Market Size | Gaps in Research Methodology |
|---|---|---|
| Mordor Intelligence | USD 38.51 B (2025) | |
| Industry Research House A | USD 5.36 B (2025) | Uses a narrower product definition that appears to focus mainly on select canned fish lines, and it under-represents large domestic consumption markets where trade data alone is not a full proxy for demand. |
| Syndicated Publisher B | USD 10.40 B (2025) | Back-solves Asia Pacific from a global share and emphasizes reported revenue shares, which can miss private-label and non-branded volumes and can apply uneven pricing assumptions across countries. |
The spread in the table is mostly explained by scope width and how demand is rebuilt for countries with meaningful local processing and consumption. By keeping the inputs anchored to observable trade, production context, and channel-level price checks, we arrive at a practical number that can be traced back to clear steps and refreshed consistently.


Key Questions Answered in the Report
How large is the Asia-Pacific canned seafood market in 2026?
It is valued at USD 38.93 billion and is forecast to grow to USD 41.1 billion by 2031.
Which species leads volume sales in Asia-Pacific canned seafood?
Tuna dominates, helping canned fish reach a 75.62% share in 2025.
What packaging format is growing fastest?
Retort pouches are posting a 1.39% CAGR thanks to lighter weight and microwave convenience.
Which country shows the fastest market growth?
Indonesia leads with a projected 1.45% CAGR through 2031.
Page last updated on:


 Your data is secure and never sold or shared.


