Market Overview
| Study Period | 2020 - 2031 |
|---|---|
| Forecast Data Period | 2026 - 2031 |
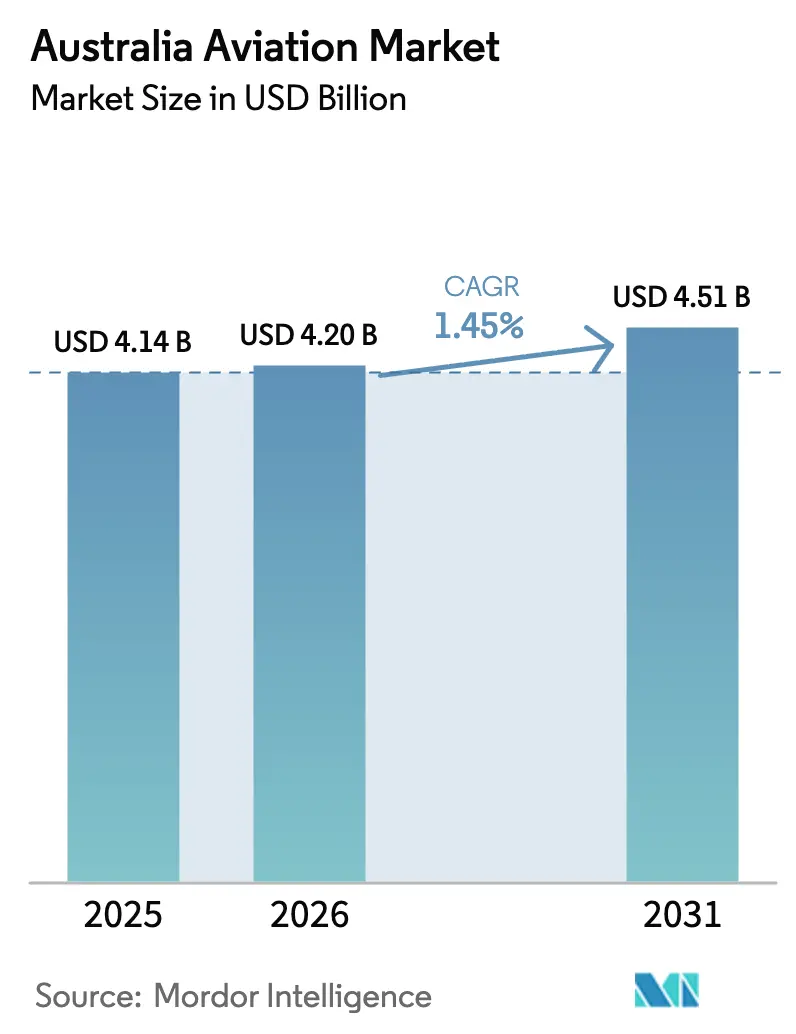
| Base Year Market Size (2025) | USD 4.14 Billion |
| Market Size (2026) | USD 4.2 Billion |
| Market Size (2031) | USD 4.51 Billion |
| Growth Rate (2026 - 2031) | 1.45% CAGR |
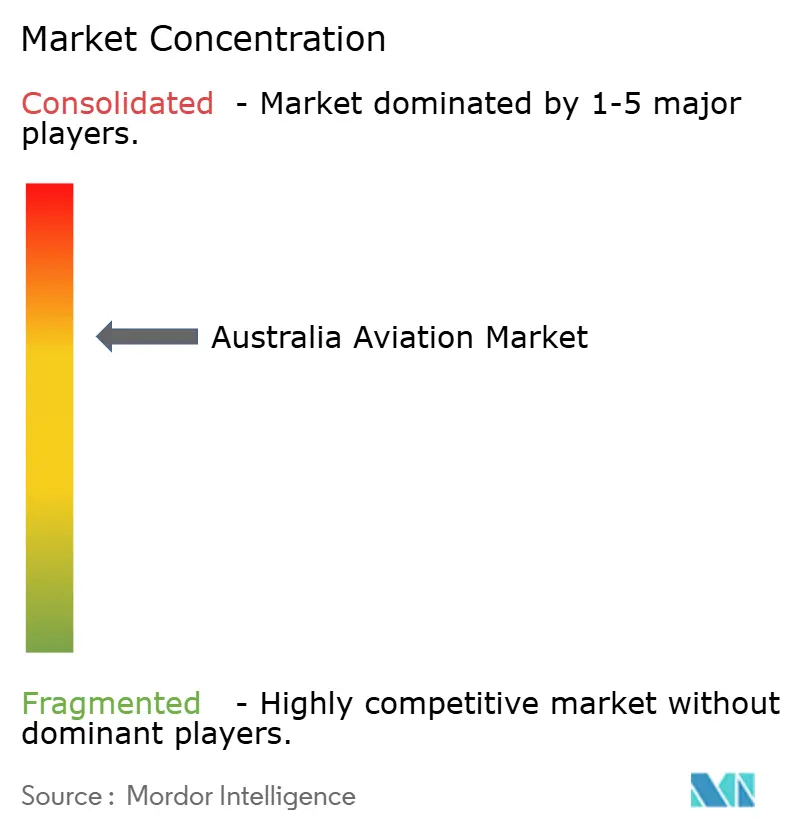
| Market Concentration | Medium |
Major Players *Disclaimer: Major Players sorted in no particular order Image © Mordor Intelligence. Reuse requires attribution under CC BY 4.0. | |
Australia Aviation Market Analysis by Mordor Intelligence
Australia aviation market size in 2026 is estimated at USD 4.2 billion, growing from 2025 value of USD 4.14 billion with 2031 projections showing USD 4.51 billion, growing at 1.45% CAGR over 2026-2031. A faster rebound in leisure travel, targeted defense outlays, and ongoing fleet renewal programs anchor near-term momentum, even as airport congestion, talent shortages, and cost-inflation pressures restrain a more robust upswing. The Australian aviation market is now focusing on sustainability targets, with operators testing sustainable aviation fuel (SAF) blends, exploring electric-hybrid propulsion, and expanding simulation-based training to reduce emissions. Defense procurements such as the F-35A Lightning II elevate long-term demand for high-value platforms, creating spillovers for maintenance, repair, and overhaul (MRO) suppliers.
Key Report Takeaways
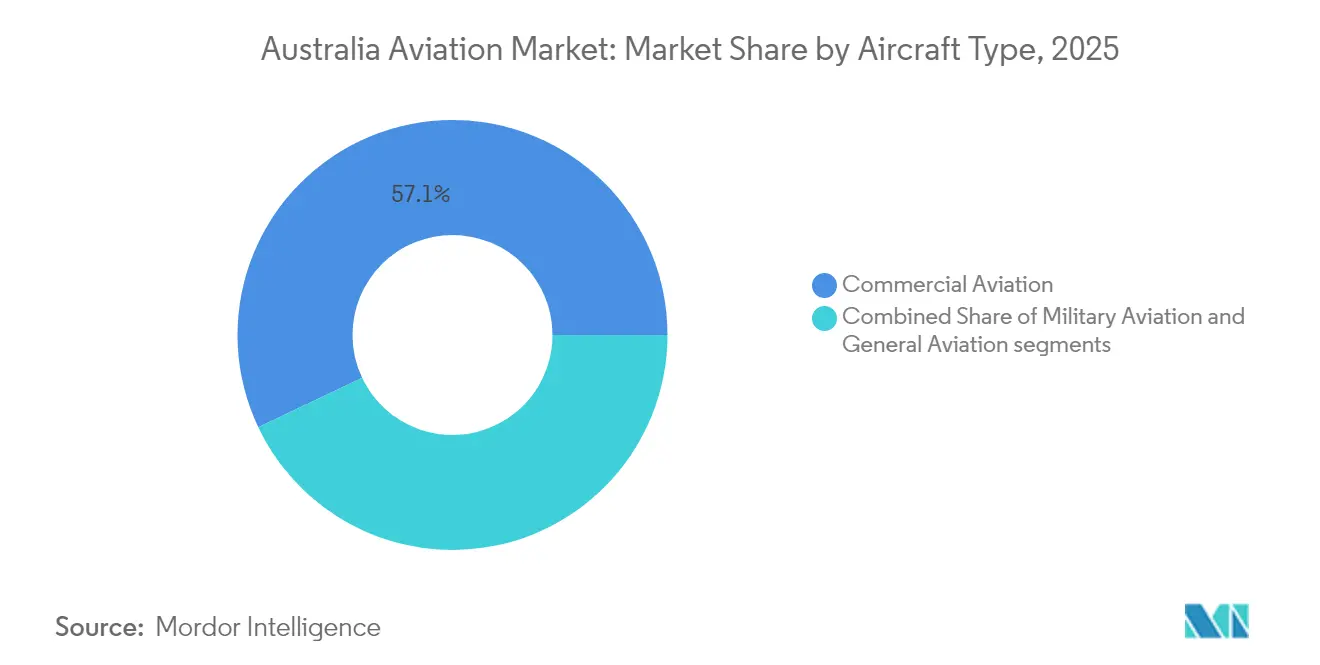
- By aircraft type, commercial aviation held 57.05% of the Australia aviation market share in 2025, while military aviation is projected to rise at a 3.62% CAGR through 2031.
- By propulsion technology, turbofan engines accounted for 65.02% of the Australian aviation market size in 2025; however, turboshaft engines are expected to grow at the fastest rate, with a 2.65% CAGR during the forecast period.
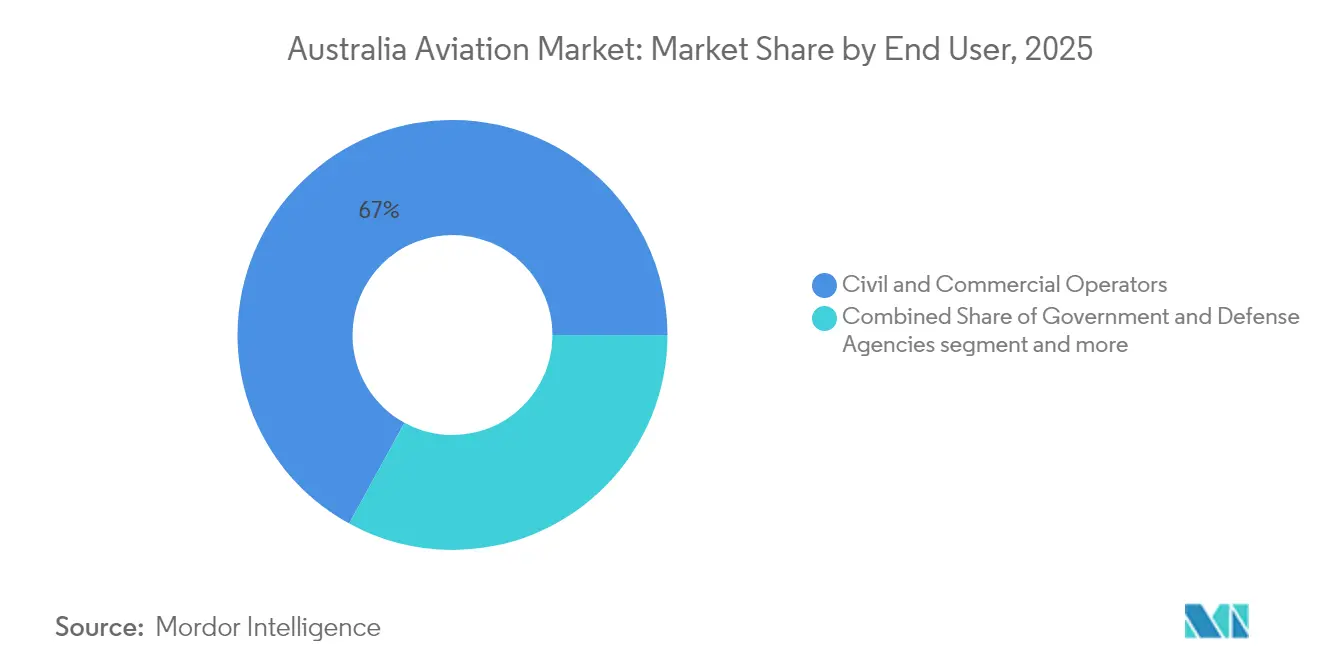
- By end user, civil and commercial operators captured a 67.02% share of the Australian aviation market size in 2025; government and defense agencies led growth at a 2.43% CAGR to 2031.
Note: Market size and forecast figures in this report are generated using Mordor Intelligence’s proprietary estimation framework, updated with the latest available data and insights as of 2026.
Australia Aviation Market Trends and Insights
Drivers Impact Analysis*
| Driver | (~) % Impact on CAGR Forecast | Geographic Relevance | Impact Timeline |
|---|---|---|---|
| Recovery in domestic and international air travel demand | +0.4% | Sydney, Melbourne and Brisbane corridors | Short term (≤ 2 years) |
| Fleet modernization efforts and adoption of sustainable aircraft technologies | +0.3% | National airline hubs | Medium term (2-4 years) |
| Increased defense spending and strengthening of Indo-Pacific security alliances | +0.5% | Northern Australia bases | Long term (≥ 4 years) |
| Expansion of aviation training infrastructure and simulation capabilities | +0.2% | Perth, Adelaide and Brisbane training centers | Medium term (2-4 years) |
| Improved regional air connectivity to underserved and remote locations | +0.2% | Western Australia mining corridors | Medium term (2-4 years) |
| Rising demand for helicopters in disaster response and emergency medical services | +0.1% | Bushfire-prone regions | Short term (≤ 2 years) |
| Source: Mordor Intelligence | |||


Recovery in Domestic and International Air Travel Demand
Domestic traffic surpassed pre-pandemic benchmarks, reaching 3.7 million aircraft movements in FY2024, demonstrating the sector’s resilience. Demand skews more toward leisure as corporate travel remains 15-20% below 2019 levels, due to the use of hybrid-meeting tools that reduce the need for in-person trips. International seat capacity is returning gradually; bilateral caps and airline fleet allocation strategies favor high-yield routes, which delays the complete restoration of the network. Still, Asia-Pacific passenger volumes are expected to rise 7.9% in 2025, bolstering inbound flows from China and India.[1] International Air Transport Association, “Asia-Pacific Demand Outlook 2025,” iata.org These trends underpin sustained load factors for large domestic carriers and open gaps for regional airlines to serve underserved city pairs. As traffic increases, the Australian aviation market benefits from higher ancillary revenue streams and increased airport retail spending among leisure travelers.
Fleet Modernization Efforts and Adoption of Sustainable Aircraft Technologies
Operators are fast-tracking replacement cycles, prioritizing fuel-efficient types to temper volatile fuel costs and meet emerging sustainability requirements. Qantas has moved to consolidate its turboprop fleet, comprising approximately 14 Dash 8-400 aircraft, replacing 19 smaller units to increase seat kilometers while reducing per-passenger emissions. SAF use remains limited due to the lack of local production, but binding corporate climate targets and the prospect of carbon pricing encourage early adoption. Electric and hybrid concepts are gaining traction for sub-300-nautical-mile routes, with trial retrofits planned on short-haul turboprops. Artificial-intelligence-assisted design workflows, as demonstrated by Swinburne University, can reduce development timelines from years to months, accelerating the entry of next-generation green aircraft.[2]Swinburne University, “AI-Assisted Aircraft Design,” swinburne.edu.au These modernization moves enhance reliability, reduce maintenance hours, and align fleets with stricter noise and emissions caps at major airports.
Increased Defense Spending and Strengthening of Indo-Pacific Security Alliances
The 2024 National Defence Strategy earmarks USD 330 billion for air capabilities over the decade, signaling a significant increase in military aviation outlays. Program expansions for F-35A fighters and P-8A maritime patrol aircraft underscore Canberra’s north-facing posture and demand for interoperable systems with key allies. A USD 200 million deep-maintenance facility at RAAF Base Edinburgh is scheduled to open in 2026, supporting sovereign sustainment pipelines. Defense modernization spills into the civil arena by increasing MRO workloads and strengthening advanced manufacturing clusters around Adelaide and Brisbane. The long-range ISR focus also increases demand for secure satellite uplinks and resilient cyber architectures, which subsequently benefit commercial airlines seeking robust flight operations networks.
Expansion of Aviation Training Infrastructure and Simulation Capabilities
Australia’s regulator has introduced competency-based licensing pathways, enabling schools to tailor their curricula to specific fleet or mission needs. Flight simulation training devices are proliferating as operators shift hours from physical aircraft to save fuel and reduce emissions. Virtual-reality modules now complement fixed-base simulators, improving skill retention and enabling remote learning for cadets in regional areas. Multi-crew pilot licenses are gaining favor with airlines that want to align cockpit preparation directly with their jet fleets, rather than traditional single-pilot progression pipelines. These upgrades alleviate bottlenecks in a market where instructor availability and aircraft time remain constrained, enabling the Australian aviation market to create a larger, better-qualified talent pool over the medium term.
Restraints Impact Analysis*
| Restraint | (~) % Impact on CAGR Forecast | Geographic Relevance | Impact Timeline |
|---|---|---|---|
| Fluctuating fuel prices and rising carbon compliance costs | -0.3% | Higher impact on regional routes | Short term (≤ 2 years) |
| Airport infrastructure limitations and air traffic management congestion | -0.4% | Sydney, Melbourne and Brisbane | Medium term (2-4 years) |
| Shortage of skilled aviation professionals, including MRO technicians and pilots | -0.5% | National, acute in remote areas | Long term (≥ 4 years) |
| Growing cybersecurity risks targeting aviation systems and infrastructure | -0.2% | Major airports and air-traffic control centers | Medium term (2-4 years) |
| Source: Mordor Intelligence | |||
Airport Infrastructure Limitations and Air Traffic Management Congestion
Slot caps at Sydney and runway capacity limits in Melbourne compel airlines to tailor schedules to infrastructure, curbing frequency growth despite robust demand. Controller shortages exacerbate airborne holding and pushback delays, adding fuel burn and eroding on-time performance. Western Sydney International Airport will offer relief; however, practical benefits depend on an integrated airspace redesign and advanced flow-management tools.[3]Air Cargo News, “Western Sydney Airport Capacity,” aircargonews.net Regional airports face runway and apron constraints restricting larger aircraft operations, imposing higher per-seat costs on thin routes. Incumbents with historic slots enjoy a protective moat, making market entry more challenging for new airlines and thereby constraining competition in the Australia aviation market.
Shortage of Skilled Aviation Professionals, Including MRO Technicians and Pilots
Remote-pilot license holders rose to 33,388, surpassing 30,843 conventional pilots by February 2024. Despite this shift, demand for traditional cockpit crews and licensed aircraft maintenance engineers outstrips supply as aging workers retire. Regional bases struggle to attract talent, even with wage premiums, forcing operators to recruit staff from capital cities, which adds cost and reduces aircraft utilization. Training schools are expanding their simulator fleets and forging airline partnerships, yet the time lag in developing fully qualified personnel keeps the pipeline tight. Sustained labor shortages raise salary costs, reduce scheduling flexibility, and limit capacity growth across the Australian aviation market.
*Our forecasts treat driver/restraint impacts as directional, not additive. The impact forecasts reflect baseline growth, mix effects, and variable interactions.
Segment Analysis
By Aircraft Type: Military Modernization Outpaces Civil Growth
Military aviation is on course for a 3.62% CAGR through 2031, reflecting Canberra’s broadened Indo-Pacific commitments and procurement of multi-role platforms. Fixed-wing assets such as the F-35A lead value expansion, while rotary investments focus on search-and-rescue and naval support. Commercial aviation remains the revenue anchor with 57.05% of the 2025 Australia aviation market share, yet its growth moderates as carriers favor load-factor optimization over capacity additions. General aviation is experiencing steady orders for business jets and special-mission aircraft, with advanced air-mobility prototypes nudging the segment toward electric vertical takeoff and landing (eVTOL) platforms.
Military programs command higher unit values and multiyear sustainment contracts in monetary terms, lifting defense suppliers’ margins. Commercial operators focus on fleet refinancing and product unification to reduce the cost per available seat kilometer. Regulatory frameworks for eVTOL certification, outlined in the RPAS and AAM strategic roadmap, could unlock short-range urban services by 2029. This evolution expands the Australia aviation market by adding a new passenger category and creating feeder traffic for conventional airlines.


By Propulsion Technology: Turboshaft Engines Power Rotorcraft Expansion
Turboshaft engines are on track to log a 2.65% CAGR through 2031, the fastest rate among all propulsion classes, even though turbofan systems still held 65.02% of 2025 revenue within the Australia aviation market. The lift in turboshaft demand stems from a sharp rise in helicopter deployments for multi-mission military tasks, emergency medical services, bushfire suppression, and offshore logistics. Canberra’s procurement of transport and combat rotorcraft under its defense-modernization agenda anchors the outlook, while state governments continue to contract airborne assets for disaster response and search-and-rescue coverage.
Technology upgrades that improve power-to-weight ratios and cut fuel burn make next-generation turboshafts ideal for harsh operating arenas ranging from tropical cyclone zones to remote mining camps. Hybrid-electric architectures are being tested on light and medium-sized helicopters, pairing turboshaft cores with electric boost motors to reduce emissions during takeoff and hover. Turboprop engines maintain a steady niche on regional fixed-wing routes, while piston engines remain common in training fleets; yet, both face gradual share erosion as operators shift toward more efficient alternatives. Sustainable aviation fuel blending offers an interim decarbonization lever for every propulsion class, and CASA’s progressive certification framework supports the safe roll-out of advanced systems across the Australia aviation market
By End User: Government and Defense Agencies Expand Capabilities
Civil and commercial operators continued to command 67.02% of market revenue in 2025, while government and defense agencies exhibited the highest 2.43% CAGR as they scaled intelligence, surveillance, and humanitarian missions. Defense modernization fuels procurement of airframes, avionics upgrades, and cyber-secure communications. Commercial carriers focus on cost optimization, negotiating long-term SAF supply agreements, and digitizing maintenance to minimize unplanned downtime. Business aviation owners, primarily in the mining and professional services sectors, invest in super-mid and large-cabin jets to connect distant sites, albeit representing a smaller slice of the Australian aviation market size.
Convergence between civil and military needs is rising in areas such as threat-detection algorithms, satellite communications, and autonomous navigation. State-backed helicopter contracts for disaster response create stable cash flows for rotary-craft operators, supporting further fleet expansion. A broader push for sovereign industrial capability, enshrined in defense policy, encourages local manufacturing partnerships, thereby amplifying domestic value capture within the Australia aviation market.
Geography Analysis
The eastern seaboard triangle linking Sydney, Melbourne, and Brisbane produces the densest passenger flows and the highest yield segments. Slot scarcity in this corridor incentivizes the use of larger-gauge aircraft and continuous-descent profiles to maximize runway throughput. Western Australia’s resource sector underpins a robust fly-in-fly-oecosystemr ecosystemboost that utilizes high-cycle turboprops and an increasing number of narrowbody jets equipped for gravel strips. Northern Australia’s expanding defense infrastructure enhances military air movements and supports regional airport upgrades, thereby increasing local employment and service demand.
Regional connectivity programs target underserved locations, but economic conditions remain tight due to sparse populations. Subsidized public-service obligations help sustain thin routes, though operators still wrestle with maintenance logistics across vast distances. Western Sydney International Airport will add capacity to redistribute traffic southwest of the existing Kingsford Smith field and open new point-to-point routes, potentially reshaping competitive balances along the coast. This acceleration of investment in surveillance radars and cloud-based air-traffic services will embed advanced ecosystemm technology across the Australian aviation market.
Internationally, the country’s position as a gateway between Asia and the South Pacific gains prominence amid rising tourist arrivals from China and India, once bilateral seat allocations are loosened. Long-range twin-aisle jets dominate these lanes, prompting carriers to pursue higher-density layouts and premium economy cabins to boost yield. Codeshare partnerships with regional Asian airlines expand interline options, reinforcing Australia’s integrative role in the ecosystemdo-Pacific travel eco-system.
Competitive Landscape
The Australian aviation market exhibits moderate concentration, with national flag carriers, a handful of low-cost rivals, and two global airframe suppliers dominating large-volume segments. However, technological shifts and regulatory openness are lowering entry barriers in emerging niches. The Boeing Company and Airbus SE retain a duopoly in jetliners, but electric-aircraft startups are carving space in the light-aircraft and urban-mobility segments. Defense primes compete on integrated-system capability and sovereign sustainment promises, aligning their bids with government policy that favors domestic industry participation.
Competitive strategies center on fleet standardization, SAF procurement agreements, and digital operations platforms that reduce dispatch delays and optimize fuel consumption. Airlines deepen loyalty-program tie-ins and dynamic pricing of ancillaries to widen their margins. Helicopter and charter operators differentiate themselves through rapid response, night firefighting capabilitiesAustralian, and tailored MRO solutions for harsh environments. Technology adoption includes predictive maintenance AI, satellite-based ADS-B surveillance, and automated air-space authorization engines that reduce regulatory lead times.
Market entrants face hurdles in securing pilots, engineers, and airport slots. However, partnerships with training academies and regional airports offer alternative paths to scale. Overall, companies that combine operational reliability with sustainability credentials and agile workforce models are best positioned to secure a share in the evolving Australian aviation market.
Australia Aviation Industry Leaders
Airbus SE
Lockheed Martin Corporation
The Boeing Company
Textron Inc.
Bombardier Inc.
- *Disclaimer: Major Players sorted in no particular order

Recent Industry Developments
- October 2025: Australia received its first two Boeing AH-64E Apache helicopters, marking the introduction of advanced attack helicopter capabilities. The deployment is supported by Australia's domestic workforce and supply chain infrastructure.
- March 2025: Boeing Defence Australia (BDA) received a USD 569 million contract to upgrade and maintain the Royal Australian Air Force's (RAAF) E-7A Wedgetail surveillance aircraft. The contract includes improvements to both aircraft and ground systems over the next decade.
- January 2023: The Australian government confirmed its decision to acquire 40 Sikorsky UH-60M Black Hawk helicopters for the Australian Army.


Australia Aviation Market Report Scope
Commercial Aviation, General Aviation, Military Aviation are covered as segments by Aircraft Type.By Aircraft Type
| Commercial Aviation | Passenger Aircraft | Narrowbody Aircraft |
| Widebody Aircraft | ||
| Freighter | ||
| General Aviation | Business Jets | Large Jet |
| Mid-Size Jet | ||
| Light Jet | ||
| Helicopters | ||
| Others | ||
| Military Aviation | Fixed-Wing Aircraft | Multi-Role Aircraft |
| Training Aircraft | ||
| Transport Aircraft | ||
| Others | ||
| Rotorcraft | Multi-Mission Helicopter | |
| Transport Helicopter | ||
| Training | ||
By Propulsion Technology
| Turboprop |
| Turbofan |
| Piston Engine |
| Turboshaft |
| Others |
By End User
| Business and General Aviation Operators |
| Civil and Commercial Operators |
| Government and Defense Agencies |
| By Aircraft Type | Commercial Aviation | Passenger Aircraft | Narrowbody Aircraft |
| Widebody Aircraft | |||
| Freighter | |||
| General Aviation | Business Jets | Large Jet | |
| Mid-Size Jet | |||
| Light Jet | |||
| Helicopters | |||
| Others | |||
| Military Aviation | Fixed-Wing Aircraft | Multi-Role Aircraft | |
| Training Aircraft | |||
| Transport Aircraft | |||
| Others | |||
| Rotorcraft | Multi-Mission Helicopter | ||
| Transport Helicopter | |||
| Training | |||
| By Propulsion Technology | Turboprop | ||
| Turbofan | |||
| Piston Engine | |||
| Turboshaft | |||
| Others | |||
| By End User | Business and General Aviation Operators | ||
| Civil and Commercial Operators | |||
| Government and Defense Agencies | |||


Market Definition
- Aircraft Type - All the aircraft related to commercial, military and general aviation have been included in this study
- Sub-Aircraft Type - Fixed-Wing passenger aircraft, freighter aircraft, business jets, piston fixed-wing aircraft, military fixed-wing aircraft, and rotorcraft are included under this study.
- Body Type - Body type includes all types of aircraft segmented based on application/size/capacity/role.
| Keyword | Definition |
|---|---|
| IATA | IATA stands for the International Air Transport Association, a trade organization composed of airlines around the world that has an influence over the commercial aspects of flight. |
| ICAO | ICAO stands for International Civil Aviation Organization, a specialized agency of the United Nations that supports aviation and navigation around the globe. |
| Air Operator Certificate (AOC) | A certificate granted by a National Aviation Authority permitting the conduct of commercial flying activities. |
| Certificate Of Airworthiness (CoA) | A Certificate Of Airworthiness (CoA) is issued for an aircraft by the civil aviation authority in the state in which the aircraft is registered. |
| Gross Domestic Product (GDP) | Gross domestic product (GDP) is a monetary measure of the market value of all the final goods and services produced in a specific time period by countries. |
| RPK (Revenue Passenger Kilometres) | The RPK of an airline is the sum of the products obtained by multiplying the number of revenue passengers carried on each flight stage by the stage distance - it is the total number of kilometers traveled by all revenue passengers. |
| Load Factor | The load factor is a metric used in the airline industry that measures the percentage of available seating capacity that has been filled with passengers. |
| Original Equipment Manufacturer (OEM) | An original equipment manufacturer (OEM) traditionally is defined as a company whose goods are used as components in the products of another company, which then sells the finished item to users. |
| International Transportation Safety Association (ITSA) | International Transportation Safety Association (ITSA) is an international network of heads of independent safety investigation authorities (SIA). |
| Available Seats Kilometre (ASK) | This metric is calculated by multiplying Available Seats (AS) in one flight, defined above, multiplied by the distance flown. |
| Gross Weight | The fully-loaded weight of an aircraft, also known as “takeoff weight,” which includes the combined weight of passengers, cargo, and fuel. |
| Airworthiness | The ability of an aircraft, or other airborne equipment or system, to operate in flight and on the ground without significant hazard to aircrew, ground crew, passengers or to other third parties. |
| Airworthiness Standards | Detailed and comprehensive design and safety criteria applicable to the category of aeronautical product (aircraft, engine or propeller). |
| Fixed Base Operator (FBO) | A business or organization that operates at an airport. An FBO provides aircraft operating services like maintenance, fueling, flight training, charter services, hangaring, and parking. |
| High Net worth Individuals (HNWIs) | High Net worth Individuals (HNWIs) are individuals with over USD 1 million in liquid financial assets. |
| Ultra High Net worth Individuals (UHNWIs) | Ultra High Net worth Individuals (UHNWIs) are individuals with over USD 30 million in liquid financial assets. |
| Federal Aviation Administration (FAA) | The division of the Department of Transportation is concerned with aviation. It operates Air Traffic Control and regulates everything from aircraft manufacturing to pilot training to airport operations in the United States. |
| EASA (European Aviation Safety Agency) | The European Aviation Safety Agency is a European Union agency established in 2002 with the task of overseeing civil aviation safety and regulation. |
| Airborne Warning and Control System (AW&C) aircraft | Airborne Warning and Control System (AEW&C) aircraft is equipped with a powerful radar and on-board command and control center to direct the armed forces. |
| The North Atlantic Treaty Organization (NATO) | The North Atlantic Treaty Organization (NATO), also called the North Atlantic Alliance, is an intergovernmental military alliance between 30 member states – 28 European and two North American. |
| Joint Strike Fighter (JSF) | Joint Strike Fighter (JSF) is a development and acquisition program intended to replace a wide range of existing fighter, strike, and ground attack aircraft for the United States, the United Kingdom, Italy, Canada, Australia, the Netherlands, Denmark, Norway, and formerly Turkey. |
| Light Combat Aircraft (LCA) | A light combat aircraft (LCA) is a light, multirole jet/turboprop military aircraft, commonly derived from advanced trainer designs, designed for engaging in light combat. |
| Stockholm International Peace Research Institute (SIPRI) | Stockholm International Peace Research Institute (SIPRI) is an international institute that provides data, analysis, and recommendations for armed conflict, military expenditure, and arms trade as well as disarmament and arms control. |
| Maritime Patrol Aircraft (MPA) | A maritime patrol aircraft (MPA), also known as maritime reconnaissance aircraft is a fixed-wing aircraft designed to operate for long durations over water in maritime patrol roles, in particular, anti-submarine warfare (ASW), anti-ship warfare (AShW), and search and rescue (SAR). |
| Mach Number | The Mach number is defined as the ratio of true airspeed to the speed of sound at the altitude of a given aircraft. |
| Stealth Aircraft | Stealth is a Common term applied to low observable (LO) technology and doctrine, that makes an aircraft near invisible to radar, infrared or visual detection. |


Research Methodology
Mordor Intelligence follows a four-step methodology in all our reports.
- Step-1: Identify Key Variables: In order to build a robust forecasting methodology, the variables and factors identified in Step-1 are tested against available historical market numbers. Through an iterative process, the variables required for market forecast are set and the model is built on the basis of these variables.
- Step-2: Build a Market Model: Market-size estimations for the historical and forecast years have been provided in revenue and volume terms. For sales conversion to volume, the average selling price (ASP) is kept constant throughout the forecast period for each country, and inflation is not a part of the pricing.
- Step-3: Validate and Finalize: In this important step, all market numbers, variables and analyst calls are validated through an extensive network of primary research experts from the market studied. The respondents are selected across levels and functions to generate a holistic picture of the market studied.
- Step-4: Research Outputs: Syndicated Reports, Custom Consulting Assignments, Databases & Subscription Platforms


