Market Overview
| Study Period | 2020 - 2031 |
|---|---|
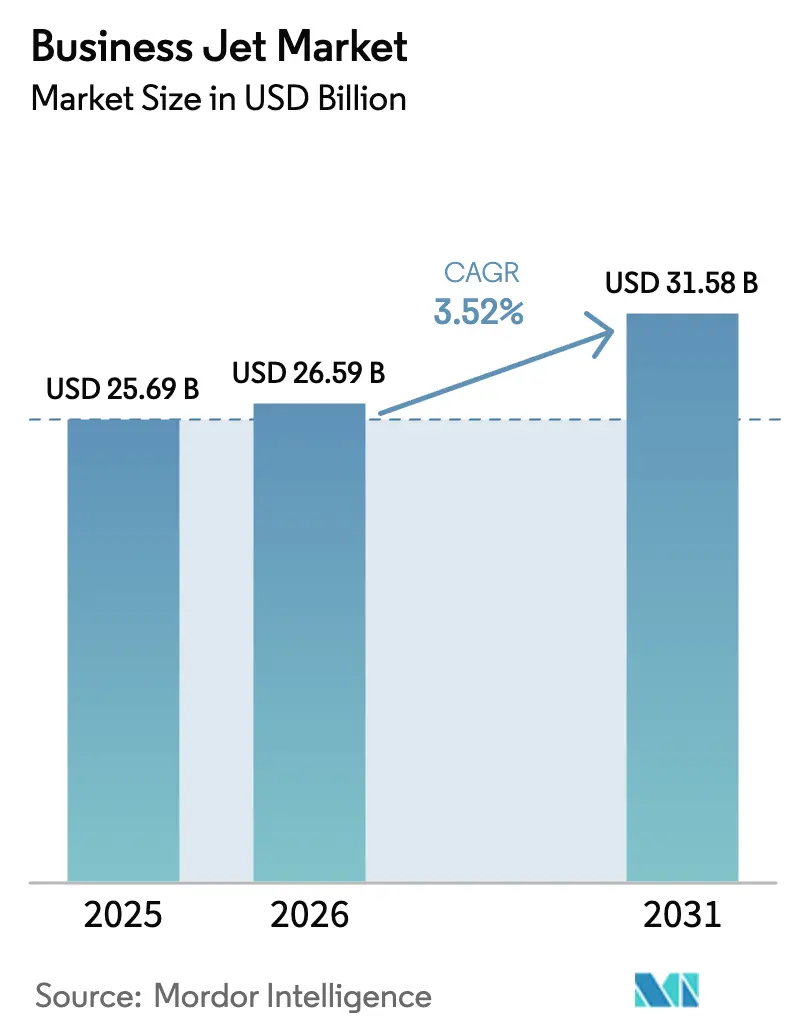
| Market Size (2026) | USD 26.59 Billion |
| Market Size (2031) | USD 31.58 Billion |
| Growth Rate (2026 - 2031) | 3.52% CAGR |
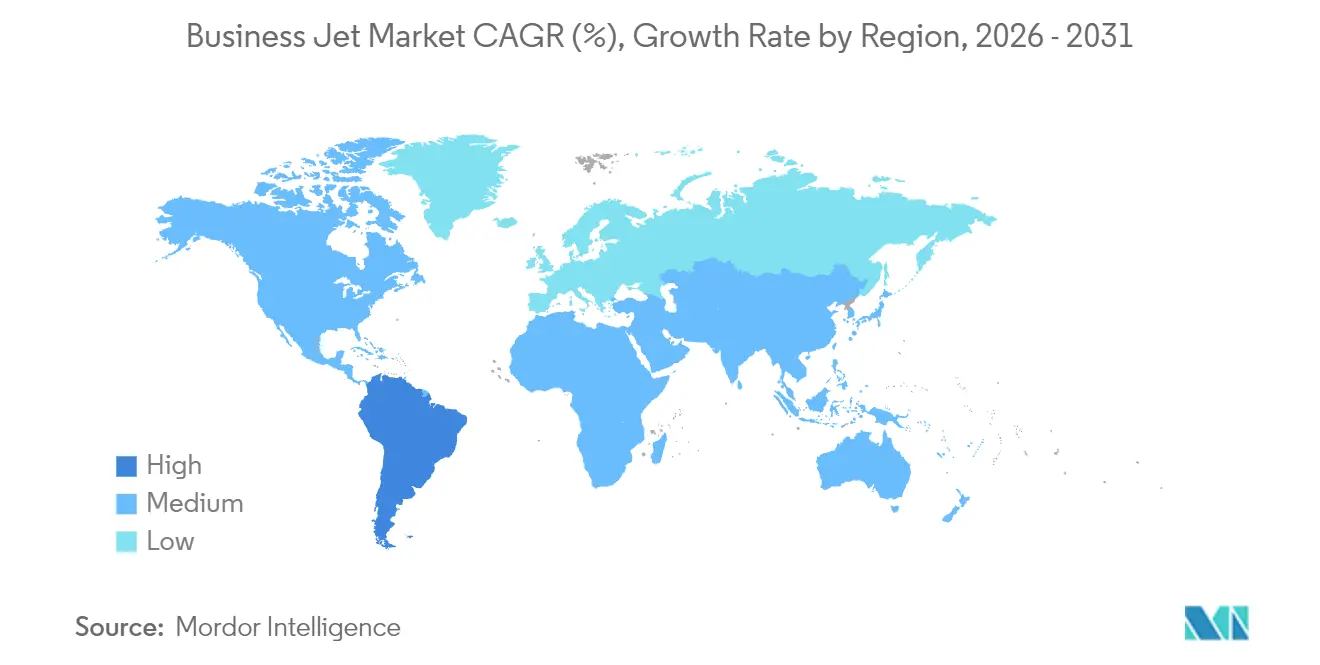
| Fastest Growing Market | South America |
| Largest Market | North America |
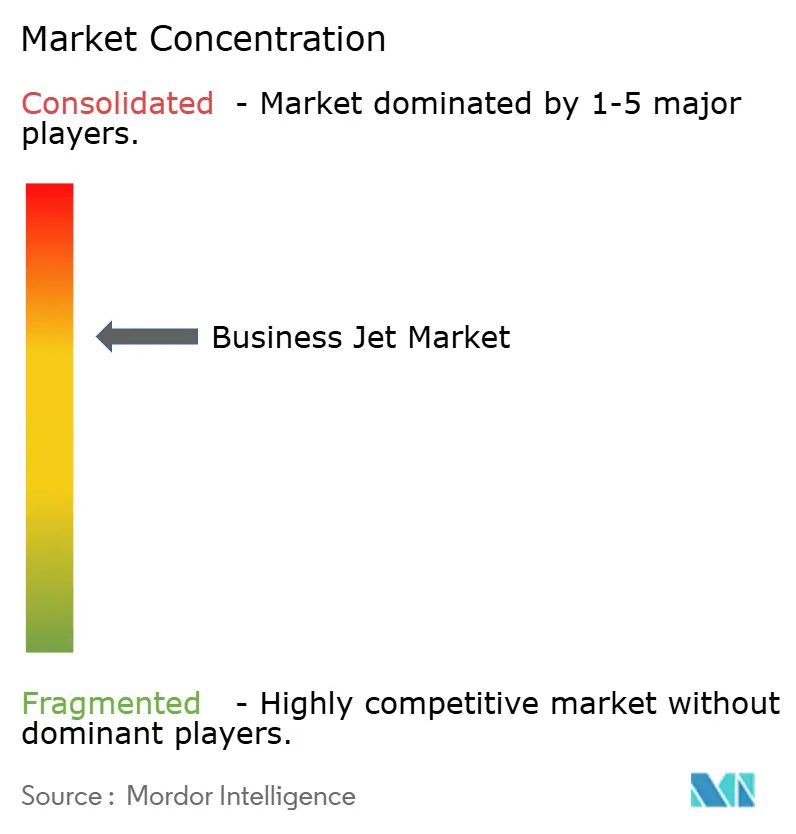
| Market Concentration | Medium |
Major Players *Disclaimer: Major Players sorted in no particular order Image © Mordor Intelligence. Reuse requires attribution under CC BY 4.0. | |
Business Jet Market Analysis by Mordor Intelligence
The business jet market size in 2026 is estimated at USD 26.59 billion, growing from 2025 value of USD 25.69 billion with 2031 projections showing USD 31.58 billion, growing at 3.52% CAGR over 2026-2031. The primary growth levers are replacing demand, fractional-ownership uptake, and pursuing ultra-long-range city pairs. At the same time, high acquisition costs and tightening carbon rules keep overall expansion moderate. Large-cabin jets dominate demand, crypto-generated wealth is expanding the customer pool, and hydrogen-electric R&D is beginning to reshape buyer expectations. Geography remains skewed toward North America, yet South America’s agribusiness-linked wealth is accelerating regional growth. Supply-chain bottlenecks lengthen lead times, giving OEMs pricing power even as would-be buyers pivot to charter, membership, and fractional solutions.
Key Report Takeaways
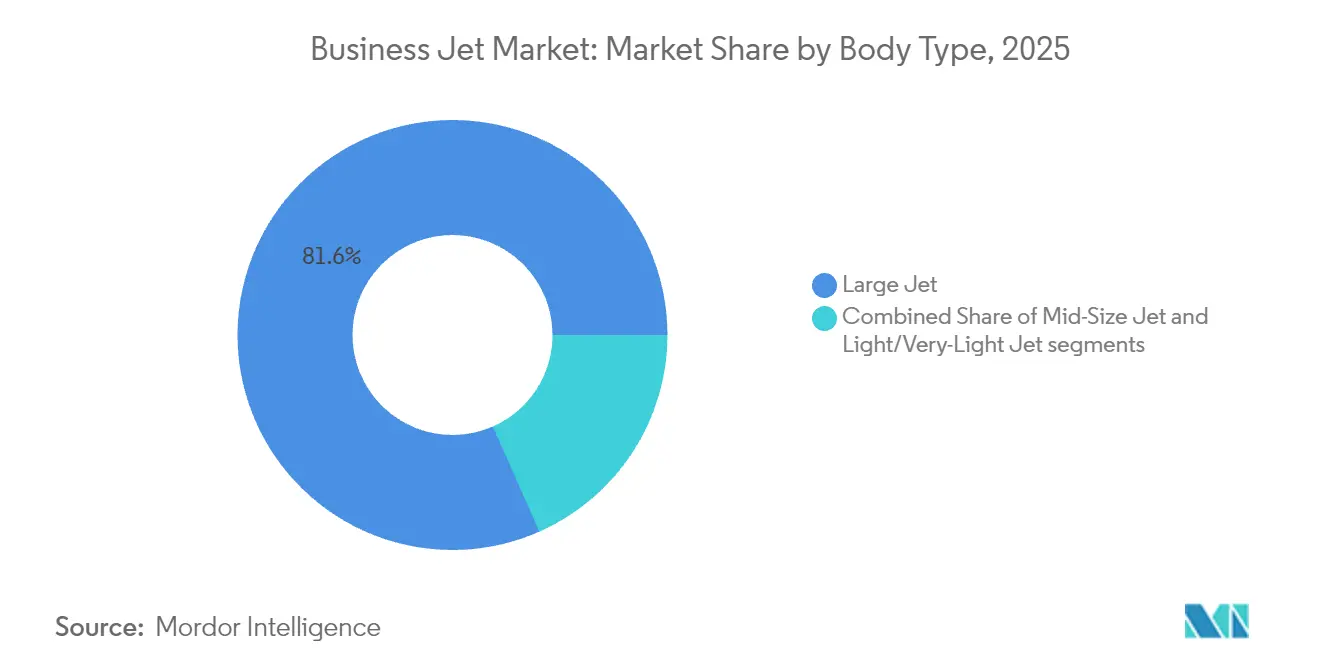
- By body type, large jets held 81.62% of the business jet market share in 2025, and it is projected to advance at a 3.74% CAGR through 2031.
- By end user, individual ownership accounted for 53.88% of the business jet market size in 2025; charter and air-taxi operators are expected to expand at a 7.55% CAGR through 2031.
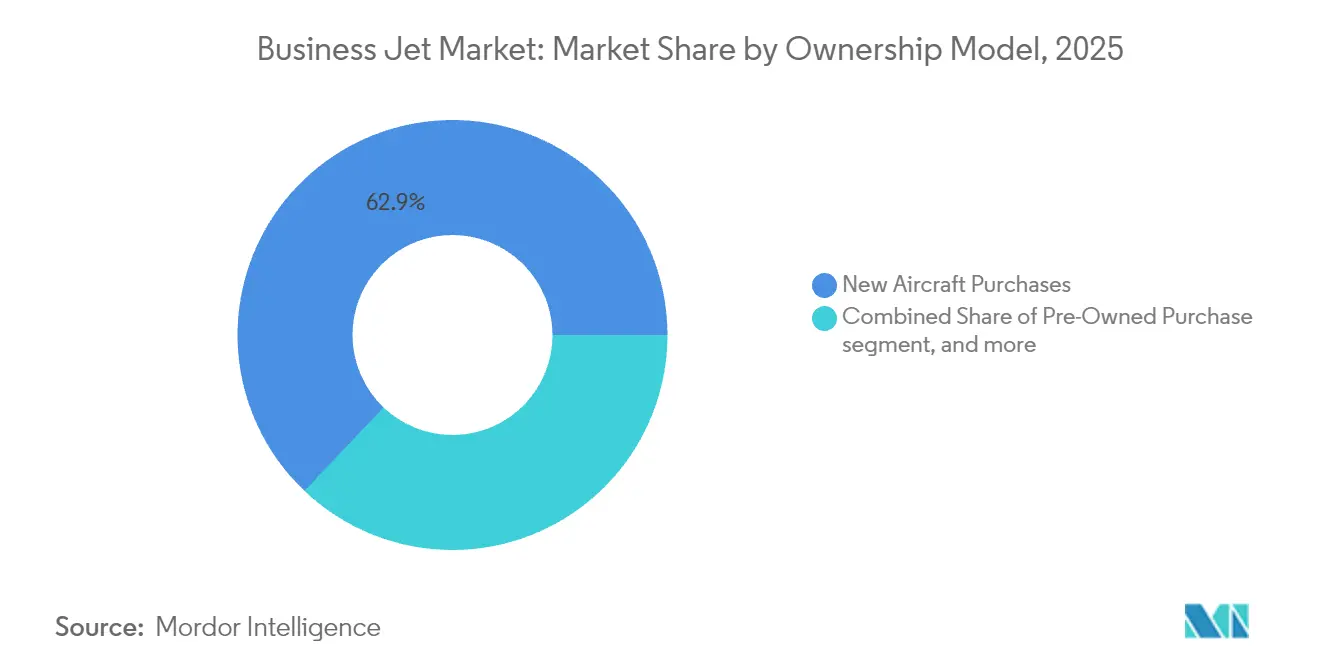
- By ownership model, new-aircraft purchases captured 62.90% share of the business jet market size in 2025, while jet cards and membership programs are forecasted to grow at an 7.92% CAGR through 2031.
- By geography, North America led with a 66.25% share in 2025, while South America is projected to achieve a 8.72% CAGR through 2031.
Note: Market size and forecast figures in this report are generated using Mordor Intelligence’s proprietary estimation framework, updated with the latest available data and insights as of 2026.
Global Business Jet Market Trends and Insights
Drivers Impact Analysis*
| Driver | (%) Impact on CAGR Forecast | Geographic Relevance | Impact Timeline |
|---|---|---|---|
| Fleet-replacement cycle acceleration | +1.2% | Global, concentrated in North America and Europe | Medium term (2-4 years) |
| Expansion of ultra-long-range city pairs | +0.8% | Global, strongest on Asia-Pacific and Middle East routes | Long term (≥ 4 years) |
| Fractional-ownership program uptake | +0.7% | North America and Europe core, expanding to APAC | Medium term (2-4 years) |
| Hydrogen-electric R&D drawing eco-focused HNWIs | +0.6% | Europe and North America early adoption, global spillover | Long term (≥ 4 years) |
| Crypto-wealth demand for discreet mobility | +0.5% | Global, clustered in tech hubs and financial centers | Short term (≤ 2 years) |
| eVTOL business jet inter-lining partnerships | +0.4% | North America and Europe initial deployment | Medium term (2-4 years) |
| Source: Mordor Intelligence | |||


Fleet-Replacement Cycle Acceleration
The average age of US business jets reached 18.5 years in 2024, prompting operators to replace older aircraft sooner as fuel costs and maintenance bills rise steeply.[1]Aviation Week Network, “Business Aviation MRO Costs and Inflation Trends,” aviationweek.com New models deliver up to 30% fuel savings and 40% longer maintenance intervals, making the total cost of ownership attractive despite headline prices. Insurance carriers now impose higher premiums on legacy airframes, further tipping economics toward replacement. Honeywell projects a USD 280 billion replacement opportunity this decade, with large-cabin jets capturing the lion’s share.[2]Honeywell Aerospace, “Honeywell Forecasts 8,500 New Business Jets Over Next Decade Worth $280 Billion,” honeywell.com Higher-tech cockpits also align with pilot-training mandates, reinforcing the wave of replacements.
Expansion of Ultra-Long-Range City Pairs
Gulfstream’s G700 set more than 65 city-pair records in 2024, underscoring demand for aircraft that fly 7,750 nautical miles nonstop.[3]Gulfstream Aerospace Corporation, “Gulfstream G700 Aircraft Overview,” gulfstream.com Bombardier’s Global 8000 enters service in 2025 with an 8,000-mile envelope, allowing flights to New York-Dubai and London-Singapore without refueling. Asia-Pacific owners value the time-zone efficiency of nonstop links across sparse hub infrastructure. Operators report 30-40% higher utilization on such aircraft, which translates to stronger revenue yields. Pursuing these ultra-long-range missions shifts R&D dollars toward larger fuel tanks and lighter composite structures.
Fractional-Ownership Program Uptake
Fractional departures climbed 56% above 2019 levels, reaching 578,835 flights in 2024, the highest on record. The model appeals to younger ultra-high-net-worth individuals (UHNWIs) who seek flexible, asset-light access to aviation. OEM delivery slots of 24-36 months push prospects toward fractional solutions that offer immediate lift. European regulators are now easing shared-ownership constraints, paving the way for adoption in the APAC region. Rising aircraft values mean fractional shares retain residual value more effectively, supporting program economics.
Hydrogen-Electric R&D Drawing Eco-Focused HNWIs
Sirius Aviation and BMW unveiled hydrogen-electric concepts in 2024, boasting a 1,150-mile range, targeting buyers who insist on net-zero flight profiles.[4]Sirius Aviation, “Hydrogen-Electric Business Jet Development,” siriusaviation.com Beyond Aero’s BYA-1 claims 800-930-mile capability, the EU’s HYDEA project allocated EUR 116 million (USD 134.15 million) to hydrogen prototypes. Early adopters are willing to pay a premium for green solutions, broadening the business jet market beyond conventional propulsion. Rolls-Royce and GE testbeds accelerate technology readiness for the late-decade timeframe. The R&D push enhances OEM brand equity and aligns with corporate ESG imperatives.
Restraints Impact Analysis*
| Restraint | (%) Impact on CAGR Forecast | Geographic Relevance | Impact Timeline |
|---|---|---|---|
| High acquisition and operating costs | -0.9% | Global, most acute in emerging markets | Short term (≤ 2 years) |
| ICAO CORSIA and carbon-tax exposure | -0.6% | Global international operations | Medium term (2-4 years) |
| Corporate ESG-driven flight reduction pledges | -0.4% | North America and Europe corporate markets | Medium term (2-4 years) |
| Sustainable aviation fuel (SAF) supply bottlenecks | -0.3% | Global, limited production infrastructure | Long term (≥ 4 years) |
| Source: Mordor Intelligence | |||
High Acquisition and Operating Costs
New-aircraft sticker prices rise 8-12% annually, while Jet-A hit USD 6.07 per gallon in 2024. Parts inflation and technician shortages compound cost pressures; maintenance labor now averages USD 138-161 per hour. Insurance premiums remain elevated, especially for war-risk coverage on international legs. These outlays encourage entry-level prospects to opt for charter and membership programs rather than outright ownership. Buyers in emerging markets feel the squeeze most acutely due to weaker currencies and limited financing options.
ICAO CORSIA and Carbon-Tax Exposure
CORSIA caps emissions at 85% of 2019 levels through 2035, requiring operators to either buy offsets or restrict their flying. European carbon taxes now include business jets, with levies added on top of CORSIA costs. Compliance requires specialized monitoring software and legal consultation, which increases overhead for small operators. Flights that violate cap limits incur stiff penalties, deterring marginal trips. Operators with newer, fuel-efficient fleets are better positioned, reinforcing the trend toward replacement.
*Our forecasts treat driver/restraint impacts as directional, not additive. The impact forecasts reflect baseline growth, mix effects, and variable interactions.
Segment Analysis
By Body Type: Range-Focused Large Jets Extend Leadership
Large-cabin platforms commanded 81.62% of 2025 deliveries, reflecting buyers’ preference for aircraft that skip fuel stops on intercontinental routes. The segment is expected to expand at a 3.74% CAGR to 2031, driven by new entrants that carry up to 19 passengers in lie-flat comfort. Wide-cabin footprints support more baggage, larger galleys, and dedicated crew rest, reinforcing mission capability for overnight trips. Mid-size jets retain pockets of appeal among corporate shuttle operators seeking lower direct-operating costs, while light jets cater to short-haul, pilot-owned missions.
Buyers cite enhanced business jet market efficiency, lower maintenance intervals, and more favorable insurance terms when selecting larger models. OEMs respond with thinner carbon-fiber wings, high-thrust engines, and cabin-altitude reductions that lessen fatigue on 15-hour flights. As fleet age rises, operators see a step-change in economics: upgrading from a 2005-vintage aircraft can save USD 2.5 million in annual operating expenses over a typical 450-hour cycle. Consequently, the large-jet category should continue to anchor the business jet market well past the forecast window.


By End User: Charter and Air-Taxi Momentum Builds
Although individual ownership still accounted for 53.88% of 2025 movements, charter and air-taxi activity is growing at a rate of 7.55% annually, as digital booking apps lower barriers to entry. Younger wealth cohorts value pay-as-you-fly convenience and see crew, maintenance, and depreciation as distractions rather than status symbols. Corporate travel departments now approve charters for time-sensitive itineraries, which boosts demand for light and super-midsize jets.
Charter operators utilize data analytics to optimize routing, which increases utilization from a historical 350-hour average to more than 500 hours per airframe. Higher asset-use spreads fixed costs and allows sharper hourly pricing, attracting SMEs that once relied on commercial carriers. In parallel, governments and special-mission agencies upgrade surveillance and medevac fleets with business-jet platforms, keeping this end-user segment stable within the broader business jet market.
By Ownership Model: Membership Programs Gain Traction
New-aircraft purchases still dominated at 62.90% in 2025, but jet-card and membership schemes are climbing at an 7.92% CAGR, driven by long OEM lead times that can stretch to three years. These programs promise guaranteed aircraft within four to ten hours’ notice and fixed hourly rates in advance, making budgeting straightforward. Pre-owned units trade briskly, yet supply remains tight because owners delay sales while awaiting new deliveries.
Fractional ownership continues to globalize as regulators approve shared-asset structures from Dubai to Singapore. The model mitigates residual-value exposure and appeals to buyers who fly 50-200 hours yearly. Meanwhile, subscription plans offer tiered perks, including lounge access and carbon-offset bundles, which attract ESG-minded flyers. Combined, these innovations broaden the customer funnel and underpin the long-term health of the business jet market.
Geography Analysis
North America retained a 66.25% share in 2025, thanks to 5,000+ jet-capable airports, mature fractional programs, and the world’s largest ultra-high-net-worth population. United States corporations value productivity gains from point-to-point travel, and replacement cycles dominate order activity. Canada and Mexico add steady demand from resources and near-shoring supply chains.
South America is the fastest-growing region, with a 8.72% CAGR through 2031, driven by Brazil’s agribusiness expansion and rising elite wealth. The country already fields around 3,000 business aircraft and benefits from Embraer’s local support footprint. Argentina, Chile, and Colombia contribute incremental growth to mining and financial services clusters. Improved cross-border flight-planning rules encourage operators to base aircraft regionally instead of repositioning from Florida.
Europe faces mature demand but pivots to sustainability: SAF mandates and future hydrogen hubs frame purchase criteria. The Asia-Pacific region posts a 2.02% annual fleet expansion, compared to 1.36% worldwide, led by China, India, and Southeast Asia, where the introduction of new airports and easing of slot controls increases the number of city pairs. The Middle East and Africa remain niche but strategic, with the UAE and Saudi Arabia acting as stopover hubs for ultra-long-range legs linking Europe, Asia, and Africa. Collectively, these dynamics shape a diversified business jet market that balances replacement-driven maturity in the Western countries with initial growth in the Southern ones.

Competitive Landscape
Gulfstream, Bombardier, and Dassault anchor the premium tier, offering a 7,500 to 8,000-mile range and advanced flight decks such as Gulfstream’s Symmetry suite. These incumbents leverage global service networks to secure aftermarket annuities. Textron and Embraer compete in the light and mid-size sectors, while Honda Aircraft seeks to share the market with over-the-wing engine designs targeting efficient short-hop operations.
Technology differentiation revolves around predictive-maintenance algorithms, composite structures, and cabin-altitude innovations that reduce fatigue. Rolls-Royce Pearl and Pratt & Whitney PW800 engines promise 15% better specific fuel consumption, aligning with CORSIA goals. OEMs also launch subscription-based support packages that bundle parts, flight-planning apps, and downtime guarantees, deepening customer stickiness.
New entrants from China and Turkey explore indigenous platforms, potentially adding capacity pressure late in the decade. Meanwhile, established players hedge their carbon exposure via SAF agreements and hydrogen-testing partnerships, seeking a first-mover advantage among eco-focused high-net-worth buyers. Overall, moderate concentration persists, yet the quest for sustainable propulsion and digital services continues to redraw competitive boundaries within the business jet market.
Business Jet Industry Leaders
Bombardier Inc.
General Dynamics Corporation
Textron Inc.
Dassault Aviation SA
Embraer S.A.
- *Disclaimer: Major Players sorted in no particular order

Recent Industry Developments
- October 2025: Honda Aircraft Co. initiated the production of its first test unit of the aircraft previously known as the HondaJet 2600 concept, starting with wing-structure assembly in North Carolina.
- May 2025: Bombardier's first production Global 8000 business jet completed its maiden flight from Toronto Pearson International Airport, testing key systems under its production flight protocol.
- October 2024: Textron unveiled the next generation of its Cessna Citation light jets lineup, introducing the Cessna Citation M2 Gen3, CJ3 Gen3, and CJ4 Gen3.
- March 2024: Gulfstream received FAA certification for the G700 and began customer deliveries, marking the opening of the 7,750-mile category.


Global Business Jet Market Report Scope
By Body Type
| Large Jet |
| Mid-Size Jet |
| Light/Very-Light Jet |
By End User
| Individual Owners |
| Businesses and Corporate Entities |
| Charter/Air-Taxi Operators |
| Training and Academic Institutions |
| Government and Special-Mission Operators |
By Ownership Model
| New Aircraft Purchase |
| Pre-Owned Purchase |
| Fractional Ownership |
| Jet Cards/Membership |
By Region
| North America | United States | |
| Canada | ||
| Mexico | ||
| Europe | United Kingdom | |
| France | ||
| Germany | ||
| Italy | ||
| Spain | ||
| Russia | ||
| Netherlands | ||
| Rest of Europe | ||
| Asia-Pacific | China | |
| India | ||
| Japan | ||
| South Korea | ||
| Australia | ||
| Singapore | ||
| Indonesia | ||
| Thailand | ||
| Malaysia | ||
| Philippines | ||
| Rest of Asia-Pacific | ||
| South America | Brazil | |
| Argentina | ||
| Chile | ||
| Colombia | ||
| Rest of South America | ||
| Middle East and Africa | Middle East | Saudi Arabia |
| United Arab Emirates | ||
| Qatar | ||
| Turkey | ||
| Rest of Middle East | ||
| Africa | South Africa | |
| Egypt | ||
| Algeria | ||
| Rest of Africa | ||
| By Body Type | Large Jet | ||
| Mid-Size Jet | |||
| Light/Very-Light Jet | |||
| By End User | Individual Owners | ||
| Businesses and Corporate Entities | |||
| Charter/Air-Taxi Operators | |||
| Training and Academic Institutions | |||
| Government and Special-Mission Operators | |||
| By Ownership Model | New Aircraft Purchase | ||
| Pre-Owned Purchase | |||
| Fractional Ownership | |||
| Jet Cards/Membership | |||
| By Region | North America | United States | |
| Canada | |||
| Mexico | |||
| Europe | United Kingdom | ||
| France | |||
| Germany | |||
| Italy | |||
| Spain | |||
| Russia | |||
| Netherlands | |||
| Rest of Europe | |||
| Asia-Pacific | China | ||
| India | |||
| Japan | |||
| South Korea | |||
| Australia | |||
| Singapore | |||
| Indonesia | |||
| Thailand | |||
| Malaysia | |||
| Philippines | |||
| Rest of Asia-Pacific | |||
| South America | Brazil | ||
| Argentina | |||
| Chile | |||
| Colombia | |||
| Rest of South America | |||
| Middle East and Africa | Middle East | Saudi Arabia | |
| United Arab Emirates | |||
| Qatar | |||
| Turkey | |||
| Rest of Middle East | |||
| Africa | South Africa | ||
| Egypt | |||
| Algeria | |||
| Rest of Africa | |||


Market Definition
- Aircraft Type - General Aviation includes aircraft used for corporate aviation, business aviation and other aerial works.
- Sub-Aircraft Type - Business Jets which are private jets and are designed to carry small groups of people and are used for various roles are included in this study.
- Body Type - Light Jets, Mid-Size Jets, and Large Jets according to their ability to carry passengers and flying distance ranges have been included under this study.
| Keyword | Definition |
|---|---|
| IATA | IATA stands for the International Air Transport Association, a trade organization composed of airlines around the world that has an influence over the commercial aspects of flight. |
| ICAO | ICAO stands for International Civil Aviation Organization, a specialized agency of the United Nations that supports aviation and navigation around the globe. |
| Air Operator Certificate (AOC) | A certificate granted by a National Aviation Authority permitting the conduct of commercial flying activities. |
| Certificate Of Airworthiness (CoA) | A Certificate Of Airworthiness (CoA) is issued for an aircraft by the civil aviation authority in the state in which the aircraft is registered. |
| Gross Domestic Product (GDP) | Gross domestic product (GDP) is a monetary measure of the market value of all the final goods and services produced in a specific time period by countries. |
| RPK (Revenue Passenger Kilometres) | The RPK of an airline is the sum of the products obtained by multiplying the number of revenue passengers carried on each flight stage by the stage distance - it is the total number of kilometers traveled by all revenue passengers. |
| Load Factor | The load factor is a metric used in the airline industry that measures the percentage of available seating capacity that has been filled with passengers. |
| Original Equipment Manufacturer (OEM) | An original equipment manufacturer (OEM) traditionally is defined as a company whose goods are used as components in the products of another company, which then sells the finished item to users. |
| International Transportation Safety Association (ITSA) | International Transportation Safety Association (ITSA) is an international network of heads of independent safety investigation authorities (SIA). |
| Available Seats Kilometre (ASK) | This metric is calculated by multiplying Available Seats (AS) in one flight, defined above, multiplied by the distance flown. |
| Gross Weight | The fully-loaded weight of an aircraft, also known as “takeoff weight,” which includes the combined weight of passengers, cargo, and fuel. |
| Airworthiness | The ability of an aircraft, or other airborne equipment or system, to operate in flight and on the ground without significant hazard to aircrew, ground crew, passengers or to other third parties. |
| Airworthiness Standards | Detailed and comprehensive design and safety criteria applicable to the category of aeronautical product (aircraft, engine or propeller). |
| Fixed Base Operator (FBO) | A business or organization that operates at an airport. An FBO provides aircraft operating services like maintenance, fueling, flight training, charter services, hangaring, and parking. |
| High Net worth Individuals (HNWIs) | High Net worth Individuals (HNWIs) are individuals with over USD 1 million in liquid financial assets. |
| Ultra High Net worth Individuals (UHNWIs) | Ultra High Net worth Individuals (UHNWIs) are individuals with over USD 30 million in liquid financial assets. |
| Federal Aviation Administration (FAA) | The division of the Department of Transportation is concerned with aviation. It operates Air Traffic Control and regulates everything from aircraft manufacturing to pilot training to airport operations in the United States. |
| EASA (European Aviation Safety Agency) | The European Aviation Safety Agency is a European Union agency established in 2002 with the task of overseeing civil aviation safety and regulation. |
| Airborne Warning and Control System (AW&C) aircraft | Airborne Warning and Control System (AEW&C) aircraft is equipped with a powerful radar and on-board command and control center to direct the armed forces. |
| The North Atlantic Treaty Organization (NATO) | The North Atlantic Treaty Organization (NATO), also called the North Atlantic Alliance, is an intergovernmental military alliance between 30 member states – 28 European and two North American. |
| Joint Strike Fighter (JSF) | Joint Strike Fighter (JSF) is a development and acquisition program intended to replace a wide range of existing fighter, strike, and ground attack aircraft for the United States, the United Kingdom, Italy, Canada, Australia, the Netherlands, Denmark, Norway, and formerly Turkey. |
| Light Combat Aircraft (LCA) | A light combat aircraft (LCA) is a light, multirole jet/turboprop military aircraft, commonly derived from advanced trainer designs, designed for engaging in light combat. |
| Stockholm International Peace Research Institute (SIPRI) | Stockholm International Peace Research Institute (SIPRI) is an international institute that provides data, analysis, and recommendations for armed conflict, military expenditure, and arms trade as well as disarmament and arms control. |
| Maritime Patrol Aircraft (MPA) | A maritime patrol aircraft (MPA), also known as maritime reconnaissance aircraft is a fixed-wing aircraft designed to operate for long durations over water in maritime patrol roles, in particular, anti-submarine warfare (ASW), anti-ship warfare (AShW), and search and rescue (SAR). |
| Mach Number | The Mach number is defined as the ratio of true airspeed to the speed of sound at the altitude of a given aircraft. |
| Stealth Aircraft | Stealth is a Common term applied to low observable (LO) technology and doctrine, that makes an aircraft near invisible to radar, infrared or visual detection. |


Research Methodology
Mordor Intelligence follows a four-step methodology in all our reports.
- Step-1: Identify Key Variables: In order to build a robust forecasting methodology, the variables and factors identified in Step-1 are tested against available historical market numbers. Through an iterative process, the variables required for market forecast are set and the model is built on the basis of these variables.
- Step-2: Build a Market Model: Market-size estimations for the historical and forecast years have been provided in revenue and volume terms. For sales conversion to volume, the average selling price (ASP) is kept constant throughout the forecast period for each country, and inflation is not a part of the pricing.
- Step-3: Validate and Finalize: In this important step, all market numbers, variables and analyst calls are validated through an extensive network of primary research experts from the market studied. The respondents are selected across levels and functions to generate a holistic picture of the market studied.
- Step-4: Research Outputs: Syndicated Reports, Custom Consulting Assignments, Databases & Subscription Platforms


