Broadcast Infrastructure Market Size and Share
Market Overview
| Study Period | 2019 - 2030 |
|---|---|
| Market Size (2025) | USD 5.77 Billion |
| Market Size (2030) | USD 8.27 Billion |
| Growth Rate (2025 - 2030) | 7.47% CAGR |
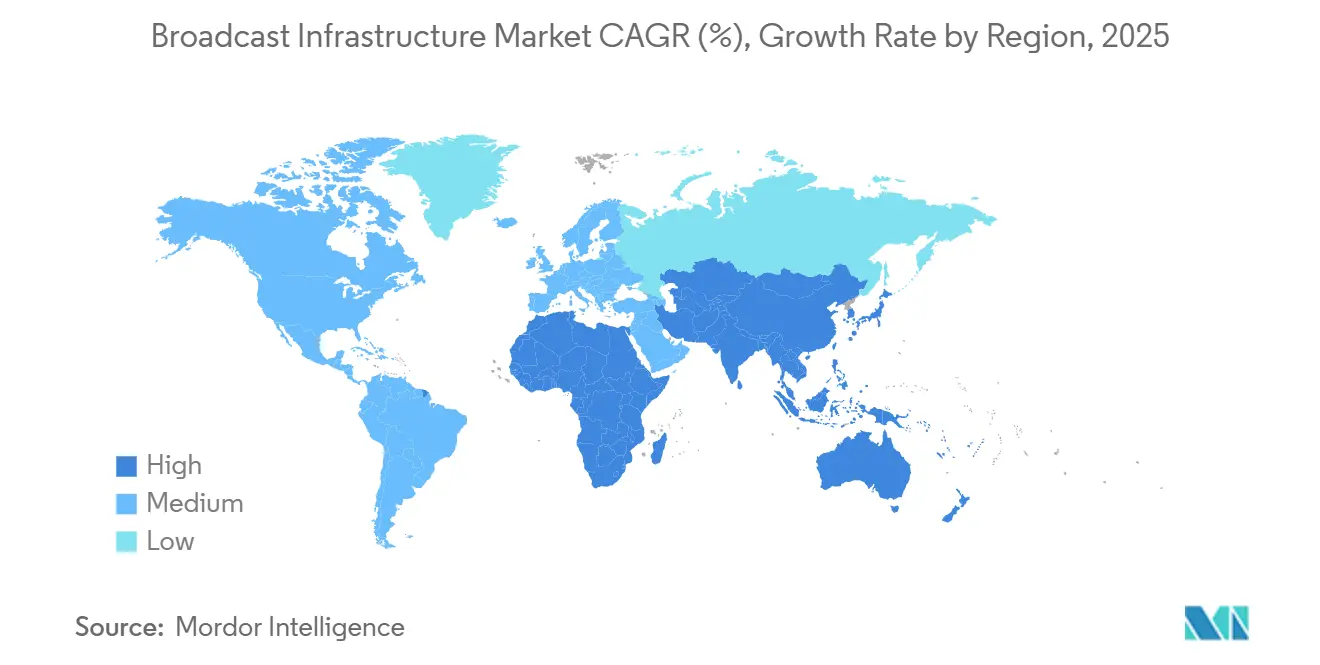
| Fastest Growing Market | Asia Pacific |
| Largest Market | North America |
| Market Concentration | Medium |
Major Players *Disclaimer: Major Players sorted in no particular order Image © Mordor Intelligence. Reuse requires attribution under CC BY 4.0. | |

Broadcast Infrastructure Market Analysis by Mordor Intelligence
The broadcast infrastructure market size reached USD 5.77 billion in 2025 and is forecast to advance to USD 8.27 billion by 2030, registering a 7.47% CAGR. Demand accelerates as broadcasters overhaul legacy plants, move from Serial Digital Interface to Internet Protocol (IP) signal chains, and integrate cloud-native workflows that support 4K, 8K, High Dynamic Range (HDR), and NextGen distribution standards. Intensifying over-the-top (OTT) viewing, 5G-Broadcast field trials, and national digital switchover deadlines reinforce capital outlays, while supply-chain tightness in specialty chipsets elevates hardware costs yet also nudges operators toward managed services. As spending shifts from fixed assets to software and outsourced operations, vendors emphasize lifecycle contracts, security-focused service portfolios, and micro-services that let stations scale encoding, playout, and contribution bandwidth on demand. Regional opportunities vary: North America sustains premium investments around ATSC 3.0, Europe finances public-service upgrades linked to spectrum refarming, and Asia-Pacific governments commit subsidies for rural transmitter refreshes to close the digital divide.
Key Report Takeaways
- By component, hardware led with 46.78% of the broadcast infrastructure market share in 2024; services expand at a 9.89% CAGR through 2030.
- By technology, OTT/streaming commanded a 37.88% share of the broadcast infrastructure market size in 2024, while cloud-based broadcasting registers the fastest 7.79% CAGR to 2030.
- By deployment model, on-premises held 59.98% of 2024 revenue; cloud and virtualized solutions rose at a 9.67% CAGR through 2030.
- By end-user, commercial television networks accounted for a 28.76% share in 2024, whereas OTT platforms logged a 7.91% CAGR between 2025-2030.
- By application, transmission and distribution captured a 31.24% share in 2024; playout and master control advance at an 8.19% CAGR through 2030.
- By geography, North America led with 33.88% revenue share in 2024; Asia-Pacific posts the quickest 7.97% CAGR to 2030.
Global Broadcast Infrastructure Market Trends and Insights
Drivers Impact Analysis*
| Driver | (~) % Impact on CAGR Forecast | Geographic Relevance | Impact Timeline |
|---|---|---|---|
| Transition from SD/HD to 4K/8K + HDR | +1.8% | Global; early roll-outs in North America and Europe | Medium term (2-4 years) |
| Government-mandated digital switchover | +1.5% | Developing economies; South Africa, Latin America, Asia-Pacific | Short term (≤ 2 years) |
| OTT platform boom and IP-based playout | +2.1% | Global; strongest in North America and Asia-Pacific | Short term (≤ 2 years) |
| 5G-Broadcast (FeMBMS) field adoption | +0.9% | Asia-Pacific pilot core; spill-over to Europe and Americas | Long term (≥ 4 years) |
| Cloud-native remote production workflows | +1.2% | North America and EU; expanding in Asia-Pacific | Medium term (2-4 years) |
| AI-driven hyper-personalized content | +0.8% | North America and Europe; emerging Asia-Pacific | Long term (≥ 4 years) |
| Source: Mordor Intelligence | |||
Transition from SD/HD to 4K/8K and HDR upgrades
Ultra-high-definition (UHD) adoption forces end-to-end re-engineering of cameras, routers, switchers, and distribution chains. Public broadcasters in Germany, France, and the U.K. earmarked EUR 2.3 billion (USD 2.6 billion) for UHD build-outs between 2024-2026. [1]“UHD Strategy 2024-2026,” European Broadcasting Union, ebu.ch Sports rightsholders treat 4K and HDR as baseline, compelling facilities to migrate to SMPTE ST 2110 IP fabric. The technology refresh also improves power efficiency, creating operational savings that partially offset capex spikes. Vendor roadmaps now prioritize 25 GbE and 100 GbE interfaces plus JPEG-XS compression to preserve picture quality at manageable bit-rates. As consumer 8K panel penetration inches upward, broadcasters future-proof investments by specifying bandwidth headroom in switch matrices and storage arrays.
Government-mandated digital switchover programs
Regulators accelerate analog switch-offs to reclaim sub-700 MHz spectrum for mobile data. The National Telecommunications and Information Administration’s 2025 Spectrum Strategy targets smoother repacking by sharing propagation models and funding transitional filters. [2]“National Spectrum Strategy 2025,” National Telecommunications and Information Administration, ntia.gov South Africa extended subsidy coupons so low-income households can replace analog set-tops, unlocking orders for roughly 400 transmitting sites by 2025. Similar incentives in Brazil and Indonesia compress network-upgrade calendars, creating procurement peaks that favor turnkey integrators with proven site services. Compliance timetables also stimulate demand for monitoring probes that validate DVB-T2 and ISDB-T signals.
The OTT platform boom necessitates IP-based playout.
Streaming’s share of prime-time viewing topped 36% in the United States in 2024, surpassing cable for the first time. [3]“AWS Elemental Advances Encoding,” Amazon Web Services, aws.amazon.com Platforms such as Netflix and Disney+ extend regional headend nodes, prompting broadcasters to pivot toward software-defined encoders and statmux tools that unify linear and on-demand output. Cloud providers respond with media-optimized compute instances, inching encoding efficiency gains near 40%, letting operators add adaptive-bit-rate ladders without new rack capacity. The broadcast infrastructure market increasingly revolves around service-level agreements (SLAs) for latency, failover, and just-in-time packaging, elevating the role of continuous integration and DevOps in playout operations.
Cloud-native remote production workflows
Live events now leverage virtualized control rooms where talent and technical directors connect via managed broadband. The European Broadcasting Union trimmed outside-broadcast truck deployment costs by 30% during the 2024 cycling events through distributed production. Micro-services mix audio, vision, and graphics in the cloud, enabling flexible crew allocation and smaller on-site footprints. Talent-located latency remains under 200 ms, acceptable for intercuts in panel discussions. As 5G private networks mature, cloud-switching latencies will drop further, opening remote production to mid-tier newsrooms and college sports. Equipment makers bundle orchestration dashboards to streamline multicloud provisioning and rights-managed feed routing.
Restraints Impact Analysis*
| Restraint | (~) % Impact on CAGR Forecast | Geographic Relevance | Impact Timeline |
|---|---|---|---|
| High CAPEX for legacy infrastructure overhaul | -1.4% | Global; acute for small and public broadcasters | Medium term (2-4 years) |
| Spectrum scarcity and re-allocation headwinds | -0.8% | Urban North America, Europe; congested metro corridors | Long term (≥ 4 years) |
| Cyber-security risks in IP broadcast chains | -0.6% | Global; escalates in critical news origination hubs | Short term (≤ 2 years) |
| Skills gap in virtualized broadcast engineering | -0.9% | North America and Europe; looming Asia-Pacific shortage | Medium term (2-4 years) |
| Source: Mordor Intelligence | |||
High CAPEX for legacy infrastructure overhaul
Replacing coax-based plants with ST 2110 switching often doubles short-term operating costs because simulcast SDI paths must remain active during migration. Specialty camera sensors climbed 18% in 2024 amid chip shortages, inflating equipment lines on broadcaster budgets. Public-service stations, depending on yearly appropriations, postpone certain refresh cycles, creating an age-based patchwork that complicates spares management. Leasing models and pay-as-you-go encoding nodes soften outlays, yet board approvals still slow multi-million-dollar facility re-architectures. Smaller market outlets weigh the risk of stranded investments if standards evolve again before amortization.
Cybersecurity vulnerabilities in IP-based broadcast chains
Open protocols introduce attack surfaces absent in point-to-point SDI. Ransomware incidents at two European playout centers in late 2024 blacked out multiple channels for several hours, forcing emergency tape playback. Zero-trust frameworks, segmented VLANs, and real-time anomaly detection add cost and complexity, especially where media asset management (MAM) systems integrate with corporate IT. Cyber-insurance premiums for broadcasters rose 22% in 2025, reflecting elevated threat perception. Compliance with ISO 27001 and ETSI TS 103 645 becomes procurement criteria, benefitting vendors bundling hardening services and secure firmware pipelines.
*Our forecasts treat driver/restraint impacts as directional, not additive. The impact forecasts reflect baseline growth, mix effects, and variable interactions.
Segment Analysis
By Component: Services catalyze managed-infrastructure adoption
Hardware maintained 46.78% of the broadcast infrastructure market share in 2024, anchored by cameras, routers, servers, and high-power transmitters that remain indispensable to linear workflows. Yet the services cohort grows 9.89% CAGR to 2030 as stations outsource 24/7 network operations centers (NOCs), field maintenance, and standards compliance. The pivot lets finance departments treat infrastructure as an operating expense, smoothing cash flow and redirecting capital toward premium content.
Rising demand for vulnerability assessments, 2110 interoperability audits, and disaster-recovery sandboxing positions integrators as strategic partners. Harmonic’s Video SaaS bookings rose 18% in 2024, demonstrating how recurring revenue offsets cyclical hardware orders. Software upgrades add value layers through low-latency transcoders and AI-enabled quality analytics, helping vendors monetize installed bases without shipping new iron. The broadcast infrastructure market benefits when lifecycle agreements bundle spares, firmware, and training because they reduce unplanned downtime penalties.


By Technology: Cloud-based broadcasting posts the fastest trajectory
OTT and streaming workflows captured 37.88% revenue in 2024 as audiences gravitated toward personalized catalogs and binge-friendly interfaces. Still, legacy terrestrial and satellite links remain central for national reach and disaster-resilient distribution. Cloud-based broadcasting delivers the strongest 7.79% CAGR, driven by gigabit broadband penetration and media-optimized instance families that slash spin-up times for pop-up channels.
Broadcasters string together containerized encoders, origin servers, and dynamic ad insertion (DAI) modules to serve both linear and on-demand feeds from a unified control plane. During the 2024 European Championship qualifiers, a major public network spun up 24 temporary pop-up streams within three hours, illustrating elasticity gains. Traditional satellite operators integrate virtual multiplexing hubs so affiliates can insert local ads without full uplink gear. As cross-region replication matures, failover between clouds will rival terrestrial redundancy assurances, making the cloud the de facto choice for secondary origination.
By Deployment Model: Cloud and virtualized solutions gain momentum
On-premises deployments held 59.98% of 2024 spend, reflecting sunk investment in SDI routers, multiviewers, and legacy encoders that still deliver reliable service. However, cloud and virtualized implementations scale at 9.67% CAGR as corporate governance shifts accept content control in encrypted public clouds. Hybrid approaches-where timing-sensitive baseband stays on site and non-live workloads burst to cloud-emerge as pragmatic compromises.
Commercial newsrooms increasingly virtualize ingest, proxy editing, and compliance logging, which are compute-intensive yet latency light. Peer-to-peer gateways offload mezzanine files overnight, freeing daytime bandwidth for live hits. With subscription pricing tied to encoder hours, finance teams treat technology refreshes as pay-per-use services. Expect local stations to remain cautious for primary playout until deterministic network class-C latency across the public internet becomes viable.
By End-User: OTT platforms propel infrastructure innovation.
Commercial TV networks owned a 28.76% share in 2024, leveraging advertising reach and syndication revenue to finance NextGen TV proof-of-concepts. Public service broadcasters uphold universal service mandates and emergency alerting obligations, sustaining demand for high-power transmitters and redundant headends. OTT platforms accelerate at 7.91% CAGR as subscription leaders extend edge nodes in tier-2 cities, tightening round-trip latency and fostering 4K adaptive bit-rate ladders.
Streaming giants pursue micro-services for just-in-time packaging, server-side ad insertion, and low-latency Common Media Application Format (CMAF) chunks to reach sub-5-second glass-to-glass delay. Meanwhile, production studios shift to cloud-native finishing, allowing colorists and sound editors to collaborate remotely, which reduces facility overhead. Cable operators adopt IP-video gateways to collapse QAM racks and gain spectrum headroom for DOCSIS 4.0 broadband, reconfirming IP convergence as a universal trend across end-user classes.

By Application: Playout and master control modernize for multi-platform reach
Transmission and distribution represented 31.24% revenue in 2024, covering terrestrial antenna systems, satellite uplinks, and CDN contracts that push finished feeds to viewers. Yet playout and master control will post an 8.19% CAGR because channels need flexible automation to queue pop-up feeds, regionalize branding, and output multiple over-the-top renditions from the same lineup.
Next-gen master controls rely on API-driven orchestration so traffic systems can call up branding elements dynamically for FAST (Free Ad-supported Streaming TV) channels. Vendor roadmaps embed ML-based QC that alerts operators to audio-loudness drifts or caption misalignment before clips air. Ingest nodes pre-package VOD assets simultaneously, lowering handling cost and ensuring compliance across linear and on-demand rights windows. As event-based advertising proliferates, master controls integrate real-time data feeds to trigger addressable ad breaks, weaving new monetization models into traditional linear operations.
Geography Analysis
North America retained 33.88% of 2024 revenue as broadcasters embraced ATSC 3.0 datacasting and cloudified remote production. Station-group consolidations yield scale economies, letting shared hubs manage playout for clusters of affiliates across multiple Designated Market Areas. Federal Communications Commission frameworks encourage voluntary ATSC 3.0 migration, and state disaster-relief agencies fund next-generation emergency alerting features, ensuring continued infrastructure expansion.
Europe exhibits balanced investment led by public-service modernization tied to green energy mandates. Broadcasters sunset legacy generators replacing them with lithium-ion UPS and intelligent cooling, lowering facility carbon footprints. Regional regulatory bodies synchronize spectrum clearing, helping digital terrestrial operators trade channel capacity for multiplexing efficiency. Markets such as Spain integrate HbbTV for interactive applications, necessitating hybrid IP routers and application servers inside headends.
Asia-Pacific logs the fastest 7.97% CAGR as governments channel stimulus into rural connectivity. India’s Telecom Regulatory Authority auctions guard bands supporting 5G-Broadcast pilots, while China Television System completes Phase 2 of its 8K trial network ahead of major sporting events. Australia’s ACMA approves single-frequency networks to economize island community coverage, triggering transmitter consolidation programs. Southeast Asian multichannel video providers pivot to OTT super-apps, fueling CDN build-outs and multi-tenant cloud playout adoption. Each country’s unique language bouquet and time-zone alignment complicate workflows, elevating demand for multilingual subtitling and localized edge caching.

Competitive Landscape
Market concentration remains moderate, with the five largest vendors controlling nearly 48% of revenue. Incumbent hardware specialists transform into solution-as-a-service providers, bundling orchestration software and white-glove integration. Harmonic’s 2024 turnaround illustrates the benefit of recurring SaaS contracts that offset cyclic encoder hardware refreshes. Evertz upgrades its Magnum orchestration to broker IP and baseband flows in mixed plants, capturing orders from cross-border sports networks. Rohde & Schwarz leverages its transmitter pedigree to pilot 5G-Broadcast with tower-co Vantage Towers in Germany, carving a new line of revenue around direct-to-device distribution.
Cloud hyperscalers intensify competition: Amazon Web Services positions Elemental Media Services inside turnkey broadcast blueprints, offering disaster-recovery playout at usage pricing. Microsoft inaugurates Azure Deployment of SMPTE ST 2110 reference flows, courting NewsTech alliances. Start-ups such as Zixi and Sienna position protocol gateways that guarantee ultra-low-latency contribution over unmanaged networks, luring niche sports leagues seeking cost-effective remote production. Patent-race dynamics focus on AI-trusted encoding decisions, edge caching algorithms, and resilient contribution protocols.
Strategic partnerships proliferate. LiveU teams with One Media Mexico on ATSC 3.0 dual-distribution, merging bonded-cellular field encoders with transmitter upgrades. Imagine Communications signs alliances with telco ISPs to embed edge channels on broadband gateways, ensuring QoS for premium sports. Vendors differentiate through compliance: achieving ISO 27001, DPP COMPLY, and CSA STAR certifications addresses broadcasters’ escalating security and governance checks. Overall, the ecosystem’s shift to subscription models steadies revenue visibility yet forces traditional equipment sellers to reshape sales incentives around annual recurring revenue rather than one-time capex deals.
Broadcast Infrastructure Industry Leaders
Evertz Technologies Limited
Harmonic Inc.
Imagine Communications Corp.
Grass Valley USA LLC
Rohde & Schwarz GmbH & Co KG
- *Disclaimer: Major Players sorted in no particular order


Recent Industry Developments
- October 2025: Amazon Web Services activated four new AWS Local Zones optimized for media workloads in São Paulo, Mumbai, Paris, and Melbourne, reducing end-to-end streaming latency by up to 35% for regional OTT providers.
- July 2025: Evertz and Microsoft Azure announced a joint low-latency remote-production solution that synchronizes multi-camera feeds across regions in under 150 ms, demonstrated during a live international esports tournament.
- May 2025: Harmonic introduced a subscription-based UHD/HDR playout-as-a-service platform, enabling midsize broadcasters to launch cloud-native channels in less than 48 hours with built-in SCTE-224 ad-trigger support.
- March 2025: Rohde & Schwarz completed the first nationwide 5G-Broadcast rollout in Germany, activating 350 transmitter sites that deliver free-to-air UHD content directly to smartphones without consuming cellular data.


Global Broadcast Infrastructure Market Report Scope
| Hardware |
| Software |
| Services |
| Digital Terrestrial Broadcasting |
| Satellite Broadcasting |
| IPTV |
| OTT / Streaming |
| Cloud-based Broadcasting |
| On-premises |
| Cloud / Virtualised |
| Hybrid |
| Public Service Broadcasters |
| Commercial TV Networks |
| Cable and Satellite Operators |
| OTT Platforms / Streaming Services |
| Production and Post-production Studios |
| Content Production |
| Contribution and Links |
| Playout and Master Control |
| Transmission / Distribution |
| North America | United States | |
| Canada | ||
| Mexico | ||
| Europe | Germany | |
| United Kingdom | ||
| France | ||
| Russia | ||
| Rest of Europe | ||
| Asia-Pacific | China | |
| Japan | ||
| India | ||
| South Korea | ||
| Australia | ||
| Rest of Asia-Pacific | ||
| Middle East and Africa | Middle East | Saudi Arabia |
| United Arab Emirates | ||
| Rest of Middle East | ||
| Africa | South Africa | |
| Egypt | ||
| Rest of Africa | ||
| South America | Brazil | |
| Argentina | ||
| Rest of South America | ||
| By Component | Hardware | ||
| Software | |||
| Services | |||
| By Technology | Digital Terrestrial Broadcasting | ||
| Satellite Broadcasting | |||
| IPTV | |||
| OTT / Streaming | |||
| Cloud-based Broadcasting | |||
| By Deployment Model | On-premises | ||
| Cloud / Virtualised | |||
| Hybrid | |||
| By End-user | Public Service Broadcasters | ||
| Commercial TV Networks | |||
| Cable and Satellite Operators | |||
| OTT Platforms / Streaming Services | |||
| Production and Post-production Studios | |||
| By Application | Content Production | ||
| Contribution and Links | |||
| Playout and Master Control | |||
| Transmission / Distribution | |||
| By Geography | North America | United States | |
| Canada | |||
| Mexico | |||
| Europe | Germany | ||
| United Kingdom | |||
| France | |||
| Russia | |||
| Rest of Europe | |||
| Asia-Pacific | China | ||
| Japan | |||
| India | |||
| South Korea | |||
| Australia | |||
| Rest of Asia-Pacific | |||
| Middle East and Africa | Middle East | Saudi Arabia | |
| United Arab Emirates | |||
| Rest of Middle East | |||
| Africa | South Africa | ||
| Egypt | |||
| Rest of Africa | |||
| South America | Brazil | ||
| Argentina | |||
| Rest of South America | |||


Key Questions Answered in the Report
What CAGR does the broadcast infrastructure market expect between 2025 and 2030?
The market is projected to grow at a 7.47% CAGR, rising from USD 5.77 billion in 2025 to USD 8.27 billion by 2030.
Which component segment is expanding fastest?
Managed services and professional support post a 9.89% CAGR as broadcasters shift from capex purchases to subscription-based operations.
Why is Asia-Pacific the fastest-growing region?
Government subsidies for digital-switchover, 5G-Broadcast pilots, and rising OTT penetration fuel a 7.97% CAGR across Asia-Pacific.
How will 5G-Broadcast influence traditional distribution?
5G-Broadcast enables direct-to-device delivery without cellular data usage, offering spectrum-efficient simulcast options for live events and emergency alerts.
What security challenges accompany IP broadcast migration?
Open IP workflows elevate cyber-risk, prompting investment in zero-trust segmentation, real-time anomaly detection, and ISO 27001 compliance audits.
Page last updated on:


