TV Analytics Market Size and Share
Market Overview
| Study Period | 2019 - 2030 |
|---|---|
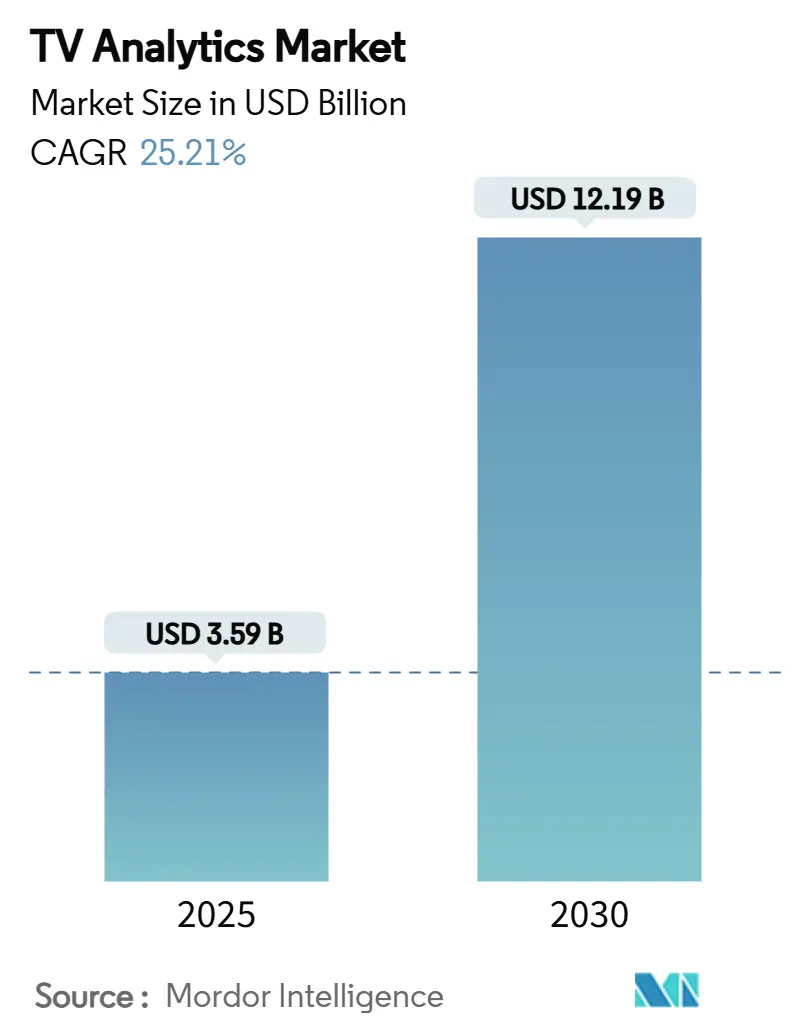
| Market Size (2025) | USD 3.59 Billion |
| Market Size (2030) | USD 12.19 Billion |
| Growth Rate (2025 - 2030) | 25.21% CAGR |
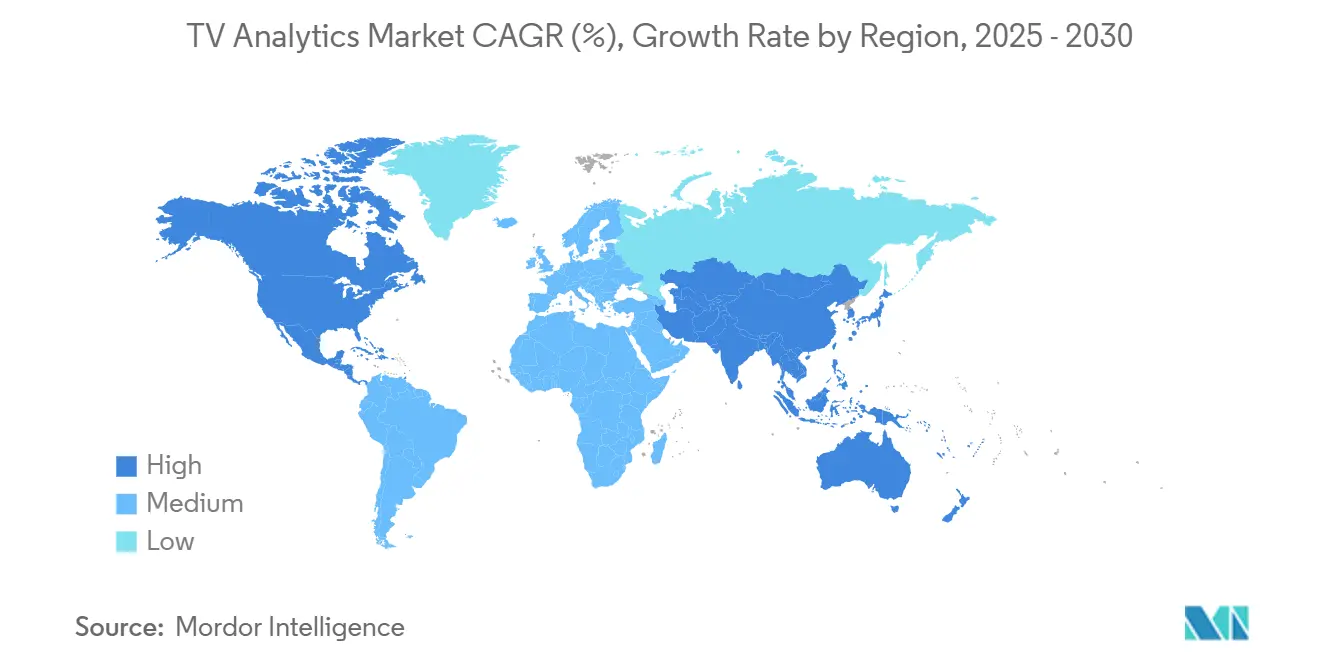
| Fastest Growing Market | Asia Pacific |
| Largest Market | North America |
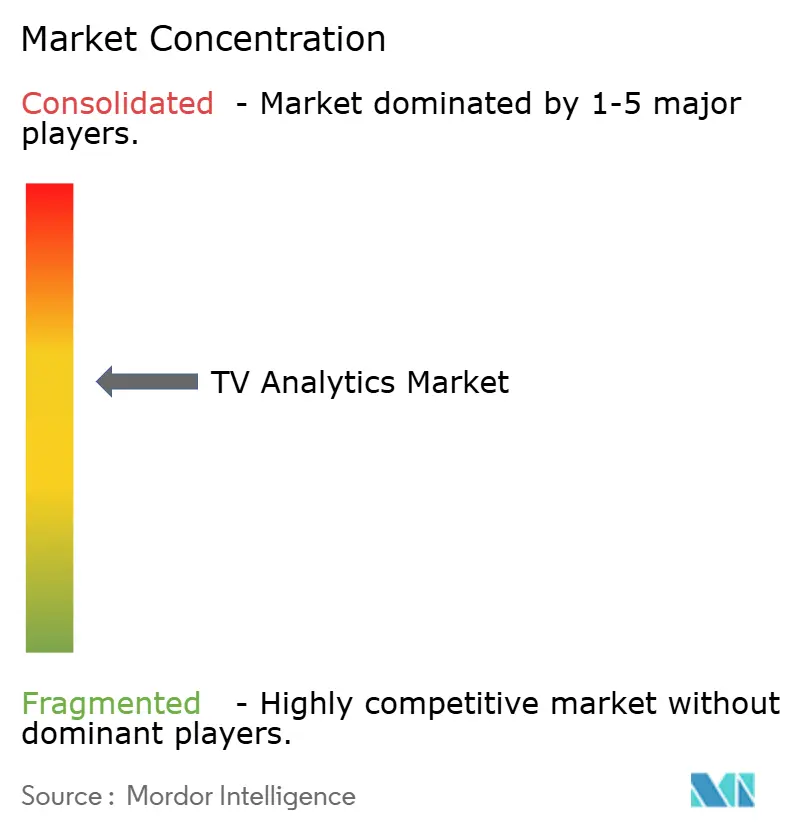
| Market Concentration | Medium |
Major Players *Disclaimer: Major Players sorted in no particular order Image © Mordor Intelligence. Reuse requires attribution under CC BY 4.0. | |
TV Analytics Market Analysis by Mordor Intelligence
The TV analytics market is valued at USD 3.59 billion in 2025 and is forecast to reach USD 12.19 billion by 2030, translating to a 25.21% CAGR over the period. Demand surges as connected-TV advertising, smart-TV automatic content recognition, and unified measurement currencies converge inside streaming ecosystems. Cloud-native deployment, predictive algorithms, and second-by-second audience reads are replacing legacy rating panels, allowing advertisers to optimise campaigns and programmers to steer green-light decisions in real time. Vendor competition is intensifying as traditional measurement providers confront platform-native challengers armed with proprietary viewership data, while looming attention-based currencies reshape ROI conversations. Privacy regulation, edge-AI silicon costs, and fragmented standards temper adoption but also open niches for privacy-preserving analytics frameworks.
Key Report Takeaways
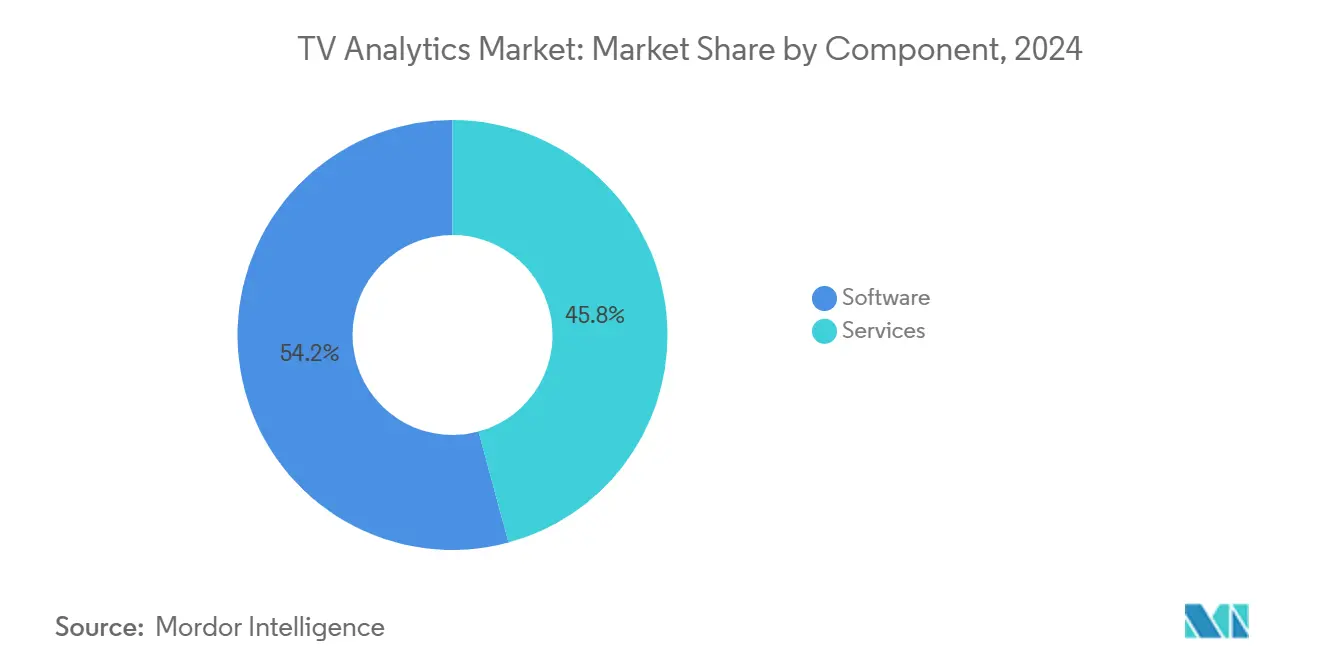
- By component, software captured 54.20% market share of the TV analytics market in 2024.
- By deployment mode, the TV analytics market for cloud is projected to grow at a 23.80% CAGR between 2025 to 2030.
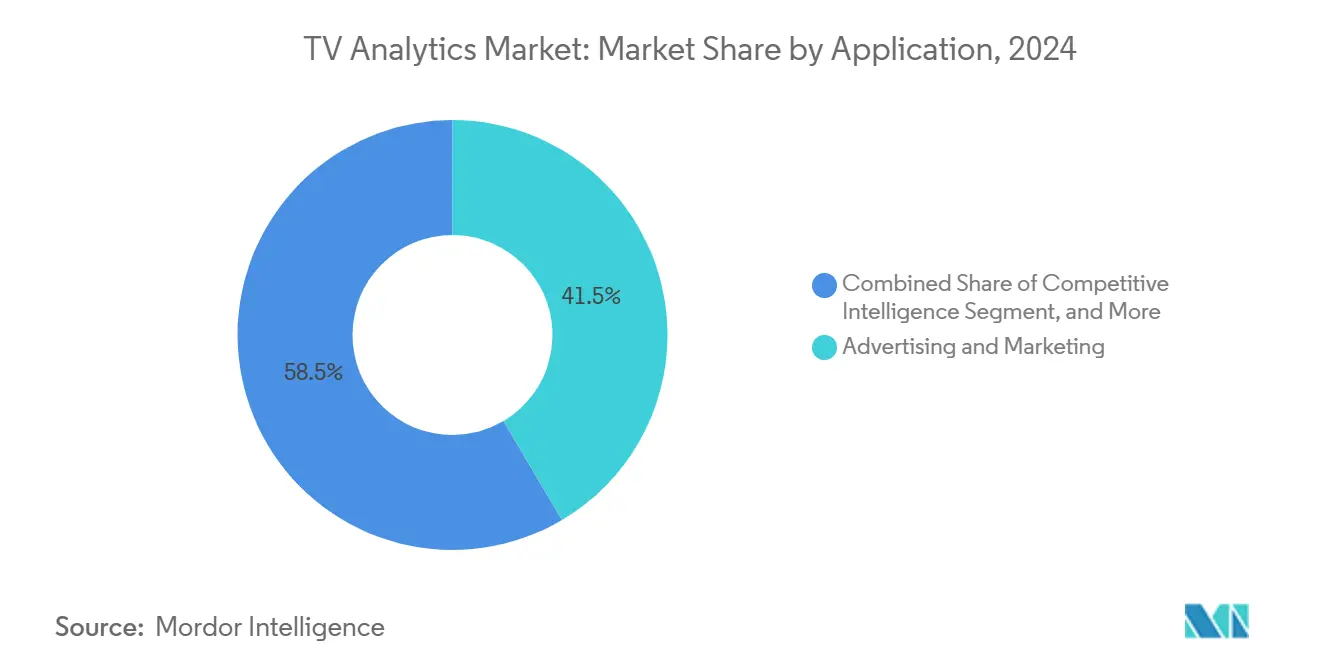
- By application, advertising and marketing captured 41.50% of the TV analytics market size in 2024.
- By end user, the TV analytics market for smart-TV OEMs is projected to grow at a 26.10% CAGR between 2025-2030.
- By geography, North America captured a 35% market share TV analytics market in 2024.
Global TV Analytics Market Trends and Insights
Drivers Impact Analysis*
| Driver | (~) % Impact on CAGR Forecast | Geographic Relevance | Impact Timeline |
|---|---|---|---|
| Surge in CTV/OTT ad-spend demanding granular targeting analytics | +6.8% | Global, with North America and Europe leading adoption | Medium term (2-4 years) |
| Intensifying content wars pushing data-led programming decisions | +5.2% | Global, particularly in mature streaming markets | Long term (≥ 4 years) |
| Smart-TV ACR proliferation enabling second-by-second viewership capture | +4.9% | Asia Pacific core, spill-over to North America | Short term (≤ 2 years) |
| Cloud-native analytics platforms lowering deployment barriers | +3.7% | Global, with faster adoption in developed markets | Medium term (2-4 years) |
| Holding-company mandates for attention-based currencies from 2026 | +2.8% | North America and EU, expanding to other regions | Long term (≥ 4 years) |
| Federated-learning pipelines unlocking cross-device attribution | +2.1% | Global, with early gains in tech-forward markets | Long term (≥ 4 years) |
| Source: Mordor Intelligence | |||
Surge in CTV/OTT Ad-Spend Demanding Granular Targeting Analytics
Connected-TV ad budgets continue to climb as marketers migrate spend from linear schedules to data-rich streaming inventories. Netflix’s ad-tier membership expanded 34% quarter-on-quarter during 2024, underpinning its USD 43.5–44.5 billion 2025 revenue target.[1]Netflix Inc., “10-K Annual Report,” last10k.comRoku delivered USD 824 million platform revenue in 2024, proving the pull of first-party viewership insights for advertisers. Such results highlight why agencies demand campaign reporting that marries household reach with behavioural segments at speed. Real-time data ingestion pipelines and AI-assisted optimisation now sit at the centre of media buying workflows, forcing analytics providers to guarantee both scale and millisecond responsiveness. As supply-path convergence accelerates, unified dashboards that normalise log-level signals across multiple sell-side platforms are becoming the default planning cockpit for brand teams.
Intensifying Content Wars Pushing Data-Led Programming Decisions
Subscriber acquisition battles have lifted analytics from a support role to a strategic command post. Engagement metrics and completion rates determine which series receive renewal budgets and which languish in catalogues. Netflix accounted for 40% of total US TV time during several 2024 weeks, a dominance it credits to algorithm-guided commissioning. Studios now pair sentiment analysis from social feeds with predictive models that simulate lifetime title value across territories. As licensing costs spike, decision-makers lean on granular cohort insights to de-risk content bets and schedule tactical promotional bursts. The winner-takes-most dynamic fuels platform spend on proprietary dashboards and on mergers that secure fresh data signals, reinforcing analytics as a competitive backbone rather than an optional add-on.
Smart-TV ACR Proliferation Enabling Second-by-Second Viewership Capture
Automatic content recognition chips embedded by leading OEMs transform every television into a continuous measurement node. University College London researchers confirmed that ACR identifies programmes across linear, streaming, and HDMI inputs with region-specific optimisations. Samsung retained the top global TV shipment position for an eighteenth year, leveraging premium sets to amass opt-in data lakes for advertisers and content teams. Such second-by-second telemetry fuels dynamic ad insertion, real-time creative testing, and cross-device attribution models. Privacy switches that shut traffic entirely when disabled demonstrate built-in compliance but also reveal potential gaps where consent rates lag. Regions with rapid smart-TV replacement cycles, therefore, emerge as early ACR analytics goldmines.
Cloud-Native Analytics Platforms Lowering Deployment Barriers
Elastic infrastructure shifts tooling decisions from capital budgets to operating lines. Microsoft’s cloud revenue climbed 23% to USD 137.7 billion in 2024, energised by AI accelerators that process terabytes of video exhaust without on-premises investment. Nielsen’s swift incorporation of first-party streaming data following Media Rating Council accreditation underscores how public-cloud pipelines shorten innovation lead times. Pay-as-you-go pricing allows mid-tier broadcasters to experiment with attribution models that once required enterprise budgets. Cloud architectures also unlock serverless federated-learning deployments that train on device-level vectors without exporting personal identifiers, crucial under tightening privacy regimes.
Restraints Impact Analysis*
| Restraint | (~) % Impact on CAGR Forecast | Geographic Relevance | Impact Timeline |
|---|---|---|---|
| Disparate measurement standards hindering unified currency | -4.3% | Global, with fragmentation most acute in emerging markets | Medium term (2-4 years) |
| Tightening privacy regulations (GDPR, CCPA 2.0, CPRA) | -3.8% | North America and EU, expanding globally | Long term (≥ 4 years) |
| Default ad-blocking at TV-OS layer curbing data collection | -2.1% | Global, with higher impact in privacy-conscious regions | Short term (≤ 2 years) |
| High cost of on-device edge-AI analytics silicon | -1.9% | Global, with cost pressures most acute in price-sensitive markets | Medium term (2-4 years) |
| Source: Mordor Intelligence | |||
Disparate Measurement Standards Hindering Unified Currency
Advertisers confront incompatible reach metrics across audience-selling platforms, raising transaction costs and dampening spend velocity. The US Joint Industry Committee certified iSpot.tv as a national currency in 2024, yet conflicting baseline definitions remain across other vendors. Comscore’s national TV revenue slipped to USD 85.8 million in Q2 2024 amid renewal headwinds linked to methodology debates. Buyers demand interoperable impression counts and attention weighting, pushing the ecosystem toward mergers or standards bodies. Until consensus emerges, many brands hedge budgets, limiting upside for the TV analytics market.
Tightening Privacy Regulations (GDPR, CCPA 2.0, CPRA)
Global regulators intensify scrutiny of cross-device tracking, compelling analytics suppliers to balance insight depth with personal-data minimisation. The Center for Digital Democracy detailed how connected-TV telemetry weaves into wider adtech graphs, prompting calls for stronger safeguards. Compliance engineering adds cost layers that pressure smaller toolmakers and may dilute reporting granularity if opt-out ratios climb. Yet regulation also fosters differentiation opportunities for privacy-preserving designs such as on-device aggregation and secure multiparty computation. Vendors able to operationalise these techniques without sacrificing speed or precision will gain trust and market share.
*Our forecasts treat driver/restraint impacts as directional, not additive. The impact forecasts reflect baseline growth, mix effects, and variable interactions.
Segment Analysis
By Component: Services Capture High-Velocity Growth
Software still formed the bulk of 2024 revenue at 54.20%, reflecting early dependence on dashboard licences and processing engines. Nevertheless, consulting, implementation, and managed insights services are expanding at a 21.40% CAGR and are forecast to overtake software during the outlook horizon, underscoring a shift toward outcome-based partnerships. Adoption complexity, ever-evolving privacy compliance, and cross-platform integration hurdles push buyers to outsource analytics orchestration. Vendors, therefore, bundle cloud provisioning, data-science talent, and business-intelligence storytelling inside multi-year retainers, creating predictable annuity streams. This pivot supports expansion of the TV analytics market because clients seek continuous optimisation rather than static toolkits.
The rapid professional-services uptrend magnifies differentiation for players possessing domain experts fluent in ad operations, content strategy, and regulatory law. Adobe grew subscription sales within its Digital Experience unit to USD 4.86 billion in fiscal 2024, proving the appetite for ongoing value delivery beyond pure licence revenue.[2]Adobe Inc., “Fiscal 2024 Report,” sec.gov As service lines mature, margin profiles improve due to reusable playbooks and automation frameworks. This reinforces revenue stickiness and enhances competitive barriers, elevating the TV analytics market size trajectory in later forecast years.


By Deployment Mode: Cloud Dominance Reconfigures Infrastructure
The cloud model commanded 63% share of the TV analytics market size in 2024, benefiting from elastic computing, integrated AI accelerators, and reduced time-to-value. At a 23.80% CAGR, cloud deployments are set to widen the gap over on-premises peers, particularly as generative-AI workloads scale audience segmentation and creative testing modules. Usage-based cost structures align with volatile campaign cycles, letting buyers flex capacity instead of over-provisioning. Security accreditation advances and dedicated region zones further ease migration for finance and government broadcasters previously tied to private servers.
On-premises solutions retain relevance where ultra-low latency or sovereign-data directives exist, but maintenance overhead and refresh capital deter new entrants. Alphabet’s 35% Google Cloud revenue jump in Q3 2024 signals strong demand for AI infrastructure that underpins video analytics workflows at petabyte scale. Cloud-native architectures also unlock seamless federation with mobile, desktop, and console telemetry feeds, reinforcing end-to-end attribution narratives.
By Application: Recommendation Engines Accelerate Engagement
Advertising and marketing tools still hold the largest slice, generating 41.50% revenue in 2024 because brands value immediate campaign ROI visibility. Yet recommendation and personalization engines outpace all peers at 24.10% CAGR to 2030 as platforms prioritise viewer retention amid subscription saturation. Personalisation algorithms drive incremental watch hours, which in turn lift ad-impression inventory or curb churn penalties, translating into tangible lifetime-value gains. Netflix attributes its watch-time leadership partly to finely tuned content rows that refresh per user and context, reinforcing the commercial imperative behind sophisticated recommender stacks.
Meanwhile, churn-management and lifetime-value analytics broaden from dashboards to automated retention triggers, integrating with push-notification systems and payment-retry engines. Competitive intelligence modules equip executives with rival release calendars and genre performance insights, shaping acquisition strategies. As applications mature, convergence emerges where a single data spine feeds both ad effectiveness measurement and content discovery, enabling cost efficiencies and holistic audience understanding throughout the TV analytics market.

By End User: Smart-TV OEMs Monetise Screen Ownership
OTT and streaming providers retained 38.80% of 2024 revenue, given their direct reliance on data for programming, monetisation, and retention. Broadcasters, advertisers, and telecom operators maintain active participation as they modernise legacy delivery models. The standout growth, however, belongs to smart-TV OEMs, advancing at 26.10% CAGR as manufacturers pivot from one-off hardware margins to recurring advertising and data-licensing income. Vizio’s advertising revenue jumped 31% alongside 20.5 billion SmartCast hours viewed, exemplifying the upside.
OEMs exploit native operating systems and ACR pipelines to harvest unmatched device-level telemetry, granting them leverage with content owners and demand-side platforms. They integrate shoppable ad formats and contextual overlay units directly into interface layers, capturing incremental spend previously flowing elsewhere. As more manufacturers embed media businesses inside product strategies, the TV analytics market attracts new capital and innovation vectors.
Geography Analysis
North America commanded 35% of global revenue in 2024, propelled by entrenched streaming penetration, mature programmatic ad ecosystems, and a regulatory environment that, despite tightening, still fosters advanced measurement experimentation. Netflix, Roku, and Google each earmarked sizeable 2025 outlays to deepen analytics and ad-tech capabilities, reinforcing the region’s innovation gravity. Attention-based currencies, championed by agency holding groups, begin large-scale pilots here first, underpinning demand for second-by-second, person-level data captures. Privacy revisions such as CPRA heighten compliance spending but ultimately broaden consent frameworks that standardise data collection routes, sustaining the TV analytics market growth path.
Europe follows with sophisticated but privacy-constrained progress. General Data Protection Regulation enforcement obliges vendors to embrace on-device aggregation and differential-privacy noise injection, boosting trust yet elongating deployment cycles. Broadcasters leverage regional cooperatives to pool datasets, achieving scale without breaching sovereignty lines. Media groups in Germany, France, and the Nordics increasingly benchmark attention metrics against North American peers, creating cross-Atlantic knowledge spill-overs that lift solution quality across the TV analytics industry. Although spend per household trails the United States, uniform smart-TV uptake and expanding multilingual catalogues drive sustainable demand for localisation analytics that map dialect preferences to engagement curves.
Asia Pacific is the fastest-growing territory, clocking a 14.80% CAGR to 2030 as rising disposable incomes, affordable broadband, and aggressive smartphone-to-TV casting behaviours stimulate streaming. Samsung’s regional dominance grants hardware anchorage for ACR data supply, while local OTT champions in India, Korea, and Southeast Asia integrate vernacular recommendation layers. Governments encourage domestic content quotas, adding complexity that analytics engines solve via genre tagging and regional similarity matrices. Privacy regimes vary widely, requiring adaptive consent screens and dynamic data-retention policies. Nonetheless, the demographic dividend and device-refresh pace amplify incremental viewer impressions, enlarging the TV analytics market size baseline across the decade.

Competitive Landscape
Legacy measurement titans and cloud-first disruptors compete for wallet share inside a market that remains only moderately consolidated. Nielsen retains accreditation breadth after incorporating live-streaming person-level data, strengthening cross-platform credibility. Yet Comscore’s revenue slide highlights how renewal risk rises when methodological clarity lags. Platform-native contenders iSpot.tv and Samba TV leverage ownership of device or application logs to deliver fast, impression-level dashboards, winning progressive agency budgets.
Strategic alliances multiply. Paramount signed a multi-year deal to deploy Nielsen’s Advanced Audiences suite across broadcast, cable, and streaming properties, reinforcing currency acceptance while ensuring holistic reporting for advertisers.[3]Paramount, “Paramount and Nielsen Sign Deal,” paramount.comRoku, Google, and Amazon invest in patent portfolios spanning multi-match content identification and federated user-behaviour modelling, reinforcing technological moats. Mergers and minority stakes target complementary datasets or geography footprints, indicating a slow drift toward scale efficiencies.
White-space innovation centres on privacy-preserving measurement, attention scoring, and immersive-media analytics for volumetric experiences. Adeia extended licensing deals with LG and Vizio while litigating to defend intellectual property, emphasising the value of foundational patents ADEIA. Smaller specialists experiment with blockchain-based consent registries and synthetic-control methodologies that forecast outcomes where raw data is inaccessible. As advertisers demand verifiable outcomes, suppliers that integrate secure provenance trails and outcome-guaranteed contracts could leapfrog incumbents, energising future consolidation waves within the TV analytics market.
TV Analytics Industry Leaders
The Nielsen Company (US), LLC
Comscore, Inc.
Kantar Media Audiences Limited
Samba TV Inc.
iSpot.tv, Inc.
- *Disclaimer: Major Players sorted in no particular order

Recent Industry Developments
- February 2025: Paramount Global and Nielsen signed a multi-year measurement agreement covering broadcast, cable, and streaming properties, including Advanced Audiences and Ad-Supported Streaming Platform Ratings.
- January 2025: Comcast announced Q4 2024 revenue of USD 31.9 billion, noting 46% growth at Peacock and new NBA and WNBA rights.
- November 2024: Xperi expanded TiVo OS to 2 million active smart-TVs and guided FY 2024 revenue at USD 490–505 million.
- November 2024: Adeia posted USD 86.1 million Q3 2024 revenue, renewing patent licences with LG and Vizio while pursuing litigation against Disney.
- November 2024: The Media Rating Council approved first-party live-streaming data integration into Nielsen’s national panel at the person level.


Global TV Analytics Market Report Scope
| Software |
| Services |
| On-Premises |
| Cloud |
| Content Development and Programming |
| Audience Measurement and Forecasting |
| Advertising and Marketing |
| Competitive Intelligence |
| Churn and Customer-Lifetime Management |
| Recommendation and Personalization |
| Broadcasters and Networks |
| OTT / Streaming Service Providers |
| Advertisers and Media Agencies |
| Smart-TV OEMs |
| Telecom and Cable Operators |
| North America | United States | |
| Canada | ||
| Mexico | ||
| South America | Brazil | |
| Argentina | ||
| Rest of South America | ||
| Europe | Germany | |
| United Kingdom | ||
| France | ||
| Italy | ||
| Spain | ||
| Russia | ||
| Rest of Europe | ||
| Asia-Pacific | China | |
| Japan | ||
| South Korea | ||
| India | ||
| Australia and New Zealand | ||
| Rest of Asia-Pacific | ||
| Middle East and Africa | Middle East | Saudi Arabia |
| United Arab Emirates | ||
| Turkey | ||
| Rest of Middle East | ||
| Africa | South Africa | |
| Nigeria | ||
| Rest of Africa | ||
| By Component | Software | ||
| Services | |||
| By Deployment Mode | On-Premises | ||
| Cloud | |||
| By Application | Content Development and Programming | ||
| Audience Measurement and Forecasting | |||
| Advertising and Marketing | |||
| Competitive Intelligence | |||
| Churn and Customer-Lifetime Management | |||
| Recommendation and Personalization | |||
| By End User | Broadcasters and Networks | ||
| OTT / Streaming Service Providers | |||
| Advertisers and Media Agencies | |||
| Smart-TV OEMs | |||
| Telecom and Cable Operators | |||
| By Geography | North America | United States | |
| Canada | |||
| Mexico | |||
| South America | Brazil | ||
| Argentina | |||
| Rest of South America | |||
| Europe | Germany | ||
| United Kingdom | |||
| France | |||
| Italy | |||
| Spain | |||
| Russia | |||
| Rest of Europe | |||
| Asia-Pacific | China | ||
| Japan | |||
| South Korea | |||
| India | |||
| Australia and New Zealand | |||
| Rest of Asia-Pacific | |||
| Middle East and Africa | Middle East | Saudi Arabia | |
| United Arab Emirates | |||
| Turkey | |||
| Rest of Middle East | |||
| Africa | South Africa | ||
| Nigeria | |||
| Rest of Africa | |||


Key Questions Answered in the Report
How fast is the TV analytics market growing?
The TV analytics market is expanding at a 25.21% CAGR from 2025 to 2030, lifting value from USD 3.59 billion to USD 12.19 billion.
Which segment is the largest revenue contributor?
Advertising and marketing solutions led with 41.50% of 2024 revenue, reflecting advertisers’ demand for campaign optimisation metrics.
Why are smart-TV manufacturers entering analytics?
OEMs pursue recurring data-monetisation and advertising revenue, growing at 26.10% CAGR as they leverage automatic content recognition telemetry.
What is the primary geographic growth engine?
Asia Pacific registers the fastest 14.80% CAGR owing to rising smart-TV penetration and multilingual OTT expansion.
How do privacy rules influence analytics providers?
GDPR, CCPA 2.0, and similar laws force adoption of privacy-preserving techniques such as federated learning, increasing compliance costs but boosting consumer trust.
Are cloud deployments overtaking on-premises setups?
Yes, cloud solutions held 63% share in 2024 and grow at 23.80% CAGR, driven by elastic scaling and integrated AI accelerators.
Page last updated on:


