Bottled Water Processing Equipment Market Size and Share
Market Overview
| Study Period | 2021 - 2031 |
|---|---|
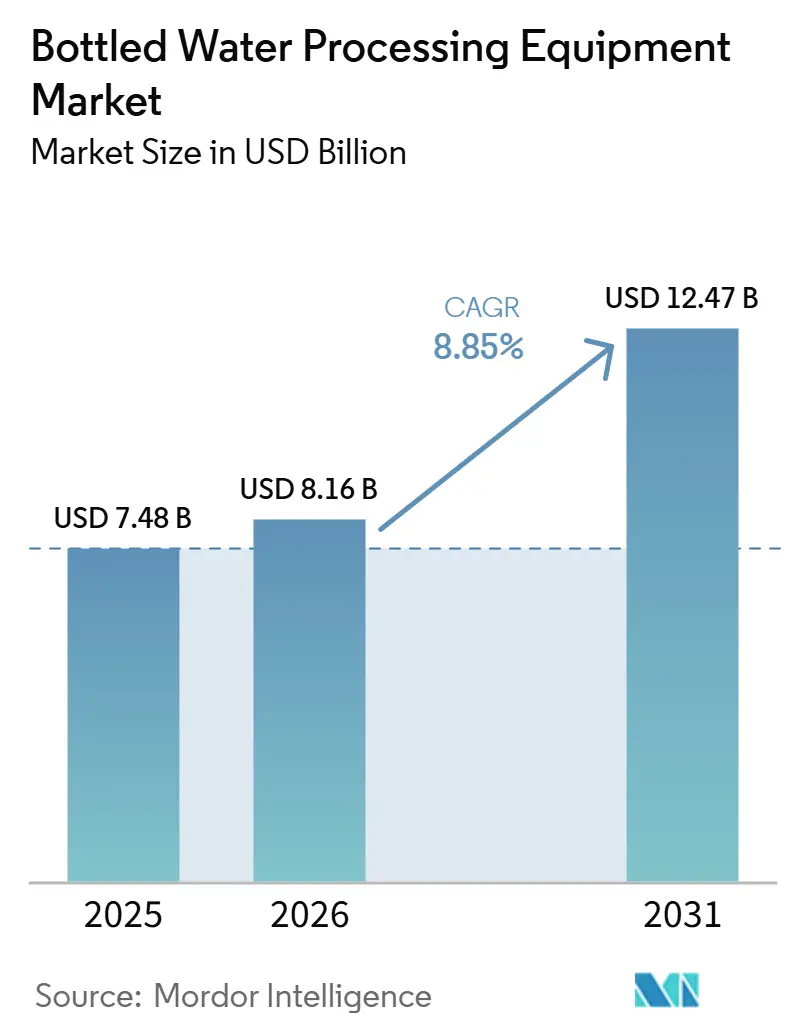
| Market Size (2026) | USD 8.16 Billion |
| Market Size (2031) | USD 12.47 Billion |
| Growth Rate (2026 - 2031) | 8.85% CAGR |
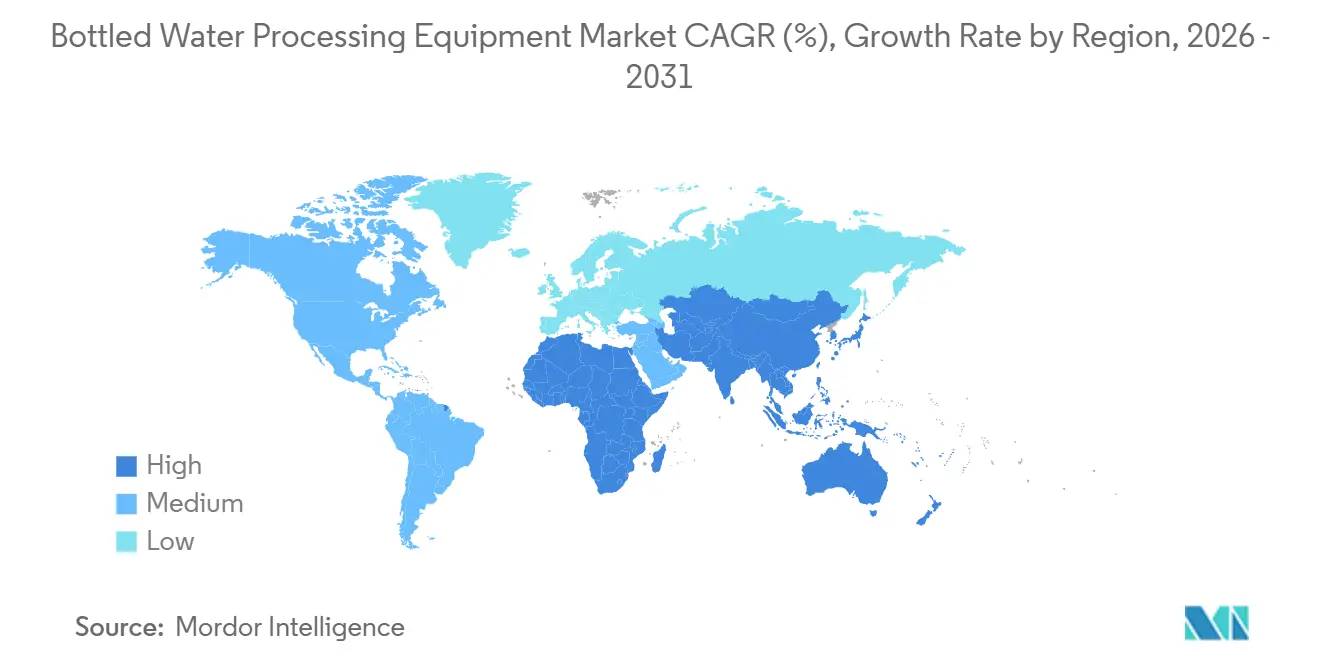
| Fastest Growing Market | South America |
| Largest Market | Asia Pacific |
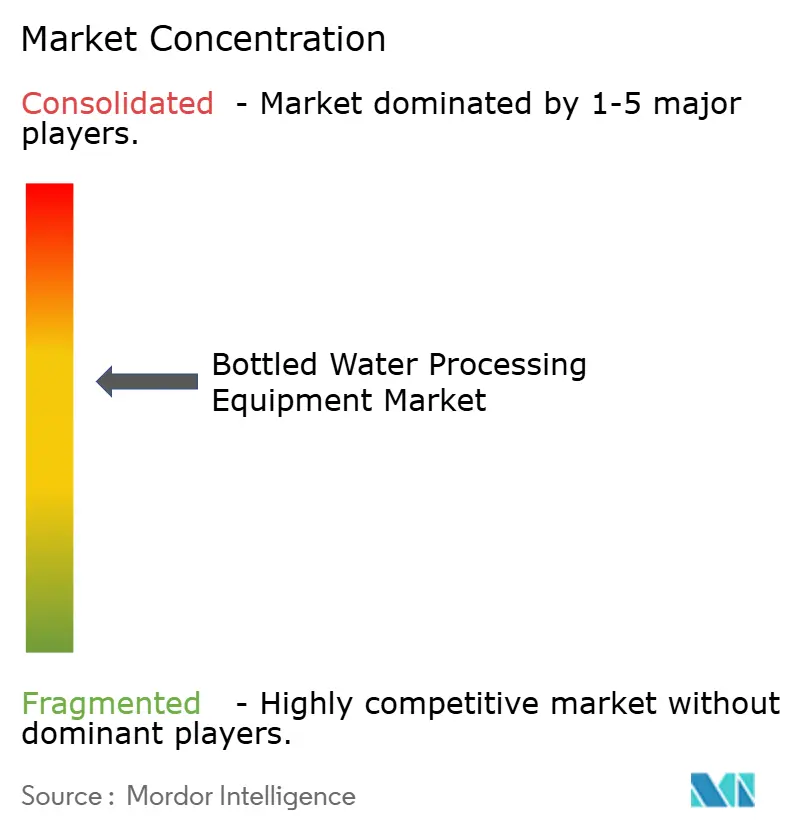
| Market Concentration | Medium |
Major Players
*Disclaimer: Major Players sorted in no particular order Image © Mordor Intelligence. Reuse requires attribution under CC BY 4.0. |
|
Bottled Water Processing Equipment Market Analysis by Mordor Intelligence
The Bottled Water Processing Equipment Market size is projected to be USD 7.48 billion in 2025, USD 8.16 billion in 2026, and reach USD 12.47 billion by 2031, growing at a CAGR of 8.85% from 2026 to 2031. A significant transition is underway, with investments shifting from manual batch operations to integrated, sensor-rich lines. These advanced systems support recycled PET, comply with stricter contaminant thresholds, and increase output without a proportional rise in labor. In 2025, filters and membrane systems accounted for 32.03% of the revenue base. However, blow molders are expected to grow the fastest, with a projected 9.23% CAGR. This growth is fueled by lightweighting requirements and the adoption of on-site bottle production, which eliminates preform logistics. While still water represented 57.45% of 2025 volumes, functional or fortified variants are gaining traction, growing at a 9.17% CAGR. This trend is driven by health-conscious consumers willing to pay more for electrolyte or vitamin-enriched options, boosting demand for aseptic filling and inline homogenization. In 2025, mid-capacity plants processing 10,000-30,000 bottles per hour constituted 45.27% of installations. However, mega facilities with capacities exceeding 30,000 BPH are growing at a strong 9.45% CAGR. These larger, highly automated sites are increasingly capable of absorbing the capital costs associated with multi-barrier purification and real-time quality analytics.
Key Report Takeaways
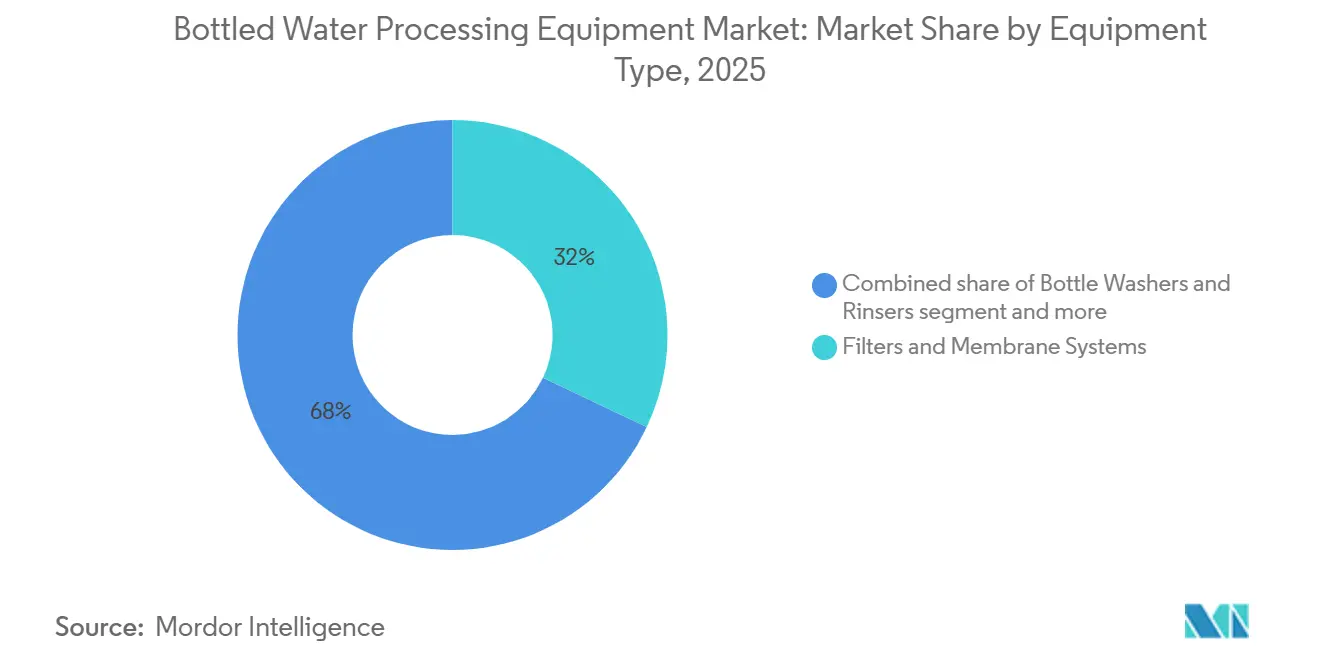
- By equipment type, filters and membrane systems held 32.03% of the bottled water processing equipment market share in 2025, while blow molders are forecast to grow at a 9.23% CAGR through 2031.
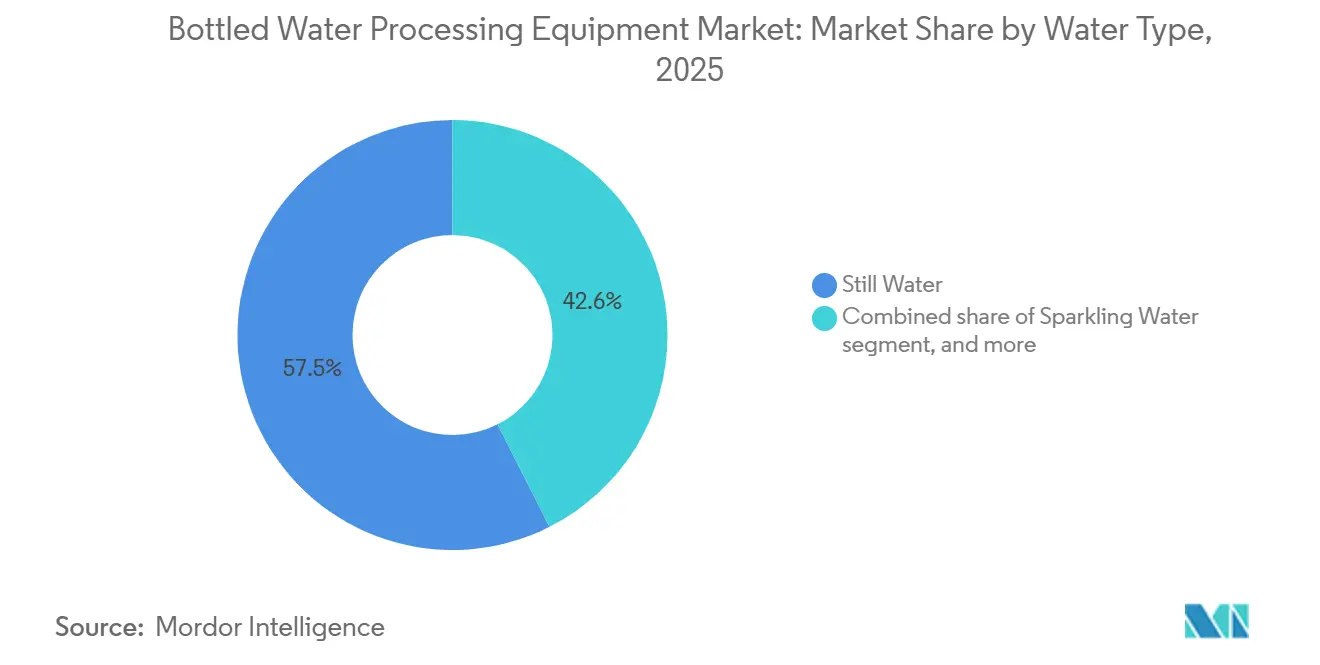
- By water type, still water led volumes with 57.45% in 2025; functional or fortified water is projected to register the highest 9.17% CAGR between 2026 and 2031.
- By plant capacity, installations of 10,000-30,000 BPH captured 45.27% of the bottled water processing equipment market size in 2025, whereas facilities exceeding 30,000 BPH are expanding at a 9.45% CAGR through 2031.
- By geography, Asia-Pacific generated 37.58% of 2025 equipment revenue; South America is the fastest-growing region at 9.35% CAGR through 2031
Note: Market size and forecast figures in this report are generated using Mordor Intelligence’s proprietary estimation framework, updated with the latest available data and insights as of January 2026.
Global Bottled Water Processing Equipment Market Trends and Insights
Drivers Impact Analysis*
| Driver | (~) % Impact on CAGR Forecast | Geographic Relevance | Impact Timeline |
|---|---|---|---|
| Rising consumer shift toward still and functional bottled water | +1.8% | Global, with strongest growth in North America and Europe for functional variants | Medium term (2-4 years) |
| Stringent potable-water regulations mandating advanced filtration | +1.5% | North America and EU core, expanding to Asia-Pacific urban centers | Long term (≥ 4 years) |
| Replacement cycle of membrane modules in Asia's mega plants | +1.2% | Asia-Pacific core, particularly China, India, Southeast Asia | Short term (≤ 2 years) |
| Shift to aseptic blow-fill-cap lines in emerging markets | +1.4% | South America, Middle East, Africa, with pilot adoption in rural Asia-Pacific | Medium term (2-4 years) |
| IoT-enabled predictive maintenance lowering OPEX | +1.3% | Global, led by North America and Europe, scaling in Asia-Pacific | Medium term (2-4 years) |
| On-site recycled PET mandates boosting in-line bottle makers | +1.6% | North America (California, New York) and EU, with spillover to South America | Long term (≥ 4 years) |
| Source: Mordor Intelligence | |||
Rising consumer shift toward still and functional bottled water
In 2025, still water's 57.45% market share highlights a significant trend: while plain hydration competes on price and convenience, premium functional variants infused with vitamins, electrolytes, or botanicals appeal to wellness-conscious consumers. Forecasted to grow at a 9.17% CAGR through 2031, the Functional/Fortified Water segment is expanding faster than the overall market. This growth stems from brands differentiating themselves in a commoditized category, enabling them to capture margins that offset rising PET costs. Achieving this differentiation requires inline homogenizers and ultra-high-temperature flash pasteurizers to stabilize heat-sensitive nutrients without compromising flavor. Alfa Laval's EnSaLine platform, introduced in 2025, features real-time viscosity and pH sensors, reducing batch rejection rates from 8% to below 2% during pilot trials by ensuring uniform electrolyte dispersion. While sparkling and flavored waters hold smaller market shares, they add complexity with the need for CO₂ injection modules and flavor-dosing skids. For bottlers targeting premium segments, the requirement is clear: invest in flexible filling heads. These systems, capable of efficiently switching between still, sparkling, and fortified formats without extended changeovers, are integral to Sidel and Krones' latest Combi systems. With increasing concerns over water contamination, consumers are turning to bottled water. In 2024, UNICEF reported that over 50% of the global population lacked access to safely managed drinking water[1]Source: UNICEF, "Household Survey Data:, unicef.org.
Stringent potable-water regulations mandating advanced filtration
In April 2024, the EPA issued a final rule on PFAS, establishing maximum contaminant levels of 4 parts per trillion for PFOA and PFOS. This regulation requires municipal suppliers and bottlers to implement either granular activated carbon or reverse osmosis systems. Public water systems have until 2029 to comply, but bottlers face immediate brand risks if third-party tests identify exceedances, as happened with several regional labels in 2025. While reverse osmosis effectively removes PFAS, it also eliminates beneficial minerals, necessitating additional remineralization stages that increase both the system's footprint and energy consumption. In 2025, DuPont introduced its IntegraTec XTP 100 IG ultrafiltration modules, which provide a 30% higher flux compared to earlier models. This innovation reduces the required membrane area and housing size without affecting throughput. At the same time, the European Union is drafting comparable PFAS regulations under a revision of the Drinking Water Directive. Member states are expected to adopt these rules by 2027, potentially aligning the replacement cycle for filtration assets across North America and Europe. This regulatory environment poses a challenge for smaller bottlers in Tier-2 markets: they must choose between investing in multi-barrier systems or exiting the market, which would consolidate their volume into larger players with the financial capacity to absorb the capital costs.
Replacement cycle of membrane modules in Asia's mega plants
Membranes used with brackish or municipal feedwater generally require replacement every 24 to 36 months due to fouling that reduces flux. In the region, the largest facilities, which process 50,000 to 80,000 bottles per hour, consume hundreds of membrane elements per site. Nongfu Spring's USD 700 million mega factory in China, commissioned in 2025, includes automated membrane integrity testing and chemical-enhanced backwash protocols that extend element life by 15 to 20%. This approach delays replacement costs but binds the operator to a specific OEM's consumables. In 2025, India's SLMG Beverages announced a USD 1 billion expansion plan to increase capacity from 22,000 to 27,000 bottles per minute across multiple lines, each requiring dedicated pre-filtration and RO trains. This predictable replacement cycle creates a profitable opportunity for membrane suppliers like Pentair, Pall, and DuPont. These suppliers typically bundle multi-year service agreements with initial equipment sales, ensuring consistent revenue even during periods of reduced new plant construction.
Shift to aseptic blow-fill-cap lines in emerging markets
Aseptic processing, a technique adopted from the dairy and juice sectors, involves sterilizing bottles, caps, and products separately before filling them in a sterile zone, thereby eliminating the need for refrigerated distribution. Coca-Cola Andina's implementation of aseptic blow-fill-cap lines across Chile, Argentina, and Paraguay has driven South America's 9.35% CAGR. These lines leverage ambient logistics to reduce cold-chain costs by 30 to 40%. Introduced in 2024, Sidel's Aseptic Combi Predis combines blow molding, hydrogen peroxide vapor sterilization, and filling within a single footprint, cutting floor space requirements by 25% compared to modular setups. In the Middle East and Africa, where summer temperatures exceed 45°C and refrigerated trucks are scarce outside major cities, similar systems are gaining traction. Although aseptic lines carry a 20 to 30% capital premium over hot-fill or cold-fill alternatives, emerging markets typically achieve payback periods of 3 to 4 years due to logistics savings and extended shelf life, which reduces spoilage. Additionally, the technology supports smaller pack sizes, 250 ml and 330 ml, that appeal to lower-income consumers. These sizes not only align with consumer preferences but also deliver higher per-liter margins, a key focus for multinational bottlers seeking volume growth in price-sensitive markets.
Restraints Impact Analysis*
| Restraint | (~) % Impact on CAGR Forecast | Geographic Relevance | Impact Timeline |
|---|---|---|---|
| High capex for multi-barrier systems | -1.1% | Global, with acute pressure on Tier-2 bottlers in Asia-Pacific and South America | Short term (≤ 2 years) |
| PFAS and micro-plastic compliance uncertainty | -0.9% | North America and EU, with emerging scrutiny in Asia-Pacific urban markets | Medium term (2-4 years) |
| Skilled-operator shortage in Tier-2 bottlers | -0.7% | Asia-Pacific, South America, Middle East, and rural North America | Long term (≥ 4 years) |
| Volatile PET resin prices pressuring margins | -1.0% | Global, with highest impact in regions dependent on imported feedstock | Short term (≤ 2 years) |
| Source: Mordor Intelligence | |||
High capex for multi-barrier systems
A turnkey line that includes ultrafiltration, reverse osmosis, ozonation, UV sterilization, blow molding, aseptic filling, and secondary packaging can cost over USD 15 million for a 30,000 BPH facility. This significant investment strains the balance sheets of regional bottlers in South America and Southeast Asia. Rising interest rates through 2024-2025 have tightened financing terms, extending payback periods from 5 to 7 years and discouraging speculative capacity expansions. Premium brands continue to invest in advanced lines, while Tier-2 bottlers often choose refurbished or modular systems that trade off automation and energy efficiency. This dynamic has created a two-tier market, where value players rely on aging assets to compete on price. The high capital requirements also favor contract manufacturers, who distribute equipment costs across multiple brands. This approach is gaining traction in India and Brazil, where local entrepreneurs lack the scale to support dedicated lines. In the beverage industry, leasing and equipment-as-a-service models remain underdeveloped compared to pharmaceuticals. However, companies like Krones and Sidel have piloted output-based pricing in select markets, charging per bottle produced instead of requiring upfront capital. This model aligns incentives but depends on reliable remote monitoring to validate throughput.
PFAS and micro-plastic compliance uncertainty
In April 2024, the EPA finalized PFAS limits, but detecting these substances at parts per trillion remains expensive—USD 300 to USD 500 per sample—and requires 2 to 3 weeks, delaying corrective actions. While there is no federal standard for micro-plastics in the U.S., California's Office of Environmental Health Hazard Assessment is preparing guidance expected by 2027. Additionally, in 2024, the European Food Safety Authority identified particles smaller than 10 microns as a potential concern. This inconsistent regulatory framework compels bottlers to make significant investments in filtration systems, such as 0.1-micron absolute cartridges or ceramic membranes, without assurance that future regulations will recognize these measures. Smaller operators, lacking in-house laboratories, face higher testing costs by depending on third-party labs, incurring annual compliance expenses of USD 10,000 to USD 20,000 per facility. Larger companies reduce risks by participating in industry groups like the International Bottled Water Association's PFAS working group, which supports method validation and advocates for risk-based thresholds instead of universal detection limits. However, the uncertain regulatory outcome could necessitate additional retrofits if standards become stricter.
*Our forecasts treat driver/restraint impacts as directional, not additive. The impact forecasts reflect baseline growth, mix effects, and variable interactions.
Segment Analysis
By Equipment Type: Membrane Systems Anchor the Installed Base, Blow Molders Drive Future Growth
In 2025, filters and membrane systems represented 32.03% of total revenues, emphasizing their critical role in removing suspended solids, microbes, and emerging contaminants. The market for bottled water processing equipment, specifically these units, reached USD 2.39 billion in 2025. North America and Europe led the market, with replacement contracts typically occurring every 24-36 months. DuPont’s IntegraTec XTP 100 IG delivers a 30% increase in flux, reducing the number of modules required and lowering energy consumption, which directly cuts costs for bottlers. Filling and capping machines remain central to production lines, supported by flow-meter systems that provide ±0.2% volume accuracy for still, sparkling, and fortified water formats.
Blow molders are expected to experience the highest growth, with a projected CAGR of 9.23%. This growth is driven by on-site bottle production, which complies with recycled-content regulations and reduces transport emissions. The market share for blow molding in bottled water processing equipment is anticipated to grow from 18% in 2025 to over 22% by 2031, as high-volume plants increasingly adopt integrated blow-fill-cap combinations. Sidel’s EvoBLOW Laser technology enables a 15% reduction in bottle weight while exclusively processing 100% recycled PET (rPET), resulting in material savings of 12-18 grams per bottle. Meanwhile, smaller bottlers face a strategic decision: invest in high-capex blow molders or pay a 10-15% premium on preforms, a challenge that could accelerate industry consolidation.


By Water Type: Still Water Leads, Functional Variants Accelerate
In 2025, still water accounted for 57.45% of the total bottled water volume. However, its value growth remained limited due to the commoditized nature of retail pricing in many regions, which kept profit margins constrained. High-speed rotary fillers, capable of operating at 1,500 bottles per minute (BPM), have significantly reduced labor costs, bringing them down to less than USD 0.002 per bottle. On the other hand, carbonated and flavored waters have introduced additional complexity to their production processes by integrating dosing skids and counter-pressure fillers into their base equipment, enhancing functionality but increasing operational intricacy.
Functional or fortified water is expected to lead the market with a strong 9.17% CAGR through 2031. This growth is anticipated to drive demand for aseptic fillers, inline homogenizers, and precision dosing pumps in the bottled water processing equipment market. Alfa Laval’s EnSaLine, by live-tracking viscosity and pH, has successfully lowered batch rejection rates to below 2% in pilot plants. This highlights the role of sensors in reducing costs for premium SKUs. While regulatory scrutiny on health claims poses a compliance challenge, it also encourages traceability improvements that enhance overall quality programs. Reflecting a shift in consumer preferences, a report from the International Food Information Council revealed that in 2025, 13% of U.S. consumers followed clean diets, emphasizing a growing focus on health and clean food and beverages[2]Source: International Food Information Council, "Food & Health Survey", ific.org.
By Plant Capacity: Mid-Scale Lines Dominate Counts, Mega Sites Optimize Unit Costs
In 2025, installations within the 10,000-30,000 BPH range constituted 45.27% of all projects, offering an optimal balance between capital expenditure, labor requirements, and geographic adaptability. The adoption of standardized packages, such as the Contiform series by Krones and the SBO series by Sidel, has significantly streamlined operations. These packages not only reduce lead times to a manageable 12-18 months but also help companies maintain a lean inventory of spare parts, enhancing operational efficiency.
Meanwhile, facilities with capacities exceeding 30,000 BPH are expanding at a compound annual growth rate (CAGR) of 9.45%, primarily due to multinational bottlers consolidating production into fewer, larger hubs. For instance, Nongfu Spring’s 80,000 BPH plant employs advanced technologies like automated membrane testing and predictive maintenance, resulting in a 20-30% reduction in energy consumption per liter. Additionally, labor productivity has significantly improved as centralized control systems enable a single technician to oversee multiple production lines. However, this centralized approach introduces a higher level of systemic risk, as any downtime or quality recall at one hub could have widespread operational implications.
Geography Analysis
In 2025, Asia-Pacific contributed 37.58% of global equipment revenue, primarily driven by large-scale projects in China and India, as well as the routine replacement of membranes necessitated by brackish-water fouling cycles. A notable example is Nongfu Spring's new USD 700 million facility, which demonstrates the integration of advanced controls and consumables designed to maximize OEM lifetime value. Additionally, Southeast Asia expanded its capacity by over 15,000 BPH in 2025 by upgrading production lines that were over a decade old. These upgrades included the implementation of energy-efficient drives and sophisticated sensor systems. Meanwhile, Japan and South Korea have focused on achieving recycled-content targets by deploying specialized systems tailored for 250 ml and 330 ml bottles, which cater specifically to the needs of single-person households. The region's urbanization trends, combined with ongoing concerns about municipal water quality in developing markets, have significantly increased bottled water consumption. For instance, the World Bank reported that in 2024, 64% of the population in East Asia and the Pacific lived in urban areas, highlighting the growing demand for reliable water sources[3]Source: World Bank, "Urban Population." worldbank.org.
South America is projected to be the fastest-growing region, with a robust CAGR of 9.35% anticipated through 2031. Significant investments, such as Coca-Cola Andina's USD 500 million expenditure and Coca-Cola Femsa's BRL 380 million Crystal plant, underscore the region's shift toward advanced production technologies. These aseptic blow-fill-cap lines address cold-chain challenges while ensuring compliance with recycled-content regulations. However, currency fluctuations have complicated the costs of importing resin and machinery, prompting bottlers to increasingly rely on locally sourced rPET and modular equipment. This shift allows for greater scalability and adaptability to meet fluctuating demand.
North America and Europe, as mature markets, experience demand primarily driven by replacement needs, regulatory compliance, and sustainability initiatives. The EPA's PFAS rule has accelerated retrofits of granular activated carbon and reverse osmosis (RO) trains, with retrofit activity expected to peak between 2027 and 2028. Furthermore, legislative measures such as California's SB 54 and the EU directive are driving the adoption of integrated blow-molders and investments in optical sorting technologies. In the Middle East and Africa, the selective installation of aseptic systems is helping to bypass the need for refrigerated logistics. However, despite clear concerns over access to potable water, political instability and currency risks have hindered market penetration in countries like Nigeria and Egypt.

Competitive Landscape
The bottled water processing equipment market is moderately fragmented, primarily due to varying technological requirements and regional preferences. These factors collectively prevent any single company from dominating the market landscape. To stand out, market players are increasingly prioritizing technological innovation over traditional scale advantages. A notable example is Sidel, which has drawn on over 40 years of expertise in PET container manufacturing to introduce its Eco-Audit services. This initiative is designed to improve environmental performance, with the potential to achieve CO2 savings of up to 157 tonnes per facility, showcasing Sidel's commitment to sustainability and operational efficiency.
Manufacturers of bottled water processing equipment are shifting their competitive strategies from focusing solely on initial capital costs to emphasizing the total cost of ownership. This strategic shift integrates key elements such as predictive maintenance, energy efficiency, and sustainability into their offerings, providing long-term value to customers. Reflecting the ongoing trend of consolidation among technology providers, Veolia has acquired full ownership of Water Technologies and Solutions by purchasing CDPQ's 30% stake. Additionally, there is a growing opportunity in the development of integrated IoT-enabled systems. These advanced systems combine various treatment technologies with predictive analytics, enabling optimized operations and improved decision-making processes.
DuPont Water Solutions exemplifies this digital transformation with its WAVE PRO ultrafiltration modeling tool, which highlights the competitive advantage of integrating software with hardware. Patent activity in the market is also gaining momentum, particularly in areas such as sustainable packaging technologies and advanced membrane materials. For instance, European Patent EP4168900A1, as highlighted by Google Patents, explores compositions for supplementing products with therapeutic agents and emphasizes sterilization techniques like ozonation and UV treatment. The convergence of technology is creating opportunities for smaller players to enter the market. These agile companies have the potential to disrupt established relationships by offering innovative solutions that address new regulatory requirements and sustainability objectives, thereby reshaping the competitive landscape.
Bottled Water Processing Equipment Industry Leaders
-
Sidel
-
Krones AG
-
GEA Group
-
Tetra Laval
-
Veolia Water Technologies
- *Disclaimer: Major Players sorted in no particular order

Recent Industry Developments
- April 2025: Coca-Cola FEMSA completed seven new bottling lines, a 3.5% boost in capacity, and opened four distribution centers, while launching PLANETA PET-recycling in Mexico.
- March 2025: DuPont Water Solutions released WAVE PRO, an online ultrafiltration modeling platform aimed at cost and chemical savings.
- March 2025: Krones brought Belgium’s first PET-bottle recycling plant online, processing 40,000 tons a year into food-grade rPET.
- November 2024: Primo Water and BlueTriton closed a merger forming a USD 6.5 billion healthy-hydration company.


Global Bottled Water Processing Equipment Market Report Scope
Bottled water processing equipment refers to an automated, integrated system of machinery designed to treat raw water, fill it into containers, and package it while maintaining hygiene standards. The bottled water processing equipment report is segmented by equipment type, water type, plant capacity, and geography. By equipment type, the market is segmented into filters and membrane systems, bottle washers and rinsers, blow molders, filling and capping machines, labelers and shrink wrappers, and others. By water type, the market is segmented into still water, sparkling water, functional/fortified water, and flavored water. By plant capacity, the market is segmented into <10,000 BPH, 10,000–30,000 BPH, and >30,000 BPH. By geography, the market is segmented into North America, South America, Europe, Asia-Pacific, the Middle East and Africa. For each segment, the market forecasts are provided in terms of value (USD) and volume (units).
| Filters and Membrane Systems |
| Bottle Washers and Rinsers |
| Blow Molders |
| Filling and Capping Machines |
| Labelers and Shrink Wrappers |
| Others |
| Still Water |
| Sparkling Water |
| Functional/Fortified Water |
| Flavored Water |
| <10,000 BPH |
| 10,000-30,000 BPH |
| >30,000 BPH |
| North America | United States |
| Canada | |
| Mexico | |
| Rest of North America | |
| South America | Brazil |
| Argentina | |
| Colombia | |
| Chile | |
| Rest of South America | |
| Europe | United Kingdom |
| Germany | |
| France | |
| Italy | |
| Spain | |
| Russia | |
| Sweden | |
| Belgium | |
| Poland | |
| Netherlands | |
| Rest of Europe | |
| Asia-Pacific | China |
| Japan | |
| India | |
| Thailand | |
| Singapore | |
| Indonesia | |
| South Korea | |
| Australia | |
| New Zealand | |
| Rest of Asia-Pacific | |
| Middle East and Africa | United Arab Emirates |
| South Africa | |
| Saudi Arabia | |
| Nigeria | |
| Egypt | |
| Morocco | |
| Turkey | |
| Rest of Middle East and Africa |
| By Equipment Type | Filters and Membrane Systems | |
| Bottle Washers and Rinsers | ||
| Blow Molders | ||
| Filling and Capping Machines | ||
| Labelers and Shrink Wrappers | ||
| Others | ||
| By Water Type | Still Water | |
| Sparkling Water | ||
| Functional/Fortified Water | ||
| Flavored Water | ||
| By Plant Capacity | <10,000 BPH | |
| 10,000-30,000 BPH | ||
| >30,000 BPH | ||
| By Geography | North America | United States |
| Canada | ||
| Mexico | ||
| Rest of North America | ||
| South America | Brazil | |
| Argentina | ||
| Colombia | ||
| Chile | ||
| Rest of South America | ||
| Europe | United Kingdom | |
| Germany | ||
| France | ||
| Italy | ||
| Spain | ||
| Russia | ||
| Sweden | ||
| Belgium | ||
| Poland | ||
| Netherlands | ||
| Rest of Europe | ||
| Asia-Pacific | China | |
| Japan | ||
| India | ||
| Thailand | ||
| Singapore | ||
| Indonesia | ||
| South Korea | ||
| Australia | ||
| New Zealand | ||
| Rest of Asia-Pacific | ||
| Middle East and Africa | United Arab Emirates | |
| South Africa | ||
| Saudi Arabia | ||
| Nigeria | ||
| Egypt | ||
| Morocco | ||
| Turkey | ||
| Rest of Middle East and Africa | ||


Key Questions Answered in the Report
What is the current size of the bottled water processing equipment market?
It reached USD 8.16 billion in 2026 and is projected to hit USD 12.47 billion by 2031.
Which equipment segment is growing the fastest?
Blow molders are set to expand at 9.23% CAGR through 2031 thanks to recycled-content mandates and on-site bottle production.
Why are functional waters influencing equipment demand?
Formulations with electrolytes and vitamins need aseptic fillers and inline homogenizers, elevating capex but enabling higher retail margins.
How will PFAS regulations affect bottlers?
The EPA’s 4 ppt limit compels adoption of granular activated carbon or reverse osmosis, triggering a retrofit wave peaking in 2027-2028.
Page last updated on:


