Water Softener Market Size and Share
Market Overview
| Study Period | 2020 - 2030 |
|---|---|
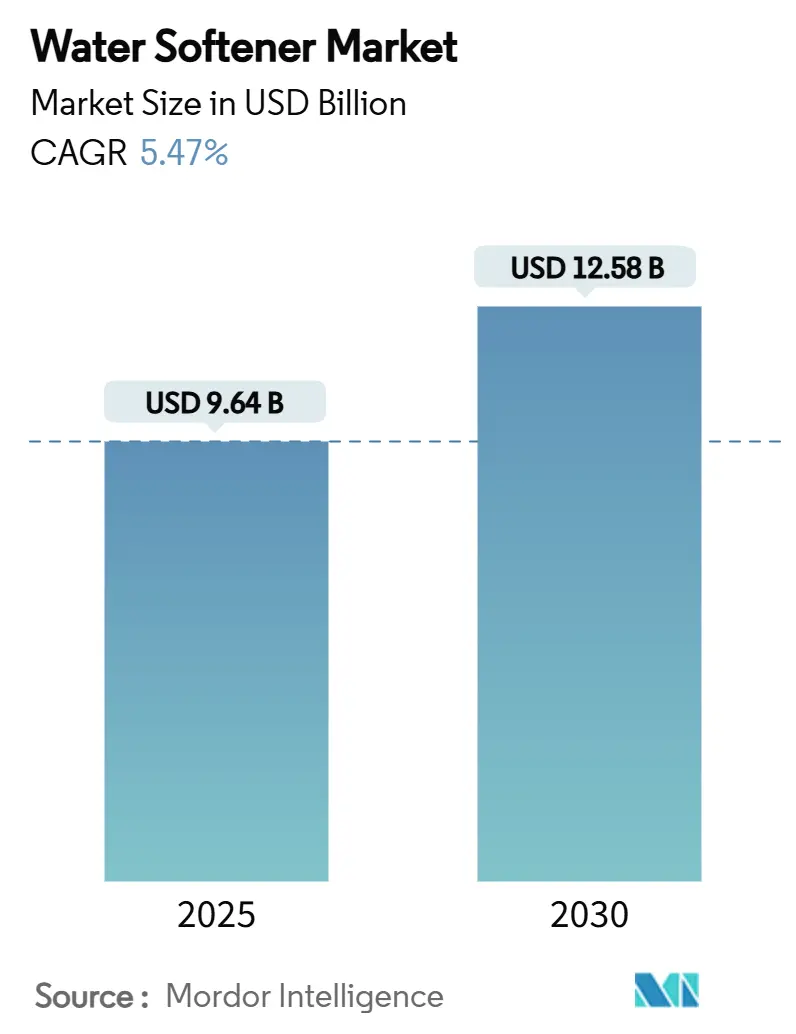
| Market Size (2025) | USD 9.64 Billion |
| Market Size (2030) | USD 12.58 Billion |
| Growth Rate (2025 - 2030) | 5.47% CAGR |
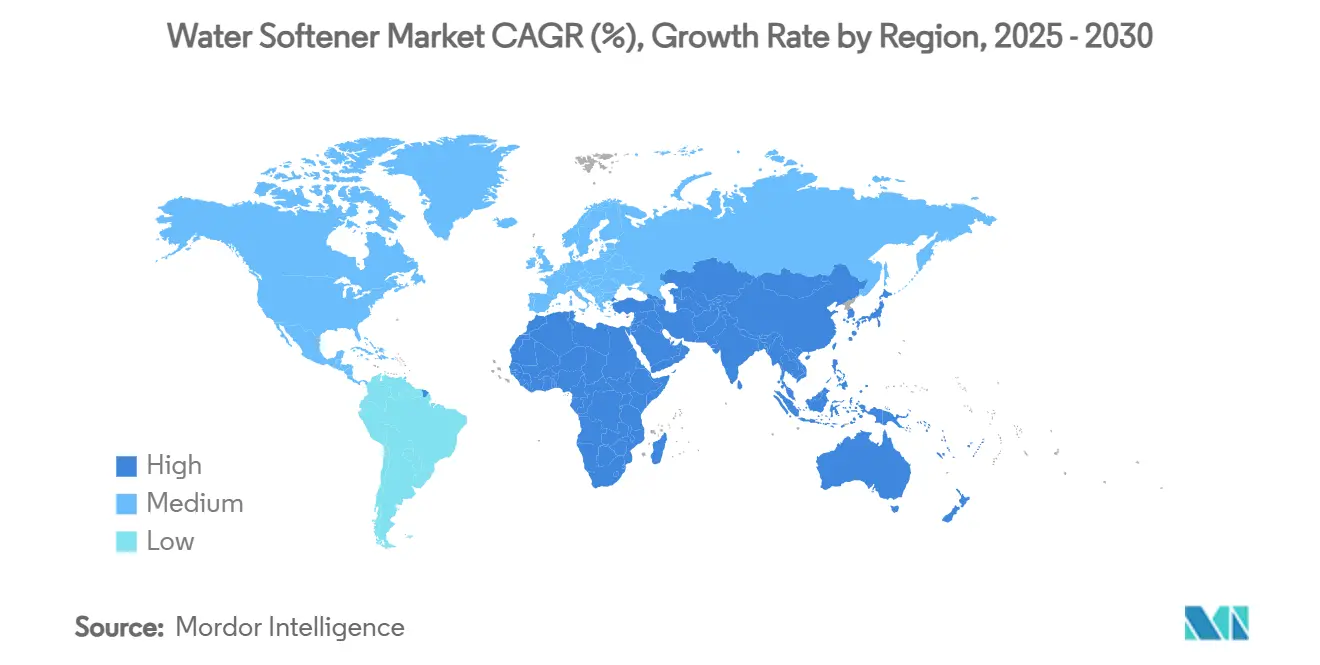
| Fastest Growing Market | Asia Pacific |
| Largest Market | North America |
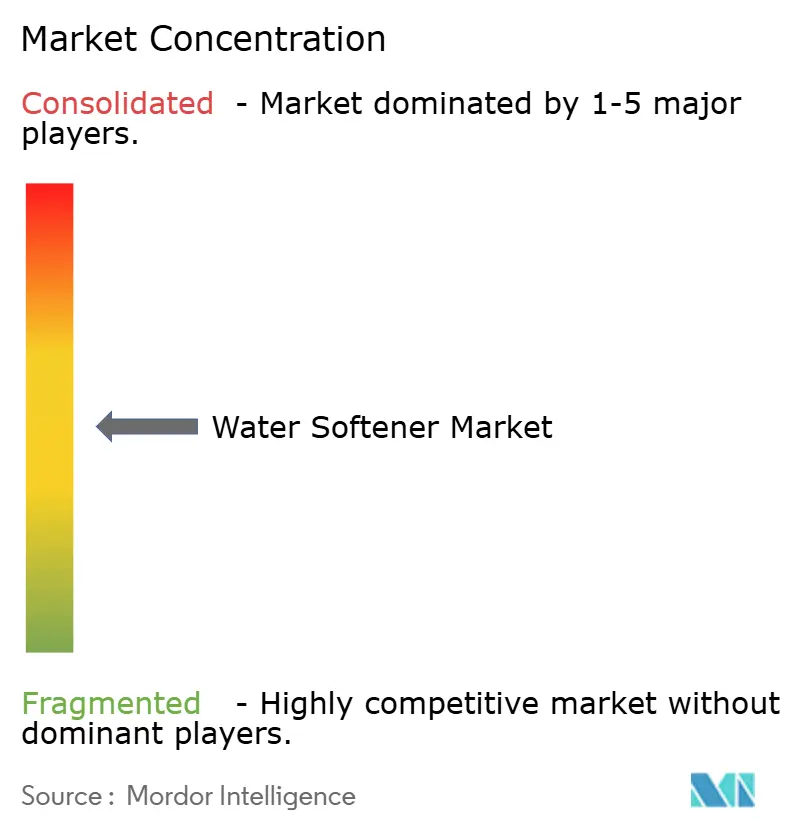
| Market Concentration | Medium |
Major Players
*Disclaimer: Major Players sorted in no particular order Image © Mordor Intelligence. Reuse requires attribution under CC BY 4.0. |
|
Water Softener Market Analysis by Mordor Intelligence
The water softener market size stood at USD 9.64 billion in 2025 and is forecast to reach USD 12.58 billion by 2030, advancing at a 5.47% CAGR during the period. Hard-water prevalence, ongoing renovation activities, and the rise of smart-home adoption are driving heightened expectations for product functionality. These factors are encouraging consumers to seek advanced water softening solutions that align with modern needs. In response to environmental regulations, there's a noticeable shift towards salt-free and hybrid technologies. These innovations not only curtail brine discharge but also maintain effective mineral-scale control, addressing both ecological concerns and performance requirements. Manufacturers are making strategic acquisitions, expanding their geographic footprint and enhancing digital capabilities to stay competitive. This evolution has transformed predictive maintenance into a significant competitive edge, enabling proactive issue resolution and improved customer satisfaction. On another front, the surge of direct-to-consumer ecommerce channels is boosting brand visibility, allowing companies to directly engage with consumers. This trend is paving the way for niche players to challenge established giants in the water softener market by leveraging innovative marketing strategies and unique product offerings.
Key Report Takeaways
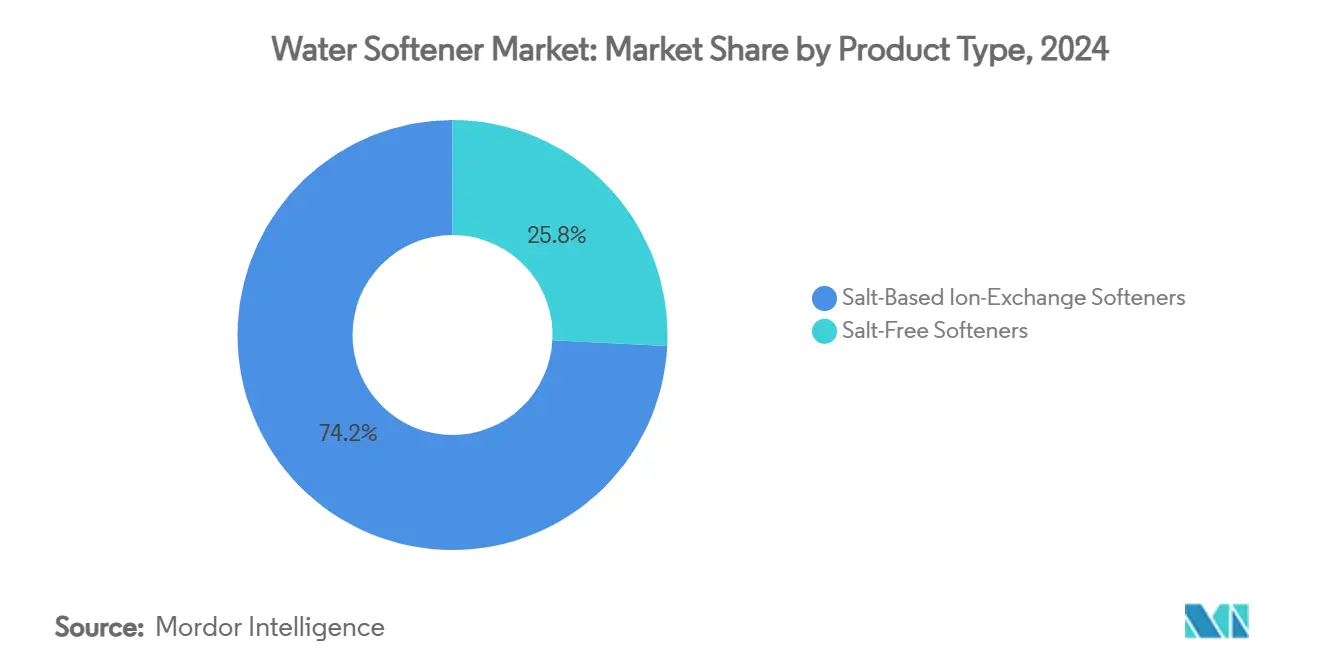
- By product type, salt-based ion-exchange systems accounted for 74.18% of the water softener market share in 2024, while salt-free softeners are projected to post a 5.77% CAGR through 2030.
- By process, ion exchange led with 41.17% of the water softener market size in 2024; reverse osmosis is forecast to expand at a 6.27% CAGR between 2025-2030.
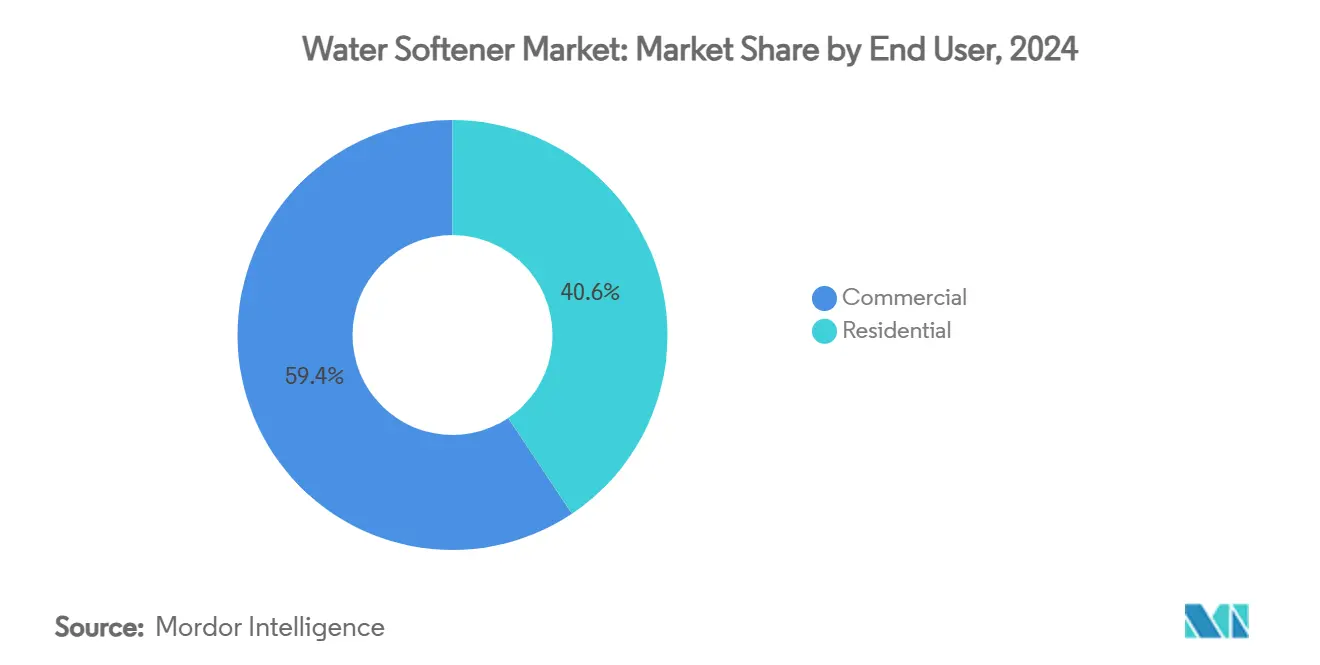
- By end user, commercial installations held 59.39% revenue share of the water softener market in 2024, whereas residential demand is advancing at a 5.93% CAGR to 2030
- By distribution channel, offline sales commanded 65.35% share of the water softener market in 2024; online channels are expected to rise at a 6.17% CAGR over the forecast period.
- By geography, North America captured 39.17% of the water softener market in 2024, with Asia-Pacific positioned to record a 5.85% CAGR by 2030.
Global Water Softener Market Trends and Insights
Drivers Impact Analysis*
| Driver | (~) % Impact on CAGR Forecast | Geographic Relevance | Impact Timeline |
|---|---|---|---|
| Hard-water prevalence in municipal supplies | +1.2% | Global; US Midwest and West, Asia-pacific metros | Long term (≥ 4 years) |
| Increasing residential renovation and smart-home adoption | +0.9% | North America and EU core; Asia-pacific emerging | Medium term (2-4 years) |
| Stringent industrial discharge regulations | +0.8% | Global; California, Texas leadership | Short term (≤ 2 years) |
| Shift toward salt-free template-assisted crystallization | +0.6% | North America and EU; spill-over to Asia-pacific | Medium term (2-4 years) |
| Growth of IoT-enabled predictive-maintenance softeners | +0.5% | North America, Western Europe, select Asia-pacific | Medium term (2-4 years) |
| Brine-recycling mandates in key U.S. counties | +0.3% | United States; California, Michigan, Texas | Short term (≤ 2 years) |
| Source: Mordor Intelligence | |||
Hard-water prevalence in municipal supplies
Across vast regions of the Midwest and West, the United States grapples with hard water, registering over 180 mg/L due to extensive geological deposits of calcium and magnesium[1]Source: United States Geological Survey, "Do you have information about water hardness in the United States?", www.usgs.gov. This persistent challenge fuels a steady demand for water softening systems, as hard water negatively impacts household appliances, plumbing systems, and overall water quality. Meanwhile, in the Asia-Pacific, rural areas of China are witnessing similar mineral concentrations. This has been linked to a surge in kidney stone cases, prompting both municipal upgrades and increased household adoption of softening systems to address health concerns and improve water usability. Industrial users, facing challenges from scale buildup that diminishes heat-exchange efficiency and hastens equipment wear, are amplifying their consumption of water softeners to maintain operational efficiency and reduce maintenance costs. In a bid to combat pipe scaling, utilities are now co-funding point-of-entry systems, underscoring the role of public infrastructure programs in bolstering the long-term growth of the water softener market. These initiatives not only aim to enhance water distribution systems but also reduce the economic burden of scaling-related damages on public and private sectors.
Increasing residential renovation and smart-home adoption
In North America, as the housing stock ages, renovation budgets increasingly prioritize plumbing upgrades. These upgrades often feature high-efficiency softeners, now enhanced with leak detection, automated regeneration, and app-based salt-level alerts, which provide homeowners with greater convenience and control over water usage. These systems not only address the functional needs of aging infrastructure but also align with modern sustainability and efficiency standards. Federal tax incentives for energy-saving appliances are further influencing purchase decisions, driving demand for advanced systems that reduce brine usage while maintaining optimal performance[2]Source: United States Environmental Protection Agency, "Federal Tax Credits for Energy Efficiency", www.energystar.gov. This shift reflects a growing consumer preference for environmentally friendly and cost-effective solutions. Manufacturers like Fortune Brands Innovations, with a commitment to saving 1 trillion gallons of water by 2030, are at the forefront of this transformation. By integrating smart metering technologies, these companies are demonstrating how innovation can deliver dual benefits: environmental conservation and tangible consumer savings. These advancements not only enhance operational efficiency but also contribute to broader water conservation efforts, resonating with environmentally conscious consumers. As a result, the adoption of water softeners equipped with smart features is accelerating, further strengthening the growth trajectory of the water softener market.
Stringent industrial discharge regulations
California's move to empower local districts to ban salt-based devices discharging into sewers has resulted in the mandatory removal of over 8,000 residential units in Santa Clarita Valley. This has spurred an immediate demand for compliant alternatives, such as advanced water softening systems that meet regulatory standards. Data from the EPA indicates that industrial retrofits using brine-recycling loops can reduce sodium outflows by 89%. These retrofits not only help achieve compliance but also present a significant opportunity for capital investment, as businesses and homeowners seek sustainable and efficient solutions. The removal of salt-based devices has also highlighted the need for innovation in water treatment technologies, driving manufacturers to develop systems that align with stricter environmental regulations. With similar ordinances emerging in Texas and Michigan, the regulatory landscape appears to be expanding, potentially accelerating upgrades throughout the water softener market. This trend underscores the growing importance of environmentally friendly technologies in addressing regulatory challenges, reducing environmental impact, and meeting consumer demand for sustainable water treatment options.
Shift toward salt-free template-assisted crystallization (TAC)
At Northern Arizona University, laboratory studies found that water passing through TAC cartridges experienced an 88% reduction in scale formation, outperforming both magnetic and electronic conditioners. This significant reduction underscores TAC's superior performance in mitigating scale buildup, a persistent challenge in water systems that can lead to inefficiencies and increased maintenance costs. While TAC selectively removes a limited amount of calcium and magnesium ions, its brine-free nature provides a distinct advantage in markets grappling with discharge restrictions, where environmental compliance and sustainability are critical considerations. The WateReuse Research Foundation has further emphasized TAC's importance by highlighting its effectiveness in reducing total dissolved solids, which is essential for meeting water-reuse targets[3]Source: California Water Boards," Evaluation of Alternatives to Domestic Ion Exchange Water Softeners", waterboards.ca.gov. This is particularly relevant in water-stressed western states, where water conservation and reuse are top priorities due to ongoing drought conditions and resource scarcity. Consequently, producers are marketing TAC as a complementary solution that not only prevents scaling but also avoids breaching chloride caps, making it an environmentally friendly option. This approach enables producers to expand their product portfolios within the water softener market, catering to the increasing demand for sustainable and efficient water treatment solutions.
Restraint Impact Analysis*
| Restraint | (~) % Impact on CAGR Forecast | Geographic Relevance | Impact Timeline |
|---|---|---|---|
| Regulatory pushback on sodium-laden brine discharge | -1.1% | California, Texas, Michigan; expanding U.S. states | Short term (≤ 2 years) |
| Rising popularity of whole-home RO systems | -0.7% | North America; Middle East high-TDS zones | Medium term (2-4 years) |
| Emerging bans on single-use sodium chloride bags | -0.4% | EU lead; North America follow | Medium term (2-4 years) |
| Lithium-based softening media cost volatility | -0.3% | Global; advanced technology adopters | Long term (≥ 4 years) |
| Source: Mordor Intelligence | |||
Regulatory pushback on sodium-laden brine discharge
In the Phoenix area, homes contribute approximately 68,000 tons of salt to municipal wastewater each year, as highlighted by the Central Arizona Salinity Study. This influx not only escalates treatment costs but also diminishes the potential for water reuse, posing significant challenges for municipal water management systems. In Texas, new statewide regulations mandate demand-initiated regeneration and flow-meter verification to improve efficiency and reduce environmental impact. As a result, many legacy units now face retrofits or outright replacements, creating additional costs for homeowners and driving demand for compliant systems. Meanwhile, Rhode Island has taken a unique approach: brine disposal into drywells. While this method aims to safeguard aquifers by preventing contamination, it also leads to heightened installation costs, making it less appealing for budget-conscious homeowners. Together, these regulations are not just limiting traditional systems but are also paving the way for innovations in the expansive water softener market, encouraging manufacturers to develop more sustainable and cost-effective solutions.
Rising popularity of whole-home RO systems
In response to the EPA's enforceable PFAS limits, households are increasingly turning to multi-contaminant solutions. Research from Jeddah highlights that 62% of consumers prefer reverse osmosis units that can eliminate trace organics in addition to hardness minerals. This preference is driven by the rising awareness of water contamination issues and the demand for systems that address multiple water quality concerns. Whole-home RO systems, which offer both softening and purification in one unit, are becoming a popular choice due to their convenience and efficiency. These systems not only simplify water treatment but also reduce the need for separate equipment. As a result, many buyers are opting to forgo dedicated softeners, as whole-home RO systems effectively fulfill both softening and purification requirements. This shift in consumer behavior is suppressing volume growth in specific segments of the water softener market, particularly those focused solely on hardness removal, thereby impacting the overall market dynamics.
*Our forecasts treat driver/restraint impacts as directional, not additive. The impact forecasts reflect baseline growth, mix effects, and variable interactions.
Segment Analysis
By Product Type: Environmental Scrutiny Spurs Salt-Free Uptake
In 2024, salt-based water softener systems maintained their dominant position in the market, commanding a significant 74.18% share. This stronghold is largely attributed to the reliability of ion-exchange technology, which effectively eliminates water hardness minerals. Such thorough removal is paramount in both residential and commercial settings. Industrial sectors, particularly food and beverage manufacturing, place a premium on this complete hardness removal. Here, near-zero levels of calcium and magnesium are crucial to avert equipment challenges, such as bottle staining and membrane fouling. Yet, despite this dominance, the segment grapples with challenges. Regulatory bodies are tightening restrictions on chloride discharge from brine, and rising salt costs are straining operational economics. This has led some municipalities and eco-conscious consumers to explore alternatives. Still, the undeniable efficiency and effectiveness of salt-based systems anchor them firmly in sectors where achieving absolute water softness is essential. Their relevance is further underscored by industrial food processors, who consistently opt for salt-based columns due to their precision and reliability.
Salt-free water softener systems, though currently holding a smaller market share, are rapidly gaining traction, boasting a projected CAGR of 5.77% through 2030. This surge in adoption can be attributed to their approach of preventing scale formation, rather than completely removing minerals. This method resonates with the priorities of today's convenience-driven consumers and commercial operators. The market's landscape shifted with the introduction of affordable, NSF-tested salt-free descalers. A notable example is WaterBoss's 2024 launch, priced at a competitive USD 299.99. This price point has broadened accessibility, especially for sectors like hotels and quick-service restaurants. These establishments benefit from reliable scale protection for their dishwashers and coffee machines, all while sidestepping brine discharge fees and regulatory challenges. Additionally, as municipalities tighten restrictions on salt usage and environmental awareness grows, there's a noticeable shift in preference towards salt-free systems. These systems not only promise easy installation and minimal maintenance but also come with environmental advantages. This makes them an attractive choice for residential users and commercial properties aiming to cut operational costs. Consequently, competition in the market is heating up, with both salt-based and salt-free technologies vying for consumers, each with distinct needs in performance, regulation, and sustainability.


By Process: Reverse Osmosis Gains Momentum
In 2024, ion exchange technology commanded a dominant 41.17% share of the water softener market, bolstered by mature supply chains and the widespread availability of standardized resin media. Its leadership position is further accentuated by the technology's relatively low capital cost per grain of hardness removed, rendering it a cost-effective and trusted choice for both residential and commercial uses. This technology adeptly removes minerals causing water hardness, ensuring a consistent performance that aligns with industry benchmarks. Ion exchange systems, celebrated for their operational stability and maintenance ease, enjoy a robust market presence, thanks to widespread installer familiarity and a comprehensive service infrastructure. Even with the rise of alternatives, ion exchange technology remains the cornerstone of the water softening industry, thanks to its reliable hardness removal and cost benefits.
While currently holding a smaller market share, reverse osmosis (RO) is emerging as the fastest-growing segment in water treatment, with projections indicating a robust 6.27% CAGR. This surge is largely attributed to RO's dual capability: not only does it tackle water hardness, but it also effectively removes contaminants like PFAS, nitrates, and pharmaceuticals. This aligns seamlessly with the world's tightening drinking water standards. In commercial kitchens, there's a growing preference for duplex designs that merge softened water with RO-treated streams. This blend fine-tunes mineral content, significantly enhancing coffee extraction quality. In the healthcare realm, hospitals are turning to integrated RO skid packages, ensuring the utmost purity of dialysate solutions. This underscores RO's pivotal role in specialized medical processes. In light of these shifting demands, manufacturers are innovating, merging ion exchange systems with RO membranes into cohesive bundled rack systems. This evolution not only offers installers a holistic solution tailored to varied regulatory standards and application demands but also amplifies the reach and adoption of RO technologies across diverse market segments.
By End User: Residential Momentum Narrows the Gap
In 2024, commercial premises dominated the water softener market, capturing a notable 59.39% share. Industries reliant on conditioned water, such as hotels, laundries, and manufacturing plants, drive this trend. These sectors utilize softened water to mitigate scale buildup, thereby prolonging the lifespan of essential equipment and ensuring smooth operations. For instance, industrial kitchens have reported energy savings of up to 12% on heating elements, underscoring the economic advantages of water softening. Such benefits lead to a swift return on investment, spurring widespread adoption in commercial settings. Moreover, the need for robust infrastructure and regular maintenance in these industries bolsters commercial demand. Ultimately, the commercial segment stands as the cornerstone of the water softener market, prioritizing product quality and equipment safeguarding.
Meanwhile, the residential segment is on an upward trajectory, boasting a CAGR of 5.93%. This growth is largely attributed to the rise of smart-home technologies, which offer users real-time updates on salt levels and water consumption. Such digital features not only boost consumer engagement but also streamline system management, making water softeners increasingly appealing to homeowners. In a testament to this trend, Fortune Brands recently acquired SpringWell for USD 105 million, signaling strong corporate faith in the allure of comprehensive softening and filtration solutions for health-conscious households. Furthermore, subscription models for salt delivery not only ease maintenance burdens but also foster long-term loyalty through added convenience. As public awareness of water quality and its health implications rises, residential adoption of water softeners continues to gain momentum. This shift from traditional ownership to a more interactive and convenient experience is propelling the growth of the home water softening market.
By Distribution Channel: Digital Pathways Extend Market Reach
In 2024, offline dealer networks led the charge in water softener sales, capturing 65.35% of the market. Their dominance stems largely from offering turnkey installation services and local service contracts, both of which resonate deeply with customers seeking professional assistance. In these networks, independent water-quality specialists hold significant sway, particularly in areas where municipal regulations necessitate licensed installers to adhere to local codes. This expert involvement not only fosters consumer trust but also guarantees the correct setup and maintenance of systems. Their hands-on consultation and troubleshooting capabilities further cement offline dealers as the preferred choice for both residential and commercial clients. Even with the rise of digital platforms, these dealer networks continue to play a pivotal role in acquiring and retaining customers, solidifying their market leadership.
Online sales are on an upward trajectory, boasting a 6.17% CAGR, as an increasing number of consumers turn to e-commerce to explore specifications and buy DIY water softeners designed for quick-connect, under-sink setups. Retail behemoths like Amazon showcase a vast array, featuring over 700 softening SKUs, while Walmart elevates the shopping experience by offering installation vouchers at checkout, seamlessly linking online purchases with in-person service. Brands are pushing boundaries with augmented reality (AR) tools, allowing homeowners to visualize tank and brine cabinet sizes pre-purchase, a move that's notably boosting sales conversions. The emergence of hybrid click-and-collect strategies, merging online selection ease with local professional services, is redefining market dynamics and setting new consumer standards. This blend of digital and traditional services is swiftly transforming the water softener landscape, enhancing flexibility and customer interaction. Consequently, the online segment is set for further growth, fueled by shifting buyer habits and tech advancements.
Geography Analysis
In 2024, North America dominated the water softener market, holding a 39.17% share. This stronghold is bolstered by extensive hard-water belts, from Illinois to Arizona, and proactive state regulations promoting system upgrades. In a notable move, California removed over 8,000 non-compliant units, paving the way for vendors specializing in TAC and brine recovery. Furthermore, the region stands out with its advanced adoption of IoT, enabling utilities and dealers to harness data for optimized regeneration, reduced salt consumption, and proactive service management.
Asia-Pacific is set to outpace others, forecasting a robust 5.85% CAGR growth through 2030. This surge is driven by urbanization, industrial growth, and a burgeoning middle class becoming increasingly aware of water quality. A.O. Smith’s strategic USD 120 million acquisition of Pureit underscores the urgency for OEMs to establish localized manufacturing and distribution channels. This is especially crucial in densely populated South Asian regions, where piped water hardness frequently surpasses 400 ppm. While China's Five-Year Plan municipal projects are likely to incorporate centralized softening, there's a notable allure for household point-of-entry systems, especially in areas where groundwater skips treatment grids.
Europe grapples with the dual challenges of sustainability mandates and aging infrastructure. The EU's circular-economy initiative promotes devices that minimize resource consumption, subtly steering consumers towards salt-free and high-efficiency softeners. In a strategic move, Grundfos acquired Culligan's commercial assets across Italy, France, and the UK for over EUR 100 million. This expansion enhances service capabilities, particularly for industrial retrofits targeting chloride discharge reductions to below 250 mg/L. Meanwhile, Eastern Europe and the Baltics are witnessing a construction boom, integrating combination softening-filtration systems, presenting multinationals with a prime opportunity to introduce factory-programmed digital valves.

Competitive Landscape
The water softener market showcases a moderately concentrated yet fragmented competitive landscape. This structure allows both established giants and emerging disruptors to carve out their niches through distinct positioning strategies. However, strategic mergers have notably altered this landscape. For example, Pentair's acquisition of Pelican expanded its portfolio to include comprehensive home solutions. In another instance, Culligan's merger with Waterlogic bolstered its expertise in point-of-use purification. Typically, consolidators target regional specialists with unique installation networks, seamlessly integrating once-dispersed dealer relationships into unified, vertically-aligned service entities.
Technological investment emerges as the second competitive cornerstone. Industry leaders race to embed Wi-Fi modules, machine-learning salt algorithms, and mobile dashboards into their products. Highlighting this trend, Ecolab's subsidiary, Purolite, launched a resin plant in Pennsylvania. This facility not only introduces 150 skilled jobs but also features an enhanced ion-exchange capacity per cubic foot, enabling smaller vessel sizes in premium units. Concurrently, agile start-ups are tapping into e-commerce, offering subscription-based salt deliveries, lifetime warranties, and AI-driven chat support, all appealing to younger demographics.
Geographic expansion constitutes the third competitive frontier. The promise of Asian market volumes has lured Western players, resulting in joint ventures that tailor tank blow-molding and valve machining to regional preferences. Conversely, Chinese Original Design Manufacturers (ODMs) are eyeing UL and NSF certifications as their ticket to the U.S. retail arena, intensifying price competition. Environmental regulations wield a dual influence; they can hinder entry but also spur growth. Firms securing certifications for low-brine or salt-free operations can set premium price points. Meanwhile, those lagging risk being sidelined in certain regions. Collectively, these competitive nuances favor agile manufacturers who adeptly blend acquisition tactics, digital innovations, and sustainability in their water softener market strategies.
Water Softener Industry Leaders
-
Pentair PLC
-
EcoWater Systems
-
A. O. Smith Corporation
-
Whirlpool Corporation
-
Culligan International Company
- *Disclaimer: Major Players sorted in no particular order

Recent Industry Developments
- December 2024: Pentain PLC bolstered its water softener production capabilities by acquiring G&F Manufacturing for approximately USD 108 million. This acquisition is expected to enhance the company's manufacturing capacity and strengthen its product portfolio in the water softener equipment market.
- November 2024: A.O. Smith Corporation, with an investment of around USD 120 million, purchased the renowned RO water softener brand Pureit from Unilever. This strategic move aims to broaden the company's footprint in the residential sector, leveraging Pureit's established market presence to expand its customer base and product offerings.
- March 2024: A.O. Smith Corporation expanded its portfolio by acquiring California's Impact Water Products, a company specializing in water softener solutions. This acquisition aligns with the company's strategy to diversify its product range and cater to the growing demand for advanced water treatment solutions.
- October 2023: Watts Water Technologies Inc. made a significant move by acquiring Bradley Corporation, known for its EasyWater brand of water softeners, in a deal valued at approximately USD 303 million. This acquisition is anticipated to strengthen Watts Water Technologies' position in the water softener market by integrating Bradley Corporation's innovative product line into its existing operations.


Global Water Softener Market Report Scope
| Salt-Based Ion-Exchange Softeners |
| Salt-Free Softeners |
| Ion Exchange |
| Reverse Osmosis |
| Others |
| Residential |
| Commercial |
| Online Channels |
| Offline Channels |
| North America | United States |
| Canada | |
| Mexico | |
| Rest of North America | |
| Europe | Germany |
| United Kingdom | |
| France | |
| Italy | |
| Spain | |
| Russia | |
| Netherlands | |
| Belgium | |
| Sweden | |
| Rest of Europe | |
| Asia-Pacific | China |
| India | |
| Japan | |
| South Korea | |
| Australia | |
| Rest of Asia-Pacific | |
| South America | Brazil |
| Argentina | |
| Rest of South America | |
| Middle East and Africa | Saudi Arabia |
| United Arab Emirates | |
| South Africa | |
| Rest of Middle East and Africa |
| By Product Type | Salt-Based Ion-Exchange Softeners | |
| Salt-Free Softeners | ||
| By Process | Ion Exchange | |
| Reverse Osmosis | ||
| Others | ||
| By End-User | Residential | |
| Commercial | ||
| By Distribution Channel | Online Channels | |
| Offline Channels | ||
| By Geography | North America | United States |
| Canada | ||
| Mexico | ||
| Rest of North America | ||
| Europe | Germany | |
| United Kingdom | ||
| France | ||
| Italy | ||
| Spain | ||
| Russia | ||
| Netherlands | ||
| Belgium | ||
| Sweden | ||
| Rest of Europe | ||
| Asia-Pacific | China | |
| India | ||
| Japan | ||
| South Korea | ||
| Australia | ||
| Rest of Asia-Pacific | ||
| South America | Brazil | |
| Argentina | ||
| Rest of South America | ||
| Middle East and Africa | Saudi Arabia | |
| United Arab Emirates | ||
| South Africa | ||
| Rest of Middle East and Africa | ||


Key Questions Answered in the Report
What is the current value of the water softener market?
The water softener market size reached USD 9.64 billion in 2025 and is projected to hit USD 12.58 billion by 2030.
Which region leads the water softener market?
North America held 39.17% of global sales in 2024 thanks to widespread hard water and established dealer networks.
Why are salt-free softeners gaining ground?
Environmental regulations on brine discharge and consumer interest in low-maintenance solutions are driving 5.77% CAGR growth for salt-free products.
How fast is reverse osmosis expanding inside the market?
Reverse osmosis processes are forecast to rise at a 6.27% CAGR between 2025-2030 because they remove multiple contaminants alongside hardness.
Page last updated on:


