
Market Overview
| Study Period | 2021 - 2031 |
|---|---|
| Forecast Data Period | 2026 - 2031 |
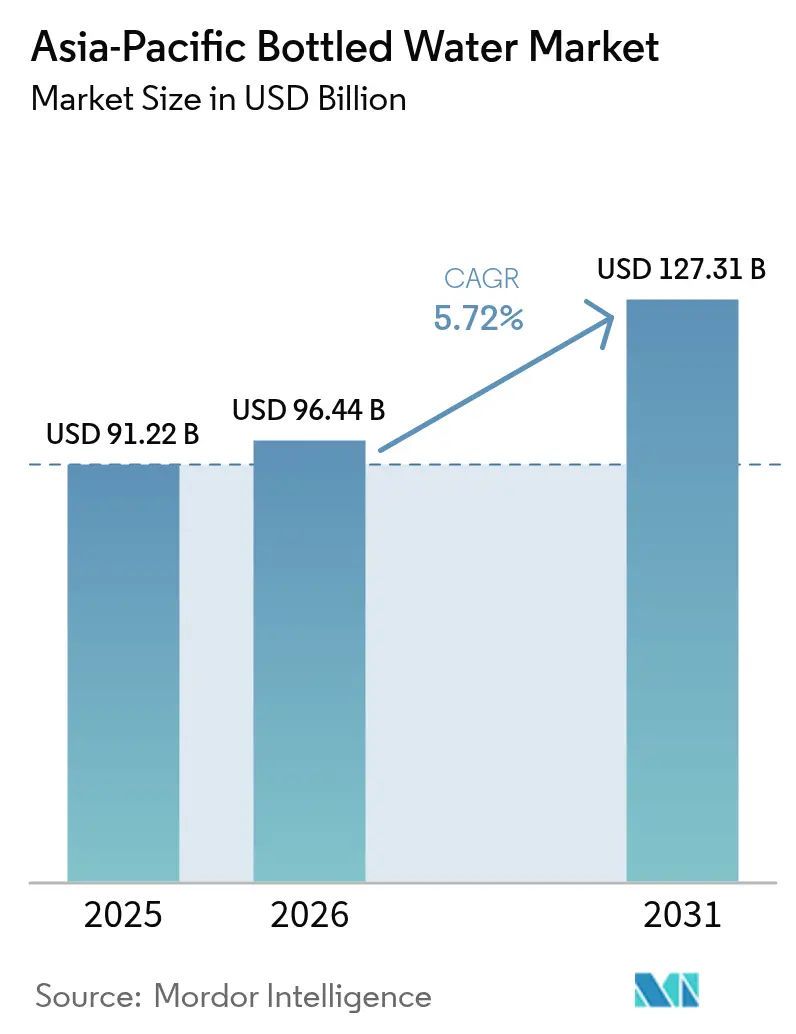
| Base Year Market Size (2025) | USD 91.22 Billion |
| Market Size (2026) | USD 96.44 Billion |
| Market Size (2031) | USD 127.31 Billion |
| Growth Rate (2026 - 2031) | 5.72 % |
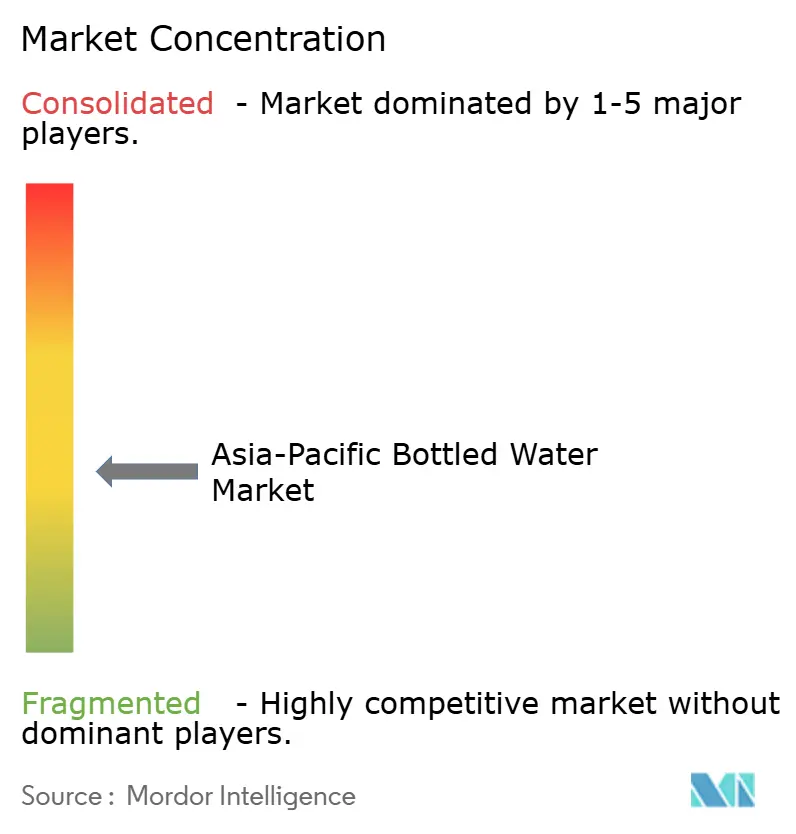
| Market Concentration | Medium |
Major Players
*Disclaimer: Major Players sorted in no particular order Image © Mordor Intelligence. Reuse requires attribution under CC BY 4.0. |
|
Asia-Pacific Bottled Water Market Analysis by Mordor Intelligence
The Asia-Pacific bottled water market size is expected to grow from USD 91.22 billion in 2025 to USD 96.44 billion in 2026 and is forecast to reach USD 127.36 billion by 2031 at 5.7% CAGR over 2026-2031. Urban middle-class households are increasingly health-conscious and questioning the safety of tap water, leading to significant shifts in hydration habits in major cities. This trend has driven a growing demand for premium, functional, and sustainably positioned products, as consumers prioritize quality and environmental impact. Meanwhile, instant retail and IoT-driven micro-warehousing are transforming supply chains by speeding up replenishment cycles and enhancing brand visibility, ensuring products are readily available to meet consumer needs. In response to stricter regulations on plastic waste, producers are pivoting towards aluminum and PET with high recycled content, which has spurred increased investments in closed-loop systems to support sustainability goals. The bottled water market remains fiercely competitive, characterized by a mix of fragmentation and premiumization. This dynamic allows agile regional players to challenge multinational corporations for shelf space, reflecting the evolving preferences and demands of consumers in this market.
Key Report Takeaways
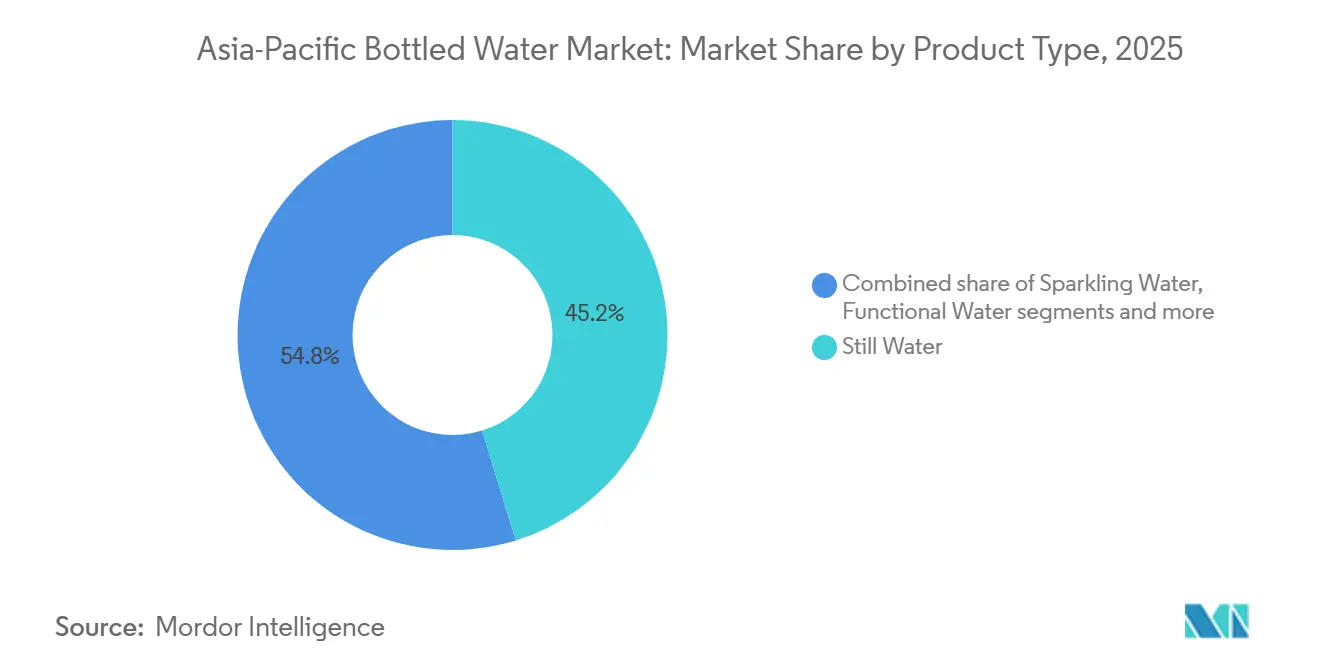
- By product type, still water held 45.22% bottled water market share in 2025, and sparkling water is projected to advance at a 7.41% CAGR through 2031.
- By packaging, PET bottles commanded 64.62% share of the bottled water market size in 2025, while aluminum cans are forecast to expand at a 6.55% CAGR to 2031.
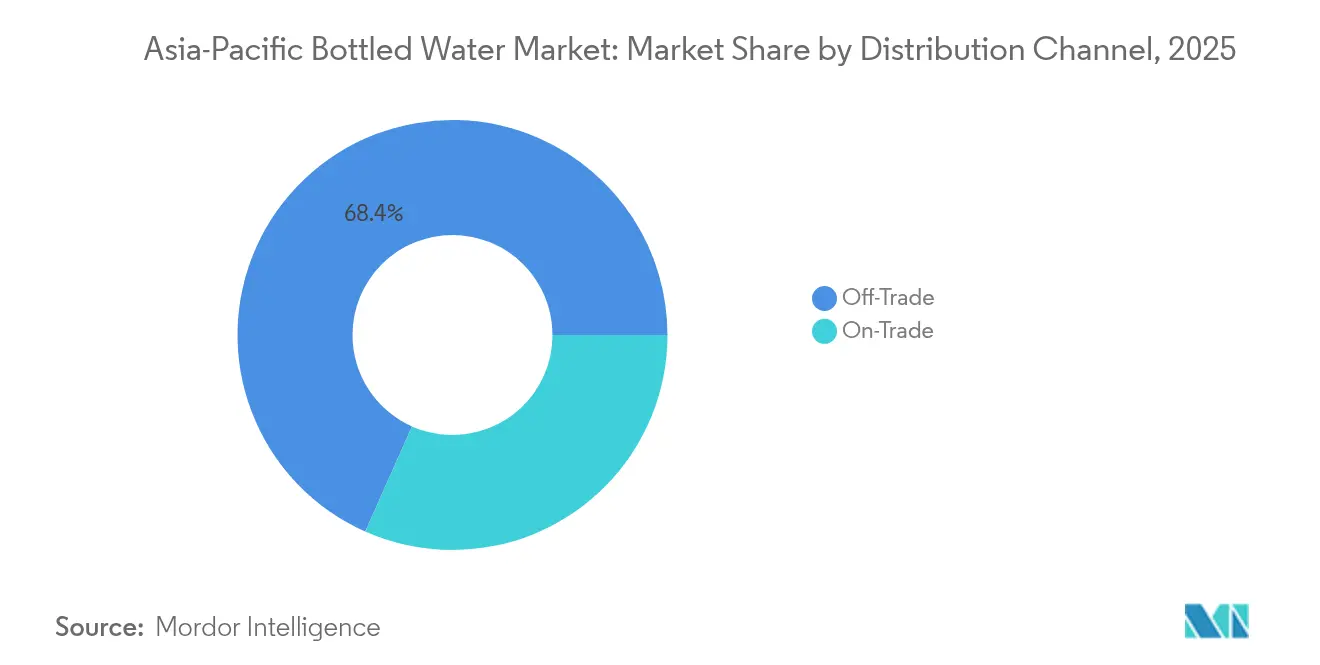
- By distribution channel, off-trade controlled 68.35% of sales in 2025, yet on-trade is recovering at a 7.15% CAGR through 2031.
- By geography, China accounted for 39.62% of regional demand in 2025, whereas India is poised for the fastest growth at a 7.76% CAGR to 2031.
Note: Market size and forecast figures in this report are generated using Mordor Intelligence’s proprietary estimation framework, updated with the latest available data and insights as of 2026.
Market Trends and Insights
Drivers Impact Analysis of Asia-Pacific Bottled Water Market*
| Driver | (~) % Impact on CAGR Forecast | Geographic Relevance | Impact Timeline |
|---|---|---|---|
| Growing health and wellness awareness | +1.2% | Global, with peak adoption in Japan, South Korea, Singapore, urban China and India | Medium term (2-4 years) |
| Urbanization-led on-the-go hydration demand | +1.5% | India, Indonesia, Vietnam, Philippines; spillover to tier-II/III Chinese cities | Long term (≥ 4 years) |
| Product and packaging innovation (flavors, functional, eco) | +0.9% | Japan, South Korea, Australia, Singapore; premium segments in China and India | Short term (≤ 2 years) |
| Rising disposable incomes and premiumization | +1.3% | China, India, Vietnam, Malaysia, Thailand; urban middle-class corridors | Medium term (2-4 years) |
| ESG-driven corporate bottled-water procurement programs | +0.4% | Multinational corporate hubs in Singapore, Hong Kong, Japan, Australia | Short term (≤ 2 years) |
| IoT-enabled micro-warehouse vending expansion | +0.3% | Malaysia, Singapore, urban China, Japan; pilot rollouts in Thailand and Indonesia | Medium term (2-4 years) |
| Source: Mordor Intelligence | |||
Growing health and wellness awareness
As clinical evidence increasingly underscores the link between hydration and metabolic and renal health, bottled water is transitioning from a simple commodity to a recognized functional beverage. In India and Southeast Asia, public campaigns emphasize the significance of safe drinking water in the fight against waterborne illnesses, leading to a heightened preference for branded water over tap alternatives. Concurrently, Japan's aging population is showing a preference for mineral-rich, low-sodium labels, especially those marketed for cardiovascular advantages. Brands are not just making claims; they're backing them with third-party trials, a strategy that not only boosts their shelf value but also paves the way for profitable institutional contracts. This shift highlights the bottled water market's growing significance in the realm of preventive healthcare. Further bolstering this trend, the Australian Beverages Council reveals that in line with the non-alcoholic beverage industry's voluntary Sugar Reduction Pledge, a significant 222,530 tonnes of sugar were purged from Australian diets[1]Source: Australian Beverages Council, "Seventh progress report, 1 January 2015 to 31 December 2024", australianbeverages.org. This notable reduction underscores the industry's responsiveness to both consumer health trends and regulatory mandates, further solidifying bottled water's status as a preferred healthy beverage.
Urbanization-led on-the-go hydration demand
As cities in India, Indonesia, Vietnam, and the Philippines expand rapidly, residents find themselves spending more time commuting and seeking convenient drinking options. With municipal networks struggling to keep pace with rising populations, many commuters have turned to grab-and-go formats, particularly PET bottles. In China, instant-retail super-apps are making waves, handling tens of millions of deliveries within the same hour, and bottled water consistently emerges as a top-selling category. Meanwhile, Japan and Singapore are witnessing a proliferation of smart vending units, streamlining the purchasing process. As a result, the bottled water market sees significant volume growth, driven largely by on-the-go consumption. The increasing urbanization in these regions further amplifies the demand for portable drinking solutions. Additionally, advancements in packaging technology are enhancing the convenience and appeal of bottled water products.
Product and packaging innovation
As sparkling, alkaline, and vitamin-infused waters gain traction, they carve out a premium niche, echoing a lifestyle aspiration once reserved for traditional carbonated drinks. Aluminum bottles, boasting over 60% recycled content, not only alleviate concerns over microplastics but also resonate with the environmentally-conscious Gen Z demographic. Regional bottlers, harnessing local fruits like yuzu and lychee, craft unique flavor profiles. Meanwhile, innovations like tethered caps and fully recycled rPET bottles align with stringent eco-design regulations. Such continuous innovations not only elevate average selling prices but also help brands stand out in the saturated bottled water arena. The growing demand for functional beverages is driving companies to invest heavily in research and development. Additionally, partnerships with local suppliers are becoming a key strategy to ensure sustainable sourcing and meet consumer preferences.
Rising disposable incomes and premiumization
As median incomes rise, consumers are shifting from generic jerrycans to imports that boast specific mineral provenance. In China, the number of SKUs priced above CNY 10 jumped over 40% year-on-year in 2025, driven by the merging of gifting culture and lifestyle branding. Establishments like hotels, cafés, and duty-free shops are now favoring glass and aluminum bottles, which fetch a 30-50% premium over standard PET options. This push towards premiumization not only boosts margins but also encourages industry players to amplify their narratives around source purity and terroir. Such dynamics are reshaping the competitive landscape of the bottled water market. The growing emphasis on sustainability has further accelerated the adoption of eco-friendly packaging formats. Additionally, consumer preferences for health and wellness are driving demand for functional and fortified water products.
Restraints Impact Analysis of Asia-Pacific Bottled Water Market*
| Restraint | (~) % Impact on CAGR Forecast | Geographic Relevance | Impact Timeline |
|---|---|---|---|
| Stringent plastic-waste and water-extraction regulations | -0.8% | China, India, Japan, Singapore, Australia; national enforcement with regional variance | Short term (≤ 2 years) |
| Rapid uptake of in-home water purifiers | -0.6% | India, China, Indonesia, Vietnam; urban middle-class households | Medium term (2-4 years) |
| Consumer backlash over microplastics contamination reports | -0.3% | Japan, South Korea, Australia, Singapore; educated urban consumers | Short term (≤ 2 years) |
| Intra-Asia freight and logistics cost inflation | -0.5% | Regional, with acute impact on Indonesia, Philippines, Thailand due to archipelagic geography | Medium term (2-4 years) |
| Source: Mordor Intelligence | |||
Stringent plastic-waste and water-extraction regulations
China's EPR law mandates beverage companies to finance nationwide collection and recycling efforts. This move has led to inflated compliance budgets, putting pressure on smaller operators. In India, updated plastic regulations emphasize stringent inspections, sidelining unorganized players and bolstering the dominance of certified brands. Japan has increased deposit fees on PET bottles and has introduced clearer labeling requirements to facilitate sorting. Meanwhile, Singapore is testing a redemption scheme, aiming for a 70% return rate by 2027. These diverse regulations necessitate capital-intensive circular systems, predominantly benefiting vertically integrated industry leaders. As a result, smaller players in the bottled water market grapple with escalating costs and a shrinking geographic footprint. The global bottled water market is witnessing a shift toward sustainability-driven policies. Governments are increasingly focusing on extended producer responsibility to address environmental concerns.
Rapid uptake of in-home water purifiers
In urban India and China, over 40% of households now own affordable RO units, significantly reducing their reliance on recurring bottle purchases. E-commerce platforms, by bundling installation and maintenance services, have further eased the adoption of these systems. Water purifier brands, by publicizing their water-quality tests, have successfully instilled a sense of distrust towards generic PET brands. While the economy segment sees the steepest decline in volumes, premium water brands are countering this trend by emphasizing mineral benefits and the convenience of single-serve options. As a result, the growing adoption of purifiers is reshaping the value dynamics, limiting growth at the lower end of the bottled water market. This shift highlights the increasing consumer preference for long-term cost efficiency and health benefits. Additionally, the trend is expected to influence the competitive strategies of bottled water brands during the forecast period.
*Our forecasts treat driver/restraint impacts as directional, not additive. The impact forecasts reflect baseline growth, mix effects, and variable interactions.
Asia-Pacific Bottled Water Market Segment Analysis
By Product Type – Sparkling Growth Outpaces Still
In 2025, still water dominated the bottled water market, capturing a commanding 45.22% share by volume. Its widespread distribution, operational efficiency, and the unwavering consumer trust in its purity and hydration benefits bolster its profitability. Both multinational and regional producers lean on this segment, using its revenues to fuel research and development, innovate packaging, and forge channel partnerships. Regional players, with their price leadership and deep penetration into rural markets, have ensured that still water remains a staple choice, even as premium alternatives gain traction. The segment's resilience is further supported by its affordability, making it accessible to a broad consumer base. Additionally, the increasing focus on sustainable packaging solutions is expected to enhance its appeal among environmentally conscious consumers.
Sparkling water has emerged as the market's fastest-growing segment, with projections indicating a robust 7.41% CAGR through 2031. This surge is largely attributed to its growing popularity in café culture, urban venues, and among health-conscious consumers seeking a refreshing, low-calorie option. The segment's premium positioning is bolstered by carbonation and flavor innovations, allowing for elevated price points and margins. Additionally, the rise of functional and tropical-flavored variants, coupled with strategic collaborations between bottlers and flavor houses, has amplified product differentiation and brand value in various markets. Increasing consumer awareness of hydration with added health benefits has further driven demand for sparkling water. Moreover, marketing campaigns emphasizing its sophistication and lifestyle appeal have contributed to its expanding consumer base.



By Packaging Type – Aluminum Captures Sustainability Mindshare
In 2025, PET bottles commanded a dominant 64.62% share of the bottled water market, thanks to their lightweight nature, cost-effectiveness, and a well-established logistics network. Their adaptability to high-speed bottling lines guarantees a steady supply chain performance, catering to both urban and rural markets. Initiatives like CCEP’s 2-billion-bottle closed-loop PET recycling facility in Australia bolster brand ESG credentials by curbing the dependence on virgin resin. Ongoing advancements in lightweighting, tethered caps, and labeling efficiency further cement PET’s role as the backbone of the market's volume. Additionally, the widespread availability of PET bottles in various sizes and formats enhances their appeal to a diverse consumer base. The material's durability and resistance to breakage also make it a practical choice for transportation and storage.
Aluminum packaging is emerging as the fastest-growing material segment, projected to grow at a 6.55% CAGR through 2031. Its recyclability and potential for infinite reuse resonate with circular economy principles and corporate sustainability objectives. This makes aluminum a favored choice among eco-conscious brands and institutional buyers. Furthermore, its increasing presence in tenders for low-carbon beverage procurement underscores its alignment with global decarbonization ambitions. With a growing investment in recycling infrastructure, aluminum's reputation as a premium, eco-resilient choice is solidifying its foothold in the bottled water sector. The rising consumer preference for sustainable packaging further accelerates the adoption of aluminum in the industry. Moreover, advancements in aluminum can designs are enhancing their functionality and visual appeal, attracting more brands to this packaging format.
By Distribution Channel – On-Trade Revival Signals Post-Pandemic Normalcy
In 2025, off-trade channels, including supermarkets, convenience stores, and e-commerce platforms, dominated bottled water sales, accounting for 68.35% of the market. Their widespread accessibility, competitive pricing, and growing digital presence, bolstered by instant-retail apps in China and subscription models in India, have cemented consumer loyalty and increased purchase frequency. With the aid of advanced digital shelf analytics and nimble inventory management systems, these channels achieve quicker SKU rotations and minimize stockouts. Such efficiencies not only reinforce the scale advantage of off-trade channels but also bolster promotions and data-driven merchandising, ensuring sustained growth.
On the other hand, on-trade channels are set to experience the most rapid expansion, with projections indicating a 7.15% CAGR through 2031. This growth is largely attributed to a resurgence in tourism and heightened spending in the hospitality sector. Establishments like hotels, restaurants, and event venues are increasingly opting for premium still and sparkling waters, especially when packaged in glass or aluminum, aligning with the trend of experiential dining. In markets such as Japan, Hong Kong, and Australia, the demand for banquet services and minibars is driving up category profitability, thanks to elevated unit margins. As consumers seamlessly transition between on-premise and retail environments, adopting omnichannel strategies especially those that meld forecasting with route-to-market planning becomes crucial. Such strategies ensure a steady supply and adeptly capture shifting consumption trends.
Geography Analysis
China Bottled Water Market
In 2025, China secured a dominant 39.62% share in the bottled water market. However, growth has moderated due to factors like the adoption of purifiers, rising regulatory costs, adequate rainfall and saturation in urban areas. In 2024, China saw an average annual precipitation of 717.7 millimeters, marking an 11.4 percent increase over its multi-year average, as reported by the State Council of the People's Republic of China[2]Source: China Water, "The 2024 China Water Resources Bulletin was released, " chinawater.com.cn. Notably, premium SKUs priced above CNY 10 saw a robust year-on-year growth of over 40% in 2025. This surge indicates a lucrative shift towards terroir branding and the immediacy of retail fulfillment. Nongfu Spring, leveraging data-driven delivery networks, seized over 30% of the domestic market share. In contrast, competitors lacking in flavor or packaging innovation found themselves losing ground. The increasing focus on premiumization highlights evolving consumer preferences toward higher-quality products. Additionally, the competitive landscape is being reshaped by advancements in packaging and marketing strategies.
India Bottled Water Market
India is set to witness the swiftest growth, projected at a 7.76% CAGR through 2031. This expansion is largely driven by the urbanization of its middle class, extending beyond just the megacities. While branded penetration in India remains relatively low, it presents a significant opportunity for both national and regional bottlers who prioritize quality assurance. The FSSAI's regulatory oversight is filtering out smaller, sub-scale fillers[3]Source: Food Safety and Standards Authority of India, "Addition of Food Products under High Risk Food Categories'subsequent to the omission of Mandatory BIS Certification - reg, " fssai.gov.in. This scrutiny is directing demand towards certified players who can demonstrate compliance in water sourcing and recycling, leading to a consolidation in the bottled water market. Rising disposable incomes and increasing health awareness are further driving demand for bottled water. Moreover, the growing presence of organized retail channels is enhancing accessibility to branded products.
APAC Bottled Water Market
Japan, Australia, South Korea, and select emerging ASEAN regions are witnessing distinct growth patterns. Japan is reaping benefits from a surge in inbound tourism and an aging population that prefers mineral-specific hydration. In Australia, container-deposit programs are promoting the use of cans with high recycled content, underscoring the viability of circular packaging. South Korea's vibrant café culture is boosting the popularity of sparkling water. Meanwhile, Indonesia and the Philippines, with their geographical challenges, face high freight costs. This scenario favors local bottling operations and their associated logistics. Additionally, policy initiatives like Singapore's return scheme are influencing packaging decisions and cost dynamics, resulting in a diverse growth landscape within the bottled water market. The adoption of innovative packaging solutions is also helping companies address sustainability concerns. Furthermore, regional players are increasingly investing in localized marketing campaigns to strengthen their foothold in these markets.
Regulatory Landscape
Regulation across Asia-Pacific bottled water is tightening around product safety, labeling, and packaging circularity, increasing compliance demands for both domestic bottlers and importers. In India, the Food Safety and Standards Authority of India (FSSAI) introduced a mandatory Scheme of Testing for Packaged Drinking Water and Mineral Water, effective January 1, 2026, shifting operational focus toward batch-level testing and documentation for Food Business Operators. Thailand also updated its framework through Ministry of Public Health Notification No. 462 (B.E. 2568/2025), which set revised quality standards for drinking water in sealed containers and broadened the testing burden for chemical and physical parameters.
Several markets are using standards and enforcement to influence product formats and packaging choices. China continues to anchor production requirements through national food safety standards such as GB 19304-2018 for hygienic specifications in packaged drinking water, while annual adjustments such as the State Council Tariff Commission 2026 Tariff Adjustment Plan (effective January 1, 2026) can change landed costs for inputs and traded products. In Indonesia, BPOM began enforcing mandatory SNI certification for new high-pH bottled water registrations from April 2025, referencing SNI 8982:2021, and earlier rules requiring BPA leaching warnings on polycarbonate bottled-water packaging with a multi-year transition period reinforce a broader regional shift toward stricter labeling and materials compliance.
Competitive Landscape
In the Asia-Pacific bottled water market, no single player dominates, leading to moderate fragmentation. While multinationals like Nestlé, Danone, PepsiCo, and Coca-Cola leverage innovation and marketing, domestic players such as Nongfu Spring and Bisleri capitalize on local sourcing, cultural ties, and quicker decision-making. CCEP Australia's move into recycling not only secures essential feedstock but also mitigates regulatory expenses. The market's competitive dynamics are further influenced by regional preferences and evolving consumer demands. Companies are increasingly focusing on localized strategies to cater to diverse consumer bases across the region.
Certifications like ISO 14001 and the Alliance for Water Stewardship are becoming crucial for corporate procurement, favoring companies with verified ESG credentials. Regional innovators are tapping into specialized niches, offering products like alkaline or collagen-infused water, and adopting lean models such as contract filling and direct-to-consumer apps. Retail private labels, by positioning themselves strategically and utilizing shopper data, are slashing branded prices by as much as 30%, challenging established brands. The growing emphasis on sustainability is also driving innovation in packaging and production processes. Additionally, partnerships with local suppliers are helping brands enhance their market presence and reduce operational costs.
Modern strategies like IoT vending, predictive analytics, and micro-warehousing are reshaping the competitive landscape, pushing traditional distributors to the sidelines with dwindling margins. This dynamic environment underscores the importance of agility and sustainability in the bottled water industry. Companies investing in digital transformation are better positioned to adapt to these changes and maintain a competitive edge. Furthermore, the integration of advanced technologies is enabling real-time inventory management and improved customer engagement.
Asia-Pacific Bottled Water Industry Leaders
-
Nestlé S.A.
-
Danone S.A.
-
PepsiCo Inc.
-
The Coca-Cola Company
-
Tata Consumer Products Limited
- *Disclaimer: Major Players sorted in no particular order
Asia-Pacific Bottled Water Market Companies Covered in this Report
- Nestle S.A.
- Danone S.A.
- PepsiCo Inc.
- The Coca-Cola Company
- Tata Consumer Products Limited
- Nongfu Spring Co. Ltd
- Suntory Beverage and Food Ltd
- Bisleri International
- Asahi Group Holdings Ltd
- Hangzhou Wahaha Group
- Fiji Water Company LLC
- Voss of Norway AS
- Tibet Water Resources Ltd
- CG Roxane LLC
- Otsuka Pharmaceutical Co. Ltd
- Kirin Holdings Co. Ltd
- Vitasoy International
- Nongshim Co. Ltd
- Primo Water Corporation
- Aava Water

Market Opportunities and Future Outlook
Manufacturing scale-ups and line-speed upgrades are creating opportunities for suppliers and bottlers that can reduce unit costs while supporting SKU proliferation across still, sparkling, and functional waters. In April 2026, Hindustan Coca-Cola Beverages (HCCB) commissioned a high-speed Kinley water production line at its Avinya facility in Telangana, India, reported at 1,350 bottles per minute for 500 ml PET, highlighting the emphasis on throughput and availability in high-velocity channels. In Vietnam, Suntory PepsiCo inaugurated a USD 300 million Tay Ninh manufacturing facility in July 2026, stating capacity of 1.24 billion litres annually and an automated warehouse, pointing to continued investment in automation and regional supply nodes that can support both off-trade replenishment and foodservice recovery.
Portfolio premiumization and functional positioning are also expanding demand pools where corporate procurement and modern trade look for verified product claims and sustainability credentials. Tata Consumer Products highlighted NourishCo (water brands including Himalayan and other functional propositions) as prioritizing portfolio expansion and new launches in functional water in India, positioning this as a commercialization lever alongside low per-capita consumption rather than relying only on basic still-water volume. At the same time, tightening safety and chemical scrutiny in parts of the region, including Japan discussions around stricter mineral-water safety standards, increases the value of quality systems and third-party verification, favoring brands that can document source, treatment, and packaging compliance alongside circular-packaging investments.
Recent Industry Developments in Asia-Pacific Bottled Water Market
- June 2026: Danone signed a definitive agreement to acquire Australia-based MADE Group, adding the Nutrientwater enhanced water brand and other functional beverage assets to its portfolio. The move strengthens Danone’s position in health-forward waters and adjacent functional beverages across Asia-Pacific, using Australia as a platform for innovation and regional distribution. The transaction structure also signals continued consolidation around premium and enhanced-water propositions.
- May 2026: Tata Consumer Products highlighted portfolio expansion priorities for its NourishCo subsidiary, which manages water brands including Himalayan and functional propositions such as alkaline and copper-infused variants. The focus on new launches and broader functional-water coverage supports premiumization and product differentiation in India, where branded penetration and per-capita consumption dynamics create room for tiered offerings.
- April 2026: The Coca-Cola Company reported that its water category volume grew 5% globally in Q1 2026, with growth noted across all geographic operating segments including Asia Pacific. The update reinforces water’s role as a scale category within major beverage portfolios, supporting continued investment in capacity, route-to-market execution, and packaging formats across the region.


Asia-Pacific Bottled Water Market Report Scope and Research Methodology
Market Definition and Coverage
For this study, the market covers packaged bottled water sold in the Asia-Pacific region, reported in value terms across key routes to market and major countries. Only sales of finished, labeled products intended for consumption are counted.
Scope exclusions: bulk or unpackaged water, household filtration devices, and municipal tap-water supply are excluded from this market sizing.
Segments Covered in This Report
-
By Product Type
- Still Water
- Sparkling Water
- Functional Water
- Flavoured Water
-
By Packaging Type
- PET Bottles
- Glass Bottles
- Aluminium Cans
- Others
-
By Distribution Channel
- On-Trade
-
Off-Trade
- Supermarkets/Hypermarkets
- Convenience Stores
- Home and Office Delivery
- Online Retail Stores
- Other Off-Trade Channels
-
By Country
- China
- India
- Japan
- Australia
- Indonesia
- South Korea
- Thailand
- Singapore
- Rest of Asia-Pacific
Data Sources, Market Sizing, and Validation
Desk Research
Desk research was used to establish the factual base for the model, especially around country-level beverage demand, packaging trends, and channel expansion across Asia-Pacific. We referenced public sources such as national statistics offices for consumer price series, customs and trade portals for import and export direction, food safety regulators for bottled-water standards, and multilateral datasets such as the World Bank and UN Comtrade for macro and trade context.
Along with these, we reviewed annual reports and investor presentations from listed beverage and packaging companies, plus association websites and reputable press coverage to understand pricing moves and route-to-market shifts. Select paid subscriptions for company financials and news intelligence were also used to cross-check revenue mixes and timing of announcements when public disclosures were limited. The desk sources noted here are illustrative only, and other public documents and databases were also reviewed for collection, validation, and clarification.
Primary Interviews and Surveys
Primary work was used to pressure-test assumptions that are difficult to infer from public data alone, like effective price realization by pack size, the share of on-trade versus off-trade in each country, and how quickly functional or sparkling formats are gaining traction. We spoke with a mix of bottled-water producers, packaging participants, distributors, and retail or foodservice-linked stakeholders across APAC markets. Follow-up questions were used when the price-volume story did not match the desk research signals.
Distribution of primary research fieldwork respondents
| Company type | Respondent position |
|---|---|
| Top tier: 28% | CXOs: 14% |
| Mid tier: 50% | Functional/Unit leaders: 36% |
| Smaller Players: 22% | Managers: 50% |
Market-Sizing & Forecasting
Sizing was built using a top-down approach where country beverage demand and channel value are reconstructed first, then allocated into bottled-water spending using observed category splits and pricing bands by pack and format. Totals were corroborated with selective bottom-up approximations, such as sampled supplier revenue checks, channel mix sense-checks, and price times volume benchmarks from a few representative markets, which were then used to adjust outliers.
To keep the model practical and repeatable, inputs focused on variables that can be defended in a client discussion, including population and urbanization, per-capita packaged water consumption direction, off-trade versus on-trade mix, average selling price progression by pack size and material, and the rate of premiumization (including functional and sparkling). Forecasts were developed using scenario analysis anchored on inflation and income trends, and then refined using primary feedback on expected pricing actions and category mix shifts, since price realization often moves differently across countries.
Where direct indicators were not available for smaller countries, we used proxy builds from similar markets (income band, channel structure, and consumption behavior) and normalized the outputs so the regional roll-up stays consistent with the most defensible country anchors.
Data Validation & Update Cycle
Validation was performed through multiple checks so the final number is not driven by one source or one assumption. We compared model outputs against independent signals such as observed retail price movements, reported beverage revenue direction in public filings, trade flows for packaged water where relevant, and whether channel mix assumptions align with what participants describe on the ground.
If large variances appeared, we isolated the drivers (price, volume, or mix) and reviewed them again, followed by re-contacts with interviewees when the mismatch could change the conclusion. Reports are refreshed annually, and interim updates are made when major events materially shift pricing, regulation, or supply conditions. Before delivery, a final review pass is completed so clients receive an updated view consistent with the latest available public and primary inputs.
Mordor Intelligence's Asia Pacific Bottled Water Market Size Compared Against Other Published Estimates
Published market values for bottled water in Asia-Pacific often differ even when the label looks similar, because studies may time currency conversion differently, refresh prices at different points in the year, and treat average selling price moves by pack size and channel in different ways.
In a refresh-led read, the biggest gap usually comes from whether current-year pricing is revalidated with new channel checks and inflation pass-through, or whether older ASP ladders are carried forward with a single uplift. When exchange rates are applied at a different month, and when on-trade pricing is blended into the average too aggressively, the value total can move quickly for large APAC markets. This is where the timing and re-check cadence used in Mordor Intelligence can lead to a different 2025 level than some other publications.
Benchmark comparison
| Source | Market Size | Gaps in Research Methodology |
|---|---|---|
| Mordor Intelligence | USD 91.22 B (2025) | |
| Global Consultancy A | USD 141.94 B (2025) | This figure appears to use a broader bottled-water value pool for Asia Pacific, with less visible constraints on channel boundary and pricing-by-pack logic, which can inflate the average price when premium formats and foodservice are blended more heavily. |
| Industry Publisher B | USD 139.60 B (2025) | The estimate likely carries a wider inclusion of bottled-water subtypes and may apply different currency timing and ASP escalation assumptions across countries, which can lift the 2025 value when premiumization is assumed uniformly. |
The spread across the three numbers is mainly explained by scope edges, and also by how quickly prices and mix are refreshed in the model. By keeping the value build tied to clear channel boundaries and re-checking price realization signals before sign-off, the resulting total stays easier to trace back to repeatable steps and country-level inputs.


Key Questions Answered in the Report
How big is the Asia Pacific bottled water market in 2026?
It is valued at USD 96.44 billion in 2026 and is projected to touch USD 127.31 billion by 2031.
Which product type leads bottled water sales across Asia Pacific?
Still water remains the volume leader with 45.22% market share in 2025, although sparkling water shows the fastest growth.
Why are aluminum cans gaining traction for water packaging?
Aluminum offers a 71% recycling rate versus 24.3% for plastic and aligns with corporate sustainability targets, driving a projected 6.55% CAGR in can usage.
What drives the fast growth of India’s bottled water demand?
Urbanization, health awareness, and stricter safety regulations boost branded water adoption, supporting an 7.76% CAGR to 2031.
Page last updated on:





