
Market Overview
| Study Period | 2021 - 2031 |
|---|---|
| Forecast Data Period | 2026 - 2031 |
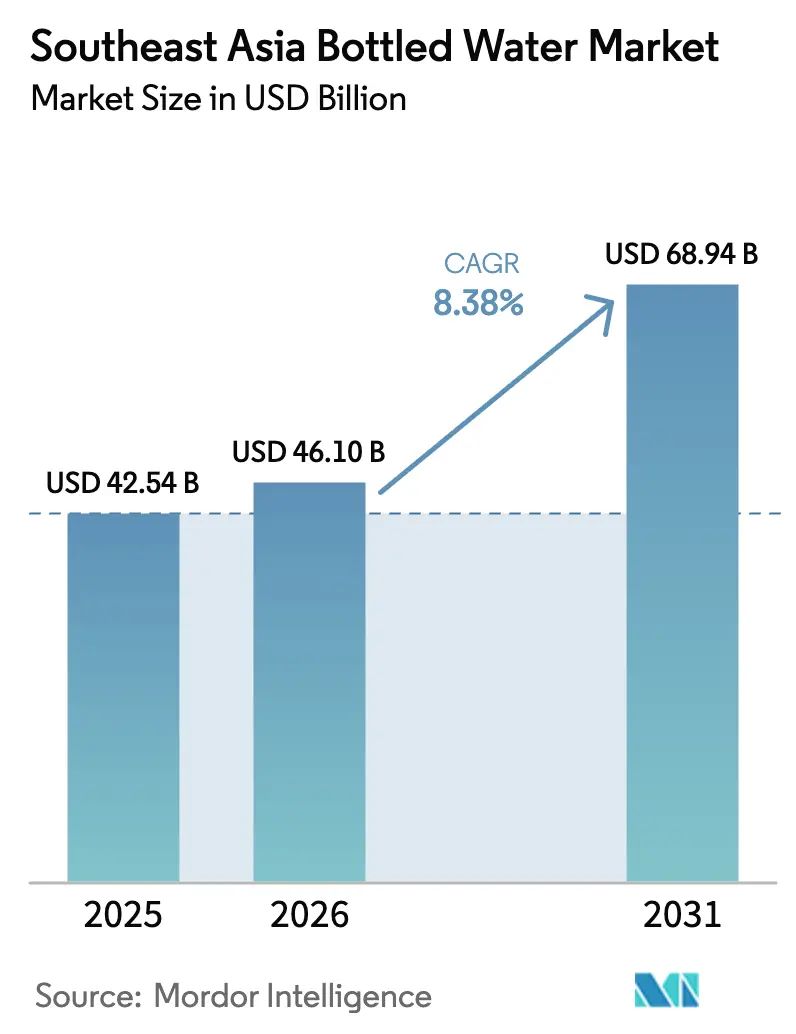
| Base Year Market Size (2025) | USD 42.54 Billion |
| Market Size (2026) | USD 46.10 Billion |
| Market Size (2031) | USD 68.94 Billion |
| Growth Rate (2026 - 2031) | 8.38 % |
| Market Concentration | Medium |
Major Players
*Disclaimer: Major Players sorted in no particular order Image © Mordor Intelligence. Reuse requires attribution under CC BY 4.0. |
|
Southeast Asia Bottled Water Market Analysis by Mordor Intelligence
The Southeast Asia Bottled Water Market size is projected to be USD 42.54 billion in 2025, USD 46.10 billion in 2026, and reach USD 68.94 billion by 2031, growing at a CAGR of 8.38% from 2026 to 2031. A growing skepticism towards tap water, swift urban migration, and an expanding retail presence are driving this category's growth. In premium tourism hubs like Thailand, Vietnam, and Singapore, hotels are increasingly adopting on-site bottling and glass formats, emphasizing quality and sustainability. This trend is further buoyed by the rising e-commerce wave, making bulk orders and subscription deliveries a breeze. Households find themselves locked into repeat purchases, especially with the introduction of functional extensions like electrolyte and vitamin-fortified products, aligning with post-pandemic wellness trends. The market is fiercely competitive: while multinationals pour investments into recycled PET and aluminum capacities to meet stringent EPR mandates, numerous provincial players are countering potential share losses with aggressive local pricing and distribution strategies.
Key Report Takeaways
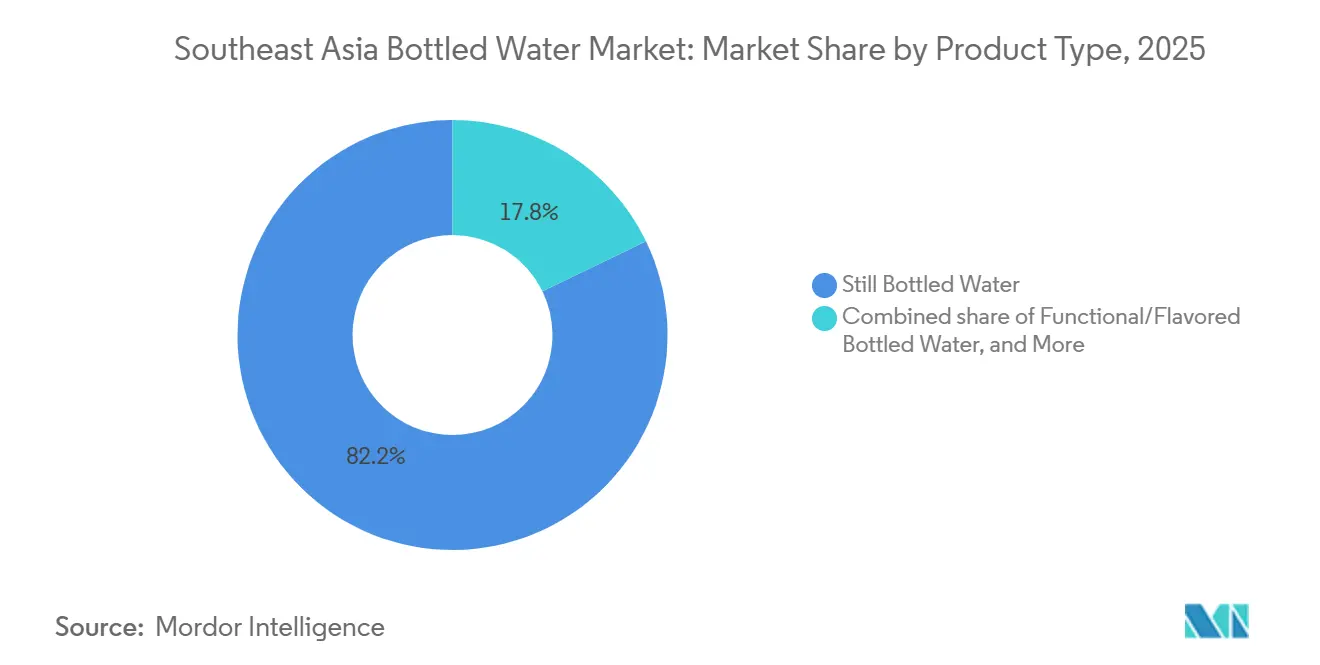
- By product type, still water led with 82.19% revenue share in 2025; functional and flavored variants will expand at an 8.50% CAGR to 2031.
- By packaging, PET bottles dominated with 62.08% of the Southeast Asia bottled water market share in 2025, while aluminum cans are projected to grow at an 8.84% CAGR through 2031.
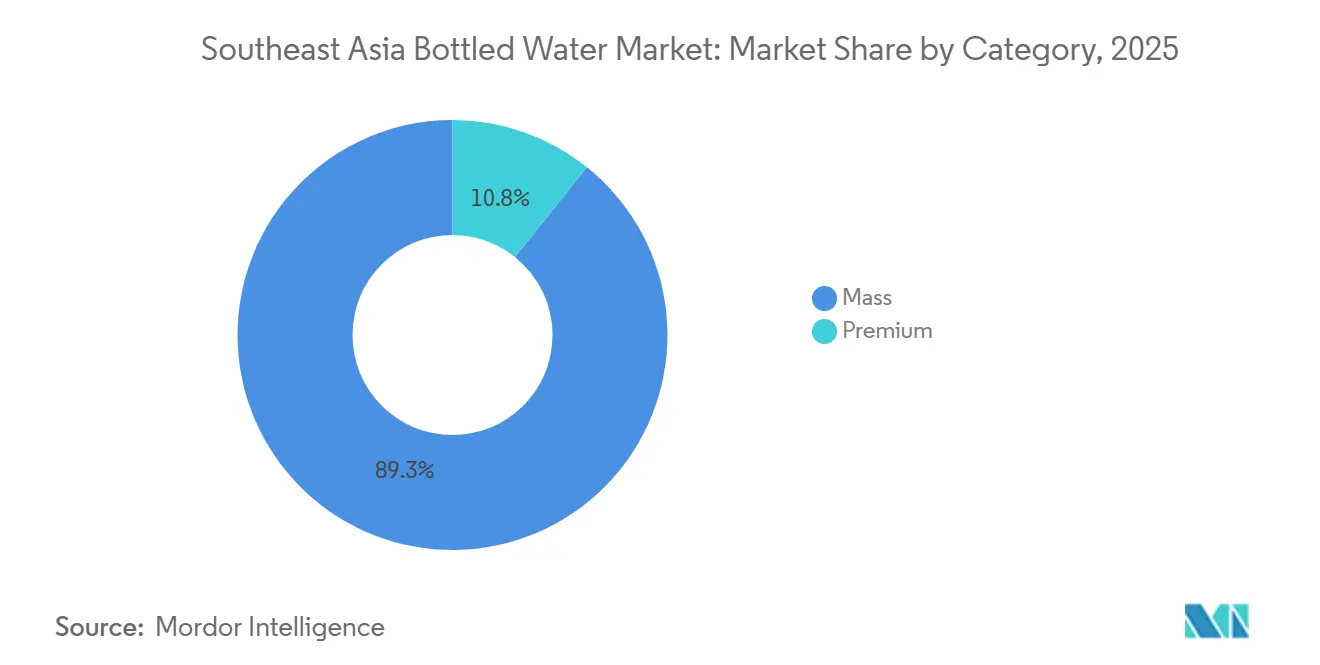
- By category, the mass segment accounted for 89.25% of the Southeast Asia bottled water market size in 2025 and premium offerings are advancing at a 9.23% CAGR to 2031.
- By distribution channel, off-trade captured 64.23% share in 2025; on-trade is forecast to post a 10.34% CAGR through 2031.
- By geography, Indonesia contributed 35.45% of the Southeast Asia bottled water market size in 2025, whereas Vietnam will be the fastest-growing country at a 9.5% CAGR to 2031.
Note: Market size and forecast figures in this report are generated using Mordor Intelligence’s proprietary estimation framework, updated with the latest available data and insights as of January 2026.
Market Trends and Insights
Drivers Impact Analysis of Southeast Asia Bottled Water Market*
| Drivers | (~) % Impact on CAGR Forecast | Geographic Relevance | Impact Timeline |
|---|---|---|---|
| Concerns over tap water contamination boost reliance on bottled alternatives | +2.1% | Indonesia, Vietnam, Philippines, Thailand | Medium term (2-4 years) |
| Rapid urbanization strains municipal water supplies, increasing demand for bottled water | +1.8% | Indonesia, Vietnam, Thailand, Malaysia | Long term (≥ 4 years) |
| On-the-go lifestyles favor convenient bottled water packaging | +1.3% | Singapore, Malaysia, Thailand, urban centers across SEA | Short term (≤ 2 years) |
| Government campaigns promote bottled water as a healthy choice | +0.9% | Thailand, Malaysia, Singapore | Medium term (2-4 years) |
| Premium variants attract demand in tourism-driven hospitality sectors | +1.1% | Thailand, Vietnam, Singapore, Indonesia (Bali) | Short term (≤ 2 years) |
| Supermarkets and e-commerce expand bottled water availability in cities | +1.2% | Vietnam, Indonesia, Philippines, Thailand | Medium term (2-4 years) |
| Source: Mordor Intelligence | |||
Concerns Over Tap Water Contamination Boost Reliance on Bottled Alternatives
Recurring water contamination incidents in Southeast Asia have eroded trust in municipal tap systems, driving households toward bottled water as a permanent solution. In Vietnam, the World Bank's 2024 report revealed that only 62% of urban households and 38% of rural households receive piped water meeting WHO microbiological standards, forcing many to bear the cost of packaged alternatives. Similarly, the Asian Development Bank's 2025 report highlighted that 30% of urban piped connections in Indonesia exceed permissible coliform limits, especially in secondary cities lacking modern treatment facilities[1]World Bank. "Vietnam Water Supply and Sanitation Infrastructure Assessment 2024", worldbank.org. In Thailand, 147 tap water quality violations recorded in 2024, primarily in northeastern provinces, triggered localized spikes in bottled water sales. This shift has created a lasting demand, as even middle-income families now view bottled water as essential for health, with trust in municipal systems taking years to rebuild despite remediation efforts.
Rapid Urbanization Strains Municipal Water Supplies, Increasing Demand for Bottled Water
By 2025, Southeast Asia's urbanization rate reached 52%, with the United Nations projecting it to rise to 68% by 2040[2]United Nations Department of Economic and Social Affairs. "World Urbanization Prospects 2025" un.org. This rapid urban growth has concentrated populations in megacities, straining water infrastructures originally designed for much smaller populations. In 2024, Jakarta faced a daily water shortfall of over 1.2 million cubic meters, forcing residents in outlying areas to rely entirely on bottled water, according to Indonesia's Ministry of Public Works and Housing. Similarly, Ho Chi Minh City's water supply system operated at 95% capacity during the dry season, leaving new residential developments without reliable piped water. As a result, property developers began including bottled water subscriptions in lease agreements. These infrastructure challenges are worsening as urbanization outpaces capital budgets, driving a sustained rise in bottled water demand that is expected to continue until governments complete their long-term pipe replacement programs.
On-the-Go Lifestyles Favor Convenient Bottled Water Packaging
As labor force participation increases and commute times grow longer, consumers are shifting toward single-serve, portable hydration options instead of home filtration systems. A 2024 Lazada survey across Thailand, Malaysia, and Singapore revealed that most respondents order groceries online weekly, with bottled water ranking among the top five items by volume. Moreover, 86% of respondents use mobile devices to access e-commerce platforms, emphasizing the growing demand for convenience-driven shopping. Shopee's 2025 data showed that Thai and Malaysian shoppers primarily purchase beverages on its platform, drawn by same-day delivery and bulk discounts that eliminate the need for in-store visits. The rapid growth of convenience stores, such as Thailand's addition of 1,200 7-Eleven and FamilyMart outlets in 2024, has made chilled bottled water easily accessible within a five-minute walk for most urban residents, encouraging effortless impulse purchases. This convenience particularly appeals to younger consumers, who consider the slightly higher cost negligible compared to the time saved.
Government Campaigns Promote Bottled Water as a Healthy Choice
Public health ministries in Southeast Asia are driving the growth of the bottled water market by promoting it as a healthier alternative to sugary drinks through targeted anti-obesity campaigns. Thailand's 2024 "Drink Water, Not Sugar" initiative distributed 2.5 million posters to schools and clinics, encouraging bottled water consumption over soft drinks. Malaysia's 2025 dietary guidelines on the MyHEALTH portal highlight bottled water for its zero-calorie content and microbiological safety, which manufacturers emphasize in their marketing. Singapore's 2024 "Healthier Choice" labeling scheme supports this trend by allowing bottled water brands to display government endorsement logos. These efforts position bottled water as a key element of wellness and preventive health, particularly in regions where over 15% of adults face diabetes and hypertension. Parents, influenced by these endorsements, are increasingly including bottled water in children's lunchboxes, fostering healthy habits from an early age.
Restraints Impact Analysis of Southeast Asia Bottled Water Market*
| Restraint | (~) % Impact on CAGR Forecast | Geographic Relevance | Impact Timeline |
|---|---|---|---|
| Logistical challenges limit rural and island distribution | -1.4% | Indonesia, Philippines, Rest of Southeast Asia (island nations) | Long term (≥ 4 years) |
| Numerous local brands intensify price competition and weaken loyalty | -0.9% | Indonesia, Philippines, Vietnam, Thailand | Medium term (2-4 years) |
| Stringent regulations on plastic packaging increase compliance costs | -1.2% | Singapore, Malaysia, Vietnam, Philippines | Short term (≤ 2 years) |
| Varying water standards complicate regional compliance and distribution | -0.7% | All Southeast Asian countries | Medium term (2-4 years) |
| Source: Mordor Intelligence | |||
Logistical Challenges Limit Rural and Island Distribution
Southeast Asia's geography and underdeveloped transport infrastructure pose significant challenges for bottled water brands to profitably serve rural and island populations. Indonesia's 17,000 islands experience high inter-island shipping costs, adding 15-25% to landed costs, while irregular ferry schedules disrupt inventory during monsoons. Similarly, the Philippines' 7,641 islands rely on costly multi-modal transport, making bottled water unaffordable for low-income households. In Thailand's northeastern provinces, poor road conditions and inadequate cold-chain infrastructure force distributors to focus on urban areas, leaving rural communities dependent on untreated well water or overpriced small-format bottles with 40-50% markups. These logistical barriers restrict market penetration and limit volume growth in regions that account for 40% of Southeast Asia's population.
Numerous Local Brands Intensify Price Competition and Weaken Loyalty
Market fragmentation in Southeast Asia enables local bottlers to compete effectively with multinational brands by leveraging lower overheads and hyperlocal distribution, which compresses margins and weakens consumer loyalty. Indonesia has over 500 bottled water brands, many operating within single provinces to minimize marketing costs and focus on price competition. Similarly, in the Philippines, regional players like Nature's Spring and Absolute dominate through direct-store-delivery models, pressuring national brands to lower prices or lose shelf space. In Thailand, over 200 brands compete, with local players offering 600ml bottles at THB 5 (USD 0.15), undercutting Singha and Nestlé by half and forcing multinationals to introduce lower-priced "fighter brands." This intense price competition, especially in off-trade channels, limits pricing power, reduces profitability, and discourages innovation as consumers view still water as a commodity.
*Our forecasts treat driver/restraint impacts as directional, not additive. The impact forecasts reflect baseline growth, mix effects, and variable interactions.
Southeast Asia Bottled Water Market Segment Analysis
By Product Type:
Still Water Anchors Volume, Functional Variants Capture Wellness SpendIn 2025, still bottled water led the market with an 82.19% share, driven by its affordability—priced 30-40% lower than sparkling and functional alternatives—and versatility for drinking, cooking, and other household uses. Brands like Danone's Aqua in Indonesia, offering 600ml bottles at IDR 3,500 (USD 0.23) and 19-liter refillable jugs at IDR 19,000 (USD 1.25), cater to both on-the-go and bulk consumption. Similarly, Nestlé's Pure Life maintains competitive pricing across Thailand, Malaysia, and the Philippines, leveraging scale to counter local competitors. While growth in this mature segment is limited, urbanization and distrust of tap water continue to drive demand, ensuring still water remains the category's revenue backbone.
Functional and flavored bottled water is projected to grow at an 8.50% CAGR through 2031, fueled by health-conscious consumers seeking hydration with added benefits like electrolytes, vitamins, and botanical extracts. Post-pandemic wellness trends have boosted demand, as seen in BE WTR's activated water, launched in Thailand and Singapore in 2024, featuring alkaline minerals and antioxidants at THB 25 (USD 0.75) for a 500ml bottle. Flavored variants like lemon, mint, and cucumber appeal to younger consumers seeking taste variety without sugar, bridging the gap between plain water and soft drinks. Sparkling bottled water remains niche due to higher production costs and limited familiarity outside Singapore and expatriate communities, but rising disposable incomes and premiumization trends suggest gradual adoption.



By Packaging Format:
PET Dominates on Cost, Cans Gain on SustainabilityIn 2025, PET bottles commanded a dominant 62.08% share of the packaging market, bolstered by their widespread manufacturing, mature supply chains, and consumer acceptance across diverse price points and distribution channels. Indorama Ventures, the leading PET resin producer in Southeast Asia, boasts recycling facilities in Thailand and Indonesia. With a combined annual capacity surpassing 50,000 tonnes, these facilities provide food-grade rPET to giants like Coca-Cola, PepsiCo, and local bottlers, all at a cost 10-15% lower than that of virgin resin. Danone's pledge in 2024 to transition Aqua to 100% rPET bottles by 2025 underscores the evolving sustainability narrative of rPET, as brands increasingly heed regulatory mandates and consumer demand for recyclable packaging. Beyond cost benefits, PET's lightweight design curtails transport emissions, resealable caps boost convenience, and transparent walls facilitate quality checks—features that appeal to consumers across all income brackets.
Aluminum cans are set to expand at a robust 8.84% CAGR through 2031, driven by their recyclability, premium market positioning, and growing production capabilities in Southeast Asia. A testament to the industry's optimism, UACJ Corporation's 2024 venture into a 1.2 billion baht (USD 35 million) aluminum recycling facility in Thailand is noteworthy. This facility, with its ability to transform post-consumer cans into beverage-grade sheets, boasts a remarkable 95% energy saving compared to primary aluminum production. This appeal is further amplified by Extended Producer Responsibility regulations in Vietnam, the Philippines, and Singapore, which impose penalties on low-recovery packaging. The premium perception of aluminum cans fuels their adoption: brands such as Liquid Death and BE WTR leverage cans to stand out in saturated markets, commanding a 30-40% price premium over their PET counterparts. Their target audience, fitness aficionados and festival attendees, values the cans' portability and visual allure. In 2024, Ball Corporation introduced resealable can technology, overcoming a traditional limitation of cans and broadening their appeal for multi-sip consumption.
By Category:
Mass Segment Anchors Volume, Premium Captures Aspirational SpendIn 2025, the mass category held an 89.25% market share, reflecting Southeast Asia's price-sensitive households and food-service establishments. Brands like Aqua, Pure Life, Spritzer, and Cleo focus on cost efficiency, distributing through sari-sari stores, wet markets, and roadside vendors, where consumers buy single bottles or refill 19-liter jugs at prices 40-50% lower than premium options. With Indonesia's 2024 per capita GDP at USD 5,016 and the Philippines at USD 4,298, mass bottled water remains a necessity rather than a luxury. Danone's Aqua, leveraging 27 production facilities, ensures availability in 95% of Indonesian retail outlets, achieving unmatched distribution density. The segment's growth aligns with population and urbanization trends but faces limited margin expansion due to intense price competition and commoditization.
The premium bottled water segment, projected to grow at a 9.23% CAGR through 2031, is driven by rising affluence, tourism recovery, and consumer preference for unique packaging, sourcing, and brand narratives. Luxury hotels like Four Seasons Vietnam and Mandarin Oriental Singapore adopt on-site bottling systems to reduce plastic waste and enhance guest experiences with unlimited premium water. Imported brands such as Evian, Fiji, and Voss dominate high-end supermarkets and hotel minibars, commanding prices 5-10 times higher than local brands due to their association with purity and status. In Singapore, 2024 data shows 18% of bottled water sales by value come from SKUs priced above SGD 3 (USD 2.25) per liter, driven by affluent locals and expatriates. Thailand's tourism sector further boosts demand, with international visitors consuming an estimated 80 million liters of premium bottled water annually at airports, hotels, and tourist sites. However, the segment's growth depends on income gains and premiumization trends, while remaining vulnerable to economic downturns that may shift consumers to mass alternatives.
By Distribution Channel:
Off-Trade Anchors Volume, On-Trade Captures PremiumsIn 2025, off-trade channels, including supermarkets, hypermarkets, convenience stores, grocery outlets, and e-commerce platforms, held a 64.23% market share, driven by bulk purchases and subscription models. Central Retail Corporation expanded modern retail in 2024 by opening 47 new GO! and Tops supermarkets in Vietnam, dedicating 12-15 linear meters to bottled water and offering multi-buy promotions to increase basket size. Convenience stores also grew, with Thailand adding 1,200 new 7-Eleven and FamilyMart outlets in 2024, placing chilled single-serve bottles within a 5-minute walk for urban residents to capture impulse purchases and commuter demand. E-commerce further reshaped off-trade dynamics, driven by automatic monthly deliveries of 20-liter jugs and 600ml multi-packs. Off-trade's dominance reflects consumer preferences for price comparisons, bulk discounts, and home delivery, advantages that traditional wet markets and mom-and-pop stores cannot match as organized retail expands.
On-trade distribution is projected to grow at a 10.34% CAGR through 2031, fueled by tourism recovery, restaurant growth, and hotels offering premium water to enhance guest experiences. Thailand's HoReCa segment, valued at THB 42 billion (USD 1.4 billion) in 2024, is expected to reach THB 57 billion (USD 1.9 billion) by 2029, supported by 35 million international tourists in 2025 and increased domestic dining. Luxury hotels like Four Seasons Vietnam and Mandarin Oriental Singapore are adopting on-site bottling systems to reduce plastic waste while achieving 15-20% margins on branded water, compared to 5-8% on procured bottles. Restaurants are listing premium bottled water alongside wine and craft beverages, with diners in Singapore's upscale establishments paying SGD 8-12 (USD 6-9) per bottle. Sentosa Development Corporation's mandate to eliminate single-use plastic bottles in resort properties by 2027 is expected to accelerate on-site bottling adoption, setting a model for other tourist destinations. While on-trade growth depends on sustained tourism recovery and consumer willingness to pay for premium experiences, it remains vulnerable to economic downturns that may reduce discretionary spending on dining and travel.
Geography Analysis
Indonesia Bottled Water Market
In 2025, Indonesia captured 35.45% of Southeast Asia's bottled water market, driven by Danone's Aqua brand, which operates 27 production facilities and expanded capacity by 1.3 billion liters annually to serve its 280 million population. Regulatory measures like Presidential Regulation 97/2017 and the Ministry of Environment's plastic reduction targets imposed Extended Producer Responsibility obligations, favoring large-scale operators like Danone. The company’s 2024 commitment to 100% rPET bottles for Aqua by 2025 highlights its efforts to meet compliance while maintaining market dominance against over 500 local competitors. However, logistical challenges across Indonesia's 17,000 islands, including high shipping costs and irregular ferry schedules, limit rural penetration and volume growth in areas housing 40% of the population.
Vietnam Bottled Water Market
Vietnam, projected to grow at a 9.5% CAGR through 2031, benefits from urbanization, rising incomes, and 2024's Extended Producer Responsibility regulations, which reshape packaging economics. State-owned Vinh Hao Mineral Water Corporation dominates southern provinces but faces competition from Nestlé's Pure Life and local brands targeting Ho Chi Minh City's middle class. Central Retail Corporation’s 2024 launch of 47 GO! and Tops supermarkets, dedicating significant shelf space to bottled water, reflects modern retail’s expansion. Vietnam’s growth depends on infrastructure improvements and income gains but could be impacted by government investments in municipal water quality.
ASEAN Bottled Water Market
Thailand, Malaysia, Singapore, the Philippines, and other Southeast Asian nations contribute the remaining market share, each navigating unique challenges. Thailand’s price competition among 200+ brands compresses margins, while Malaysia’s Spritzer leverages vertical integration to dominate. Singapore’s 2024 beverage container return scheme achieved a 72% PET recovery rate in six months, setting a regional benchmark. The Philippines’ RA 11898 Act of 2022 imposes plastic recovery targets that strain smaller players, potentially consolidating the market. Meanwhile, Cambodia, Laos, Myanmar, and Brunei remain underpenetrated but hold long-term growth potential as urbanization and GDP per capita rise.
Regulatory Landscape
Packaged drinking water regulation across Southeast Asia is tightening around product-specific quality standards, mandatory testing, and clearer category definitions (mineral, natural mineral, demineral, and other processed waters). In Thailand, the Ministry of Public Health issued Notification No. 462 (B.E. 2568/2025) for drinking water in sealed containers, updating and replacing multiple earlier notifications (1981 through 2014) and raising the bar on quality and safety compliance for sealed-pack products.
Indonesia is moving further toward mandatory Indonesian National Standard (SNI) compliance through Ministry of Industry Regulation No. 62/2024, covering several packaged-water standards (including SNI 3553:2023 for mineral water and SNI 6242:2023/Ralat 1:2024 for natural mineral water). Vietnam continues to anchor safety requirements for bottled natural mineral water and drinking water under QCVN 6-1:2010/BYT (Circular 34/2010/TT-BYT), while the Philippines requires bottled drinking water registration with the Philippine FDA and adherence to the Philippine National Standards for Drinking Water (Administrative Order No. 2017-0010). Malaysia regulates through licensing of water sources and health-officer sampling and analysis processes aligned with the Food Regulations 1985 (including the 25th Schedule), which directly influences permitting, audit readiness, and documentation discipline for producers.
Value Chain Analysis
The Southeast Asia bottled water value chain begins with water-source access (spring/groundwater or treated sources), permitting, and ongoing laboratory testing, followed by packaging inputs (PET preforms, caps, labels, and secondary packaging), bottling operations, and then heavy, high-frequency distribution into off-trade (modern trade, convenience, e-commerce) and on-trade (hotels, restaurants, and travel hubs). Bottling is capital intensive and depends on high utilization for unit-cost advantage, while the category's heavy, low-value profile makes transport a core cost driver in archipelagic markets. The report context highlights inter-island shipping adding 15-25% to landed costs in Indonesia, with similar multi-modal burdens across the Philippines.
Upstream, PET resin and the shift toward rPET are increasingly strategic, supported by regional recycling capacity such as Indorama Ventures recycling facilities in Thailand and Indonesia (combined capacity surpassing 50,000 tonnes annually in the report context). Downstream, distribution density and cold-chain access shape competitiveness, with mass still water relying on dense last-mile reach (including sari-sari stores, wet markets, and convenience formats) and premium formats (glass, cans, and on-site bottling for hospitality) requiring tighter service levels and equipment support. Fragmented national standards and packaging EPR requirements add compliance work across markets, reinforcing the advantage of players that can standardize quality systems, secure stable packaging supply, and place production closer to demand centers to reduce logistics exposure.
Competitive Landscape
The Southeast Asia bottled water market is moderately consolidated, with a small number of multinational and strong regional players holding a significant share while numerous local brands continue to operate at country and sub-regional levels. Leading companies benefit from scale advantages in sourcing, bottling, and distribution, supported by well-established brand recognition and extensive retail reach across modern trade and traditional outlets. Key players in the market include The Coca-Cola Company, Danone S.A., PepsiCo, Inc., Nestle S.A., and Fraser and Neave, Limited. However, market leadership varies by country due to differences in consumer preferences, price sensitivity, and regulatory environments, preventing any single player from dominating the region.
Regional and local players remain competitive by focusing on affordability, localized branding, and proximity-based distribution. Many operate with smaller bottling facilities close to consumption centers, allowing them to manage logistics costs and respond quickly to local demand. These brands are particularly strong in refillable and bulk water segments, as well as in rural and peri-urban areas where access to safe drinking water remains inconsistent, sustaining a diversified competitive landscape despite consolidation at the top.
Competition in the market is increasingly shaped by brand trust, packaging innovation, and sustainability initiatives rather than pricing alone. Leading players are investing in lightweight bottles, recycled materials, and premium mineral water offerings to differentiate portfolios and capture higher margins. At the same time, selective acquisitions and capacity expansions are strengthening the positions of established players, reinforcing a moderately consolidated structure while preserving room for regional competitors across Southeast Asia.
Southeast Asia Bottled Water Industry Leaders
-
The Coca-Cola Company
-
Danone S.A
-
PepsiCo. Inc
-
Nestle S.A
-
Fraser and Neave, Limited
- *Disclaimer: Major Players sorted in no particular order

Southeast Asia Bottled Water Market Companies Covered in this Report
- Danone S.A.
- Nestle S.A.
- The Coca-Cola Company
- PepsiCo Inc.
- Fraser and Neave Holdings Bhd
- Spritzer Bhd
- Asia Brewery Incorporated
- Universal Robina Corporation
- Thai Beverage Public Co. Ltd
- Boon Rawd Brewery Co. Ltd
- Vinh Hao Mineral Water Corporation
- Otsuka Pharmaceutical Co. Ltd
- Wings Group (Cleo)
- Coca-Cola Europacific Partners
- Suntory PepsiCo Beverage
- Nongfu Spring
- Indorama Ventures
- Amcor PLC
- ALPLA Group
- Berry Global Inc.

Market Opportunities and Future Outlook
Capacity build-outs and regional manufacturing localization create whitespace in underserved corridors and reduce the penalty of long-distance logistics, particularly in island and East ASEAN geographies where freight can dominate delivered cost. Evidence of active investment includes Life Water Berhad commencing operations at a new plant in Keningau, Sabah in January 2025 (taking total annual capacity to 448 million liters) and adding a RM19 million smart manufacturing line at its Sandakan Sibuga Plant 1 announced in May 2025. In Indonesia, Sariguna Primatirta (Cleo) allocated about Rp 500 billion (around USD 31 million) in 2025 capital expenditure to build three new water processing plants (Palu, Pontianak, and Pekanbaru), supporting expansion beyond the most saturated urban cores and strengthening a broader route-to-market footprint.
Sustainability and water stewardship are translating into commercial programs that support premiumization, packaging shifts, and license-to-operate narratives, particularly where EPR pressure and scrutiny on water sourcing are rising. TCP Group reported achieving Alliance for Water Stewardship (AWS) Core certification at its Prachinburi plant in Thailand in March 2026, and HEINEKEN Vietnam reported reaching its 2030 water balancing ambition in the Tien River basin in April 2025, which raises competitive benchmarks for water-intensive beverage operators and provides partnership templates for watershed projects. On the demand side, premium hospitality is adopting on-site bottling and glass formats in hubs such as Thailand, Vietnam, and Singapore (as reflected in the report context), creating opportunities for equipment providers and brands positioned around circular packaging, refill models, and differentiated water profiles. At the same time, still water retains volume scale through modern trade expansion and e-commerce bulk and subscription mechanics.
Recent Industry Developments in Southeast Asia Bottled Water Market
- July 2026: Suntory PepsiCo opened a USD 300 million factory in Tay Ninh, Vietnam, featuring its first fully automated warehouse in Asia. The site adds large-scale, high-efficiency manufacturing and warehousing capacity that supports faster replenishment and broader SKU handling across beverages, including packaged water lines where applicable.
- September 2025: Coca-Cola Europacific Aboitiz Philippines broke ground on its largest Philippine manufacturing plant in Tarlac on a 42-hectare site. The project strengthens long-run local supply capability and distribution resilience for ready-to-drink beverages, reinforcing the trend toward larger, more automated hubs in the region.
- April 2025: Fraser and Neave commenced operations at its renovated Butterworth plant in Malaysia, adding production lines for drinking water to relieve capacity pressure at its Shah Alam and Bentong facilities. This expansion improves local availability and reduces the operational strain that can constrain service levels in high-velocity off-trade channels.


Southeast Asia Bottled Water Market Report Scope and Research Methodology
Market Definition and Coverage
For this study, the market is defined as retail and on-trade sales of packaged drinking water sold in sealed containers across Southeast Asia, measured in value terms (USD) for a consistent time series.
Scope exclusions: This sizing does not count at-home filtration devices, refill kiosk water sold in loose form, or bulk water deliveries that are not sold as packaged bottled water.
Segments Covered in This Report
-
Product Type
- Still Bottled Water
- Sparkling Bottled Water
- Functional /Flavored Bottled Water
-
Packaging Format
- PET Bottles
- Glass Bottles
- Cans
-
Category
- Mass
- Premium
-
Distribution Channel
- On-Trade
-
Off-Trade
- Supermarket/Hypermarket
- Convenience/Grocery Stores
- Online Retail Stores
- Others Distribution Channel
-
Country
- Thailand
- Indonesia
- Singapore
- Malaysia
- Vietnam
- Phillipines
- Rest of Southeast Asia
Data Sources, Market Sizing, and Validation
Desk Research
Desk work starts by mapping the demand context for packaged drinking water across Southeast Asia, and then we align it to what is actually sold through on-trade and off-trade channels. Public sources are used to anchor basics such as population, income levels, and food and beverage consumption patterns before assumptions are set.
We typically refer to sources such as national statistics offices in Southeast Asian countries, customs and trade statistics for beverages, UN Comtrade for cross-checking trade direction, and FAO food balance and related water and beverage indicators where available. We also review peer-reviewed nutrition and public health papers that discuss packaged water consumption, plus company annual reports, investor presentations, and credible press coverage for packaging shifts and channel intensity. In addition, paid databases for company financials and intelligence, import and export shipment-level signals, and patent databases help validate activity levels, packaging themes, and expansion timing. The sources listed here are not exhaustive, and many other public references are also used for data collection, validation, and clarification.
Primary Interviews and Surveys
Primary work is used to pressure-test desk assumptions on pricing, channel mix, and what is counted as bottled water versus adjacent hydration products. We interview manufacturers, bottlers, distributors, modern trade contacts, and foodservice participants across APAC subregions, and then we re-check any large variances by country with follow-up calls so the final model stays realistic.
Distribution of primary research fieldwork respondents
| Company type | Respondent position |
|---|---|
| Top tier: 39% | CXOs: 13% |
| Mid tier: 47% | Functional/Unit leaders: 32% |
| Smaller Players: 14% | Managers: 55% |
Market-Sizing & Forecasting
Sizing begins with a top-down reconstruction where country level non-alcoholic beverage consumption indicators and packaged water penetration are used to build a consistent demand pool for bottled water, and the totals are then converted to value using observed price ladders. Once the main frame is built, we corroborate it with selective bottom-up approximations such as sampled average selling price (ASP) by pack format multiplied by estimated volumes in major channels, along with distributor and retailer checks where data is available.
Key inputs that shape the model include pack format mix (PET, glass, and cans), still versus sparkling versus functional and flavored share shifts, off-trade versus on-trade split, and country level pricing dispersion between mass and premium offerings. Where the data is patchy, gaps are handled by using proxy indicators like beverage shelf pricing, trade intensity, and urbanization driven consumption patterns, which are then calibrated back to interview feedback. For forecasting, scenario analysis is used so we can reflect how changes in premiumization, functional and flavored adoption, and channel formalization may move demand, and we keep the final path consistent with what industry experts consider achievable.
Data Validation & Update Cycle
Outputs are validated through triangulation across at least three angles, which usually include demand signals, pricing reality checks, and channel feedback. Outliers are flagged at the country and segment level, and those items are reviewed again before the model is signed off through multi-step internal checks.
We refresh the report annually, and interim updates are triggered when there are material changes such as major packaging regulation moves, sharp commodity or logistics cost shifts, or visible pricing resets in key markets. Before delivery, an analyst completes a final review pass so the latest available inputs are reflected in the published numbers.
Mordor Intelligence's Southeast Asia Bottled Water Market Size Measured Against Other Published Estimates
Published market values for bottled water in Southeast Asia can look far apart because each publisher sets its own product boundaries, uses different base years, and applies different pricing paths for mass and premium packs. Differences also show up when one estimate leans more on trade and shipment signals, while another leans more on consumer spend proxies.
Bulk water sold through refill stations sits outside Mordor Intelligence's scope, and that single inclusion difference can move the value sharply in markets where refills are common, even if bottled volumes are growing. Other gaps come from whether functional and flavored water is fully counted, how on-trade is treated in tourism-heavy countries, and what currency conversion timing is used for multi-country rollups.
Benchmark comparison
| Source | Market Size | Gaps in Research Methodology |
|---|---|---|
| Mordor Intelligence | USD 42.54 B (2025) | |
| Regional Consultancy A | USD 25.71 B (2024) | Uses an earlier base year and a narrower value build that appears to under-weight premium pricing and on-trade demand in higher income city markets. |
| Trade Journal B | USD 10.77 B (2025) | Likely applies a tighter product interpretation and pricing set, and may not fully capture functional and flavored water value uplift across modern trade. |
The spread in the table is mainly explained by what is counted as packaged bottled water, how much value is assigned to premiumization, and how channel mix is handled across countries. When scope is clearly stated and assumptions are checked back to country level signals, the resulting market size becomes easier to replicate and compare over time.


Key Questions Answered in the Report
How large will bottled-water sales in Southeast Asia be by 2031?
Forecasts show the Southeast Asia bottled water market reaching USD 68.94 billion by 2031 on an 8.38% CAGR.
Which country leads the regional market by value?
Indonesia contributed 35.45% of 2025 value, driven by Danone’s Aqua distribution strength.
What packaging format is growing fastest?
Aluminum cans are projected to log an 8.84% CAGR through 2031, buoyed by high recyclability and new Thai capacity.
Why is Vietnam the fastest-growing market?
Urbanization, income gains, and new EPR rules push Vietnam toward a 9.5% CAGR to 2031.
Page last updated on:





