Bird Repellent Market Size and Share
Market Overview
| Study Period | 2020 - 2030 |
|---|---|
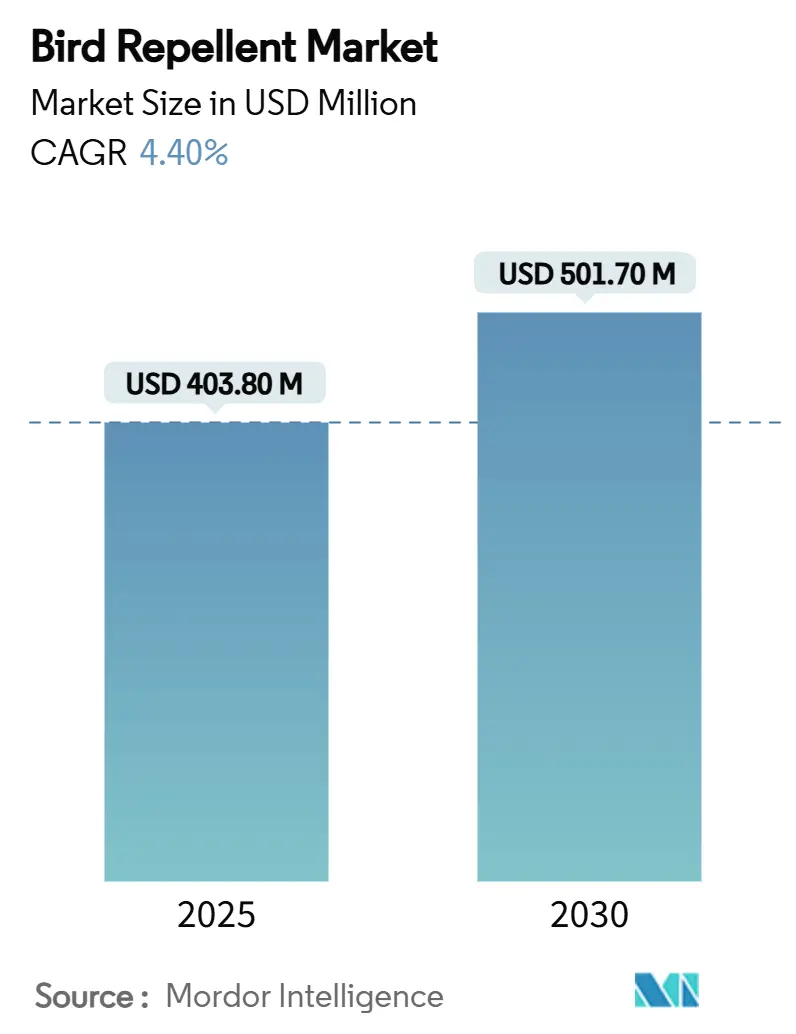
| Market Size (2025) | USD 403.80 Million |
| Market Size (2030) | USD 501.70 Million |
| Growth Rate (2025 - 2030) | 4.40% CAGR |
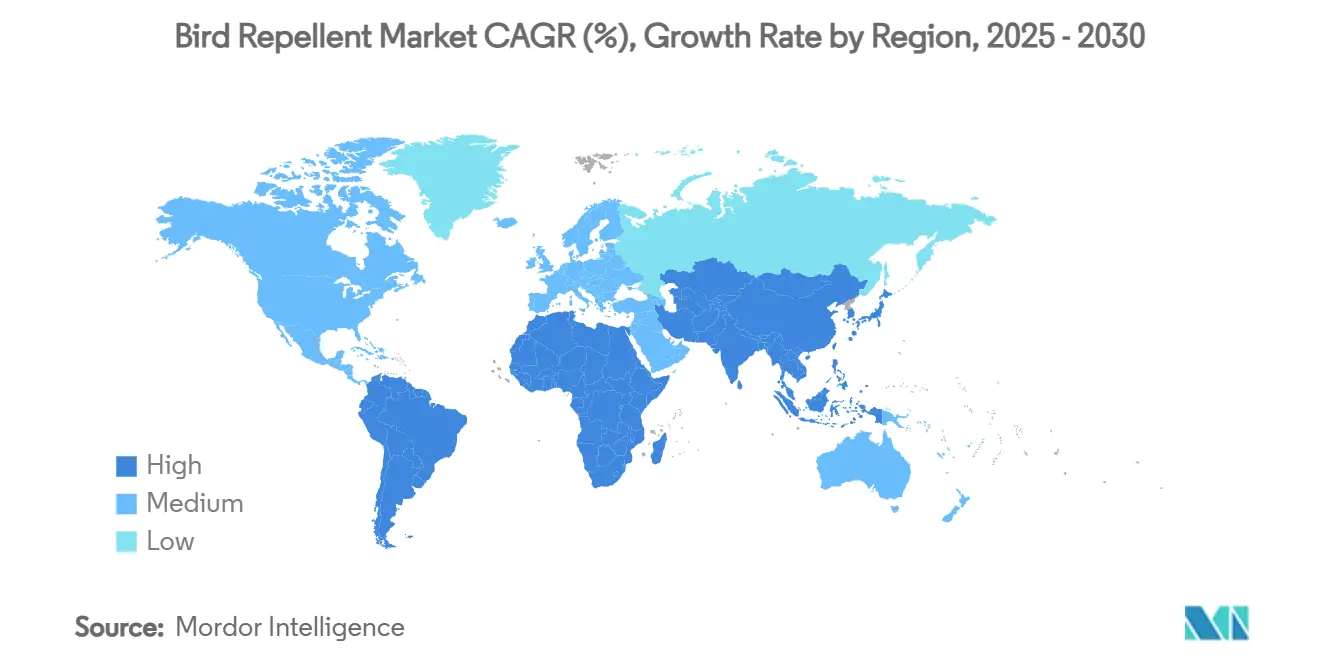
| Fastest Growing Market | Asia Pacific |
| Largest Market | North America |
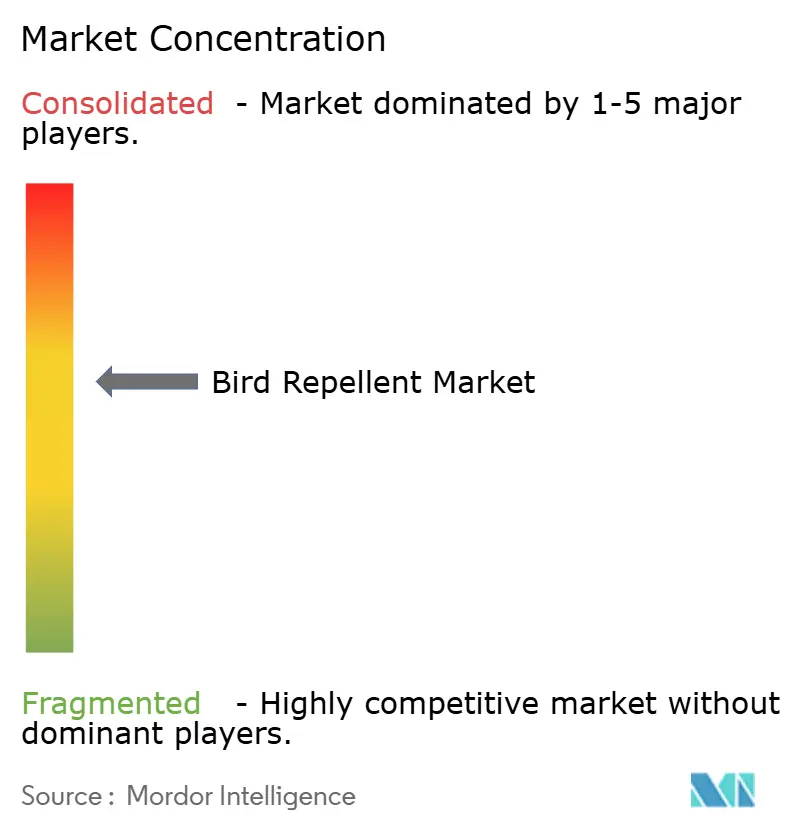
| Market Concentration | Medium |
Major Players *Disclaimer: Major Players sorted in no particular order Image © Mordor Intelligence. Reuse requires attribution under CC BY 4.0. | |
Bird Repellent Market Analysis by Mordor Intelligence
The bird repellent market size is estimated at USD 403.80 million in 2025, and is anticipated to reach USD 501.70 million by 2030, at a CAGR of 4.40% during the forecast period. This outlook reflects the shift from basic deterrents to integrated, technology-driven systems that answer urgent crop-protection needs while meeting tighter environmental rules. Large farms now run with fewer workers, creating quiet fields that draw flocks and magnify potential losses. Chemical solutions still dominate the bird repellent market, yet rapid gains in natural formulations signal a regulatory and consumer pivot toward sustainability. Regionally, North America leads in residential safety and broadacre farming, but Asia-Pacific’s rapid urbanization, rooftop farms, and orchard expansion position it as the fastest riser. Moderate concentration, with the top five suppliers holding about 60% of revenue, leaves ample room for niche specialists and alliances that blend detection, analytics, and deployment.
Key Report Takeaways
- By product type, chemical bird repellents held 54.0% of the bird repellent market share in 2024, and natural or organic bird repellents are forecast to advance at a 15.2% CAGR through 2030.
- By form, sprays accounted for 37.0% of the bird repellent market size in 2024, while gels and pastes are poised to grow at a 16.0% CAGR to 2030.
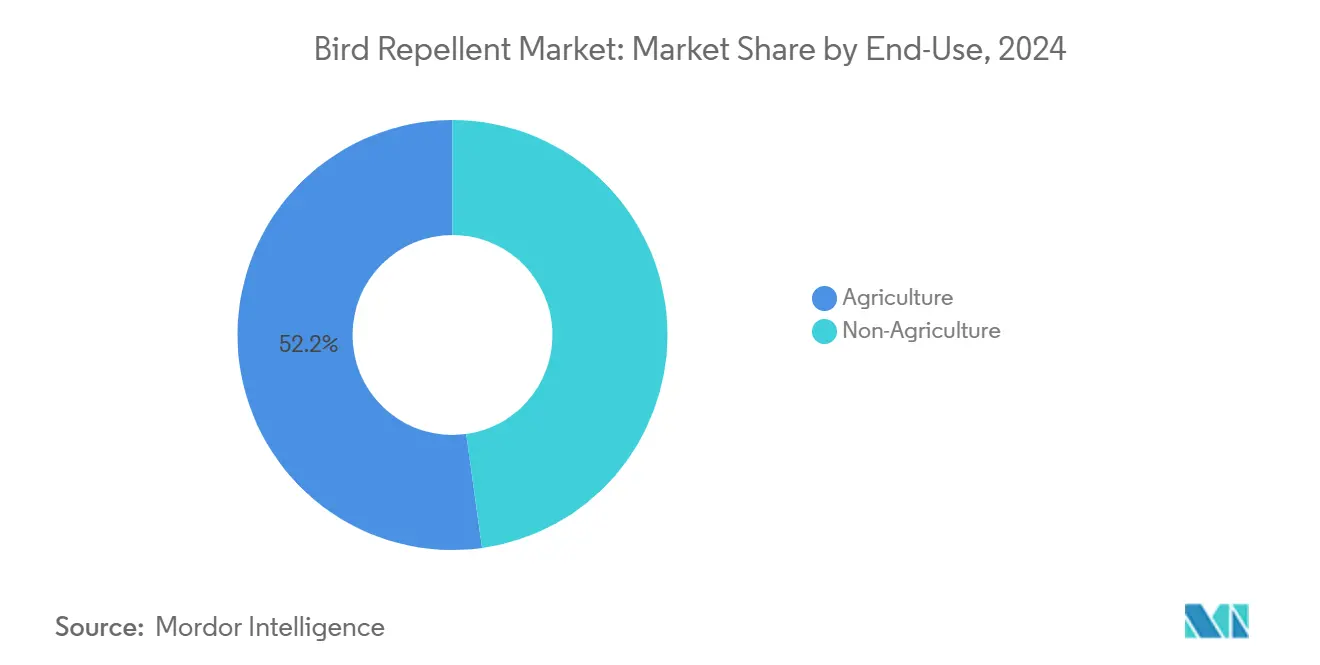
- By end-use, agriculture captured a 52.2% share of the market in 2024, and the non-agricultural uses are projected to expand at a 13.5% CAGR over 2025-2030.
- By geography, North America commanded a 33.4% share of the market in 2024, and the Asia-Pacific is set to accelerate at a 13.1% CAGR to 2030.
- The Bird-X Inc., Rentokil Initial plc, Bird Control Group BV, Pelsis Group, and Bird Barrier America Inc., in moderate concentration together commanded 60% combined market share in 2024.
Global Bird Repellent Market Trends and Insights
Drivers Impact Analysis*
| Driver | (~) % Impact on CAGR Forecast | Geographic Relevance | Impact Timeline |
|---|---|---|---|
| Escalating crop losses from avian pests post-COVID mechanization boom | +1.2% | Global, with highest impact in North America and Asia-Pacific | Medium term (2-4 years) |
| Ban on lethal bird control in Organisation for Economic Co-operation and Development (OECD) nations spurring demand for humane repellents | +0.8% | North America and Europe primarily | Long term (≥ 4 years) |
| Vineyard adoption of laser-based deterrents to protect premium grapes | +0.6% | Europe, North America, and Australia | Short term (≤ 2 years) |
| Urban rooftop farming expansion creates new market opportunities | +0.5% | Asia-Pacific core, spill-over to North America | Medium term (2-4 years) |
| Integration with AI-powered smart-scarecrow systems | +0.4% | Global, with early adoption in developed markets | Long term (≥ 4 years) |
| Surge in drone-mounted acoustic repellents for large orchards | +0.3% | North America and Asia-Pacific | Medium term (2-4 years) |
| Source: Mordor Intelligence | |||
Escalating Crop Losses from Avian Pests Post-COVID Mechanization Boom
Intensified mechanization left vast fields largely unattended, giving birds uninterrupted access to seedlings and ripening fruit. The United States Department of Agriculture (USDA) assessments in Arizona place average annual bird-related losses at USD 803,172 per affected region, with mechanized farms suffering the heaviest blows[1]Source: United States Department of Agriculture, “Final Environmental Assessment: Bird Damage Management in Arizona,” aphis.usda.gov. Growers, therefore, seek continuous, self-adjusting repellents that mesh with GPS-guided rigs and agronomic sensors. Suppliers providing "plug-and-play" modules designed for tractors, drones, or autonomous vehicles are capturing an increasing share of the bird repellent market. These data-driven systems enable precision dosing, reducing chemical usage and supporting compliance with eco-label objectives.
Ban on Lethal Bird Control in Organisation for Economic Co-operation and Development (OECD) Nations Spurring Demand for Humane Repellents
The Organization for Economic Co-operation and Development (OECD) policies curbing lethal options, such as the European Union’s ban on lead shot over wetlands, force adopters to pivot toward non-lethal deterrents. Chemical blends featuring food-grade actives like methyl anthranilate receive faster Environmental Protection Agency (EPA) clearances under tolerance exemptions[2]Source: Environmental Protection Agency, “Methyl Anthranilate; Exemption from the Requirement of a Tolerance,” federalregister.gov. Compliance needs outweigh price sensitivity, steering budgets toward rigorously documented, welfare-friendly solutions. Multinationals with in-house regulatory teams secure time-to-market advantages, while smaller rivals often strike licensing deals to stay visible in the bird repellent market.
Vineyard Adoption of Laser-Based Deterrents to Protect Premium Grapes
California trials show laser devices trimming grape losses by 99.8% and saving more than USD 25,000 per installation. Premium wineries calculate the payback within one season, spurring rapid rollout to berries and stone fruit orchards with similar bird-pressure profiles. Vendors now bundle lasers with micro-weather stations, allowing site-specific scheduling that limits neighborhood light trespass. Demonstrated success in grapes offers a “halo effect” for other high-value crops, nudging the bird repellent industry toward capital-equipment models and multi-year service contracts.
Urban Rooftop Farming Expansion Creates New Market Opportunities
High-rise growers value quiet, aesthetic, and low-maintenance deterrents. Rentokil Initial’s purchase of HiCare Services in India, earning INR 800 million (USD 10 million), underscores rising service revenues in dense cities in 2024. Gel strips, transparent nets, and odorless sprays win favor among property managers keen to avoid resident complaints. Building-integrated systems, hidden within planters or ledges, also protect façades from corrosive droppings. Urban farming, therefore, injects new specifications, appearance, and compact size into product design across the bird repellent market.
Restraints Impact Analysis*
| Restraint | (~) % Impact on CAGR Forecast | Geographic Relevance | Impact Timeline |
|---|---|---|---|
| Short product life cycle of chemical repellents due to weathering | -0.7% | Global, with higher impact in tropical regions | Short term (≤ 2 years) |
| Strict EU REACH limits on active ingredients | -0.5% | Europe primarily, with global supply chain effects | Long term (≥ 4 years) |
| Growing consumer backlash against ultrasonic noise pollution | -0.4% | North America and Europe | Medium term (2-4 years) |
| Fragmented regulatory standards hindering global product certification | -0.3% | Global, with highest impact on smaller companies | Long term (≥ 4 years) |
| Source: Mordor Intelligence | |||
Short Product Life Cycle of Chemical Repellents Due to Weathering
Sun, rain, and dust degrade common actives like methyl anthranilate, forcing re-treatments that inflate per-acre costs. Photodegradation in full sun can halve efficacy within days, as documented in field studies on cherries, blueberries, and grapes. Frequent spraying strains labor schedules and pushes growers toward durable but pricier encapsulated formulas. Tropical regions feel the pinch hardest, slowing uptake and dragging on the bird repellent market CAGR.
Strict EU REACH Limits on Active Ingredients
Incremental REACH updates now scrutinize polycyclic aromatic hydrocarbons and other synthetic compounds, prompting withdrawals or reformulations[3]Source: Publications Office of the European Union, “Commission Regulation (EU) 2025/660…,” eur-lex.europa.eu. Development teams must invest in costly toxicology dossiers, and smaller brands often exit rather than fund new data packages. Supply chains adjust by switching to bio-based inputs, but these replacements sometimes deliver weaker performance, risking user dissatisfaction and limiting bird repellent market adoption in the European bloc.
*Our forecasts treat driver/restraint impacts as directional, not additive. The impact forecasts reflect baseline growth, mix effects, and variable interactions.
Segment Analysis
By Product Type: Natural Solutions Gain Regulatory Advantage
Chemical bird repellent formulations led the segment with 54.0% of the bird repellent market size in 2024, underscoring their long-established efficacy and lower cost per treated acre. The natural or organic bird repellents, reinforced by the Environmental Protection Agency (EPA) tolerance exemptions for food-grade compounds, record a 15.2% CAGR and are capturing vineyards, organic farms, and premium produce niches. Many growers now run side-by-side trials, reserving chemicals for staple grains while applying plant-derived actives to high-value plots. This dual-track strategy reduces residual risks and supports eco-label claims.
Hybrid blends, pairing natural actives with synthetic stabilizers, aim to reconcile efficacy with regulatory favor. Though approval pathways are complex, early adopters view them as insurance against future bans. As global rules tighten, natural solutions sit at the center of product roadmaps, signaling a gradual reshaping of bird repellent market demand.


By Form: Gels Emerge as Urban Application Leader
Sprays remained the workhorse in 2024 with a 37.0% of the bird repellent market share, buoyed by widespread equipment compatibility and quick coverage over row crops. The gels and pastes, growing at 16.0% CAGR, now lead rooftop farms, shopping centers, and heritage buildings that cannot tolerate overspray or visible residue. Their high viscosity allows precise bead placement on ledges and signage, lasting months despite rain.
Urban pest-control contractors bundle gel application with façade cleaning and maintenance, carving out recurring revenue. The acoustics and lasers complement gels in integrated packages that satisfy building codes. The outcome is a diversifying form-factor landscape where end-use context, not price, drives selection across the bird repellent market.
By End-Use: Non-Agricultural Segment Drives Innovation
Agriculture still contributes 52.2% of the bird repellent market share in 2024, reflecting vast acreages and direct crop-loss risk. Non-agricultural applications represent the fastest-growing segment, with a 13.5% CAGR through 2030, driven by urban development, infrastructure protection, and emerging applications in renewable energy installations. The non-agricultural segment encompasses a diverse range of applications, including commercial buildings, residential properties, airports, and solar installations, each requiring specialized product formulations and application methods.
The growth in non-agricultural applications has been catalyzed by increasing awareness of bird-related infrastructure damage and the associated maintenance costs. Commercial building managers are increasingly recognizing bird control as a preventive maintenance strategy that reduces cleaning costs, structural damage, and liability risks associated with slip hazards caused by bird droppings. The integration of bird repellent systems with building management technologies, including automated application systems and monitoring sensors, has created new service opportunities that extend beyond traditional pest control. Within agriculture, the segment continues to evolve toward precision applications that target specific crop growth stages and high-value areas, optimizing protection while minimizing input costs and environmental impact.

Geography Analysis
North America’s 33.4% share in 2024 stems from broadacre grains, specialty fruit belts, and strict aviation mandates that turn bird control into routine practice. The United States Department of Agriculture (USDA) studies showing USD 800,000-plus annual regional losses strengthen the business case for preventive investment. With users demanding data-validated products, suppliers emphasize efficacy trials, drone imagery, and ROI calculators. The region’s 9.2% CAGR thus arises less from acreage growth and more from upgrades to higher value solutions within the bird repellent market.
Asia-Pacific, expanding at 13.1% CAGR, benefits from rapid mechanization, orchard expansion, and a surge in rooftop farms that need discreet deterrents. Acquisition activity, such as Rentokil Initial’s INR 800 million (USD 10 million) HiCare deal, illustrates rising urban service revenues. Diverse climates and fragmented regulations also open space for local innovators who tailor blends to regional crops and weather patterns.
Europe grows steadily at 8.6% CAGR, driven by welfare-centric rules that favor humane and low-toxic products. Laser units in French and Italian vineyards, credited with 99.8% damage reduction, highlight the region’s appetite for high-tech deterrents. Tight REACH oversight pressures suppliers to accelerate bio-based R&D or risk withdrawal, which is a dynamic that shapes product portfolios across the bird repellent industry.

Competitive Landscape
The sector remains moderately concentrated, with Bird-X Inc., Rentokil Initial plc, Bird Control Group BV, Pelsis Group, and Bird Barrier America Inc. capturing a significant 60% of the revenue share in 2024. Market leaders leverage multi-channel distribution, R&D hubs, and regulatory muscle to shape industry standards. Rentokil Initial’s new Dallas Innovation Centre supports 75 projects, including AI-driven bird solutions, underscoring the strategic role of in-house science.
Acquisition remains a favored route to new geographies and technologies. Rentals and software firms enter via partnerships that blend detection analytics with deterrent hardware in 2024. Meanwhile, niche players focusing on single crops or local regulations find room by offering tailored, consultancy-heavy packages. Overall, differentiation pivots on efficacy data, low environmental impact, and ease of integration with farm and building management systems, factors central to ongoing competition in the bird repellent market.
The competitive landscape increasingly favors companies with strong regulatory capabilities, as evidenced by the Environmental Protection Agency (EPA)'s ongoing registration processes for new active ingredients and formulations, which require extensive technical documentation and safety assessments. Technology convergence has created opportunities for new entrants from adjacent industries, including agricultural technology companies and building automation specialists who can integrate bird control with existing management systems.
Bird Repellent Industry Leaders
Bird-X Inc.
Bird Control Group BV
Rentokil Initial plc
Pelsis Group
Bird Barrier America Inc.
- *Disclaimer: Major Players sorted in no particular order

Recent Industry Developments
- June 2024: Rentokil Initial established its first North American Pest Control Innovation Center in Dallas to develop sustainable bird control solutions. This center focuses on the research and development of advanced methods to address bird-related pest issues, prioritizing environmental sustainability.
- May 2024: Bayer launched Ibisio, a biological bird repellent containing Black Pepper Oleoresin, with registrations in Ukraine and emergency approvals in Italy and Switzerland. Field tests demonstrated 33% more healthy plants compared to standard treatments, with full European registrations projected by 2026.
- April 2024: Rentokil Initial acquired HiCare Services, India's second-largest pest control company, for approximately INR 800 million (USD 10 million), strengthening its position in the rapidly growing Indian market and expanding bird control service capabilities in urban environments.


Global Bird Repellent Market Report Scope
| Chemical Bird Repellents |
| Natural or Organic Bird Repellents |
| Sprays |
| Gels and Pastes |
| Granules and Powders |
| Strips, Tapes, and Patches |
| Agriculture | |
| Non-Agriculture | Commercial Buildings |
| Residential |
| North America | United States |
| Canada | |
| Rest of North America | |
| South America | Brazil |
| Argentina | |
| Rest of South America | |
| Europe | Germany |
| France | |
| United Kingdom | |
| Russia | |
| Rest of Europe | |
| Asia-Pacific | China |
| India | |
| Japan | |
| Australia | |
| Rest of Asia-Pacific | |
| Middle East | Saudi Arabia |
| United Arab Emirates | |
| Rest of Middle East | |
| Africa | South Africa |
| Kenya | |
| Rest of Africa |
| By Product Type | Chemical Bird Repellents | |
| Natural or Organic Bird Repellents | ||
| By Form | Sprays | |
| Gels and Pastes | ||
| Granules and Powders | ||
| Strips, Tapes, and Patches | ||
| By End-Use | Agriculture | |
| Non-Agriculture | Commercial Buildings | |
| Residential | ||
| By Geography | North America | United States |
| Canada | ||
| Rest of North America | ||
| South America | Brazil | |
| Argentina | ||
| Rest of South America | ||
| Europe | Germany | |
| France | ||
| United Kingdom | ||
| Russia | ||
| Rest of Europe | ||
| Asia-Pacific | China | |
| India | ||
| Japan | ||
| Australia | ||
| Rest of Asia-Pacific | ||
| Middle East | Saudi Arabia | |
| United Arab Emirates | ||
| Rest of Middle East | ||
| Africa | South Africa | |
| Kenya | ||
| Rest of Africa | ||


Key Questions Answered in the Report
What is the current size of the bird repellent market?
The bird repellent market size stands at USD 403.8 million in 2025 and is forecast to reach USD 501.7 million by 2030.
Which product type dominates the bird repellent market?
Chemical bird repellents dominate with a 54.0% share in 2024, though natural formulations are growing faster.
How fast is Asia-Pacific’s bird repellent market expanding?
Asia-Pacific is projected to grow at a 13.1% CAGR through 2030, the fastest among all regions.
Why are gels gaining popularity in urban bird control?
Gels adhere well to building surfaces, last longer than sprays, and meet aesthetic requirements for rooftop farms and commercial properties. Gels adhere well to building surfaces, last longer than sprays, and meet aesthetic requirements for rooftop farms and commercial properties.
How do regulations influence product innovation?
Strict rules, such as EU REACH limits, push companies to develop bio-based or non-chemical solutions and favor firms with strong regulatory expertise.
Page last updated on:


