
Turf Protection Market Size and Share
Market Overview
| Study Period | 2021 - 2031 |
|---|---|
| Market Size (2026) | USD 9.29 Billion |
| Market Size (2031) | USD 12.91 Billion |
| Growth Rate (2026 - 2031) | 6.79 % |
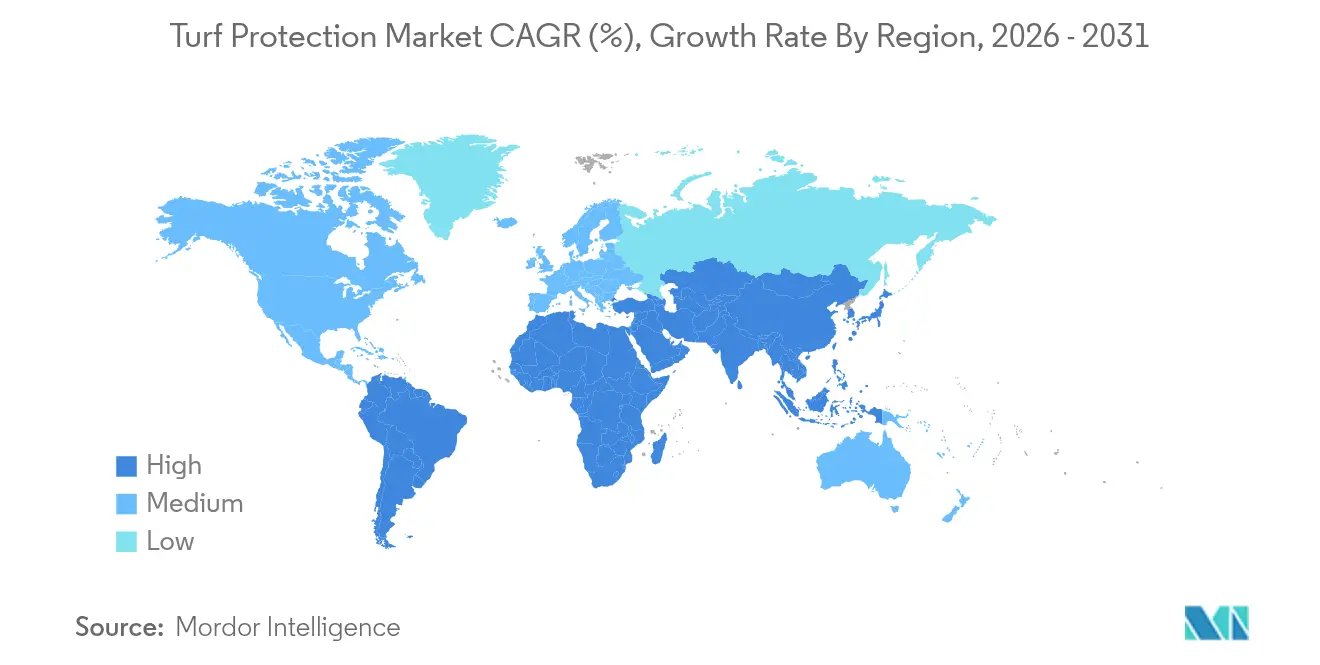
| Fastest Growing Market | Asia Pacific |
| Largest Market | North America |
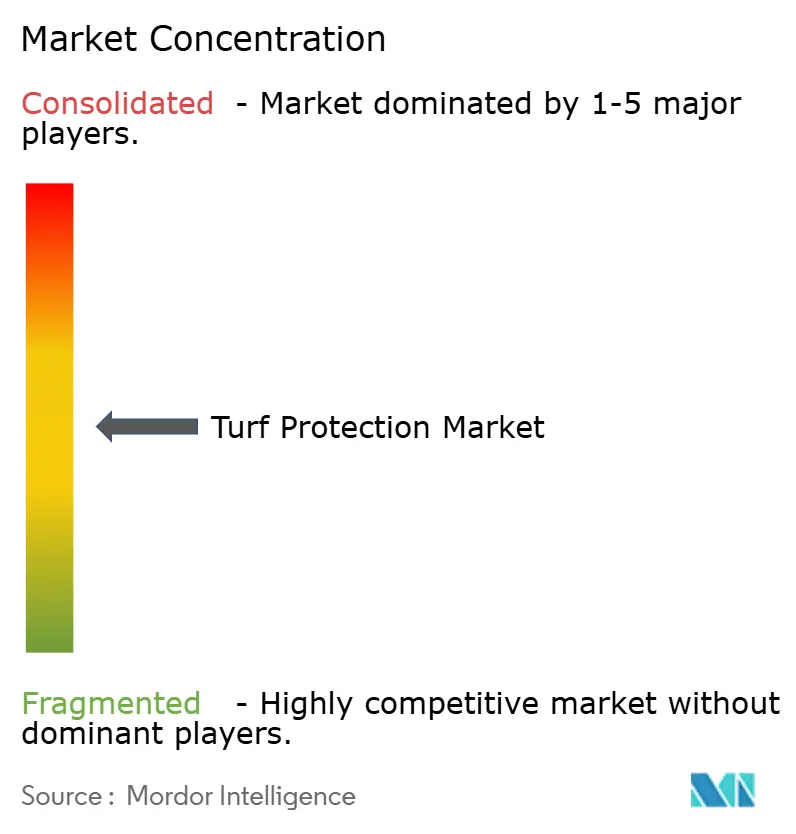
| Market Concentration | Medium |
Major Players *Disclaimer: Major Players sorted in no particular order Image © Mordor Intelligence. Reuse requires attribution under CC BY 4.0. | |
Turf Protection Market Analysis by Mordor Intelligence
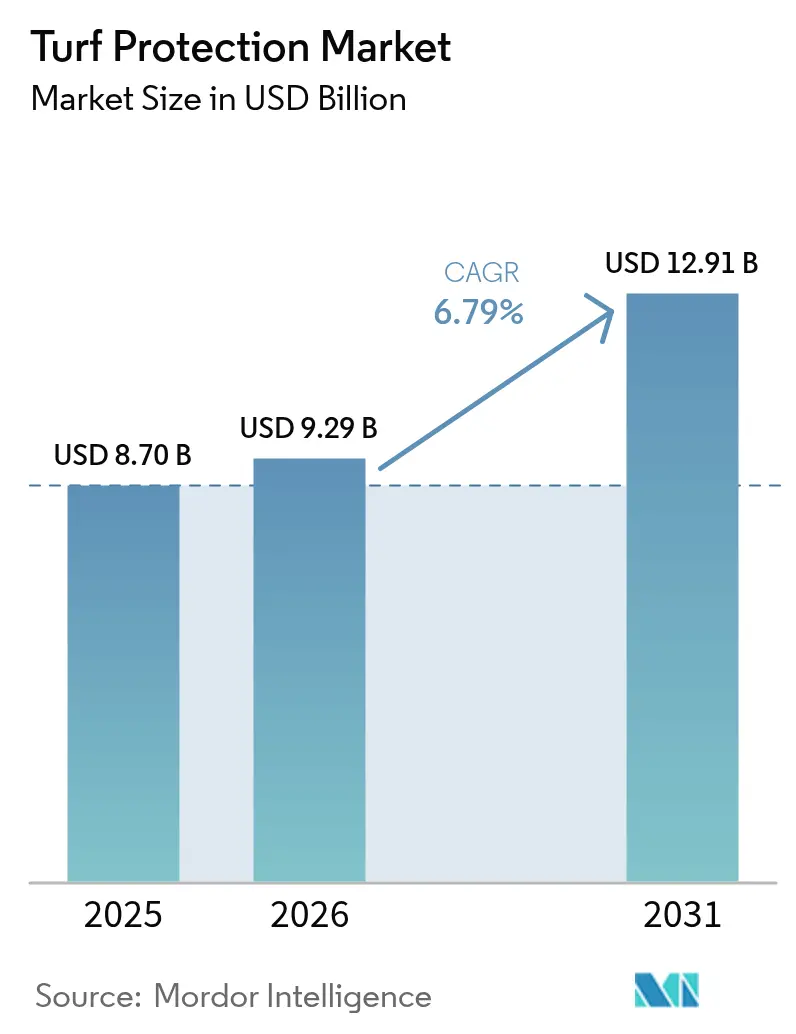
The turf protection market size was valued at USD 8.7 billion in 2025 and estimated to grow from USD 9.29 billion in 2026 to reach USD 12.91 billion by 2031, at a CAGR of 6.79% during the forecast period (2026-2031). This expansion reflects accelerating investment in golf courses, professional sports venues, and high-end residential landscapes that demand resilient, visually appealing playing and leisure surfaces. Rising climate volatility, stricter player-safety standards, and the shift toward integrated pest management programs are driving demand for advanced fungicides, biostimulants, and precision application technologies. Biological products are experiencing double-digit growth as regulators scrutinize synthetic chemistries and owners seek to reduce their environmental footprints. The top five suppliers account for the majority share of global revenue, with Syngenta accounting for the highest share, followed by Bayer CropScience. However, fragmentation still enables regional specialists to penetrate niches such as biostimulants and precision-sensor packages. North America maintains its leadership due to a mature sports infrastructure and high household spending on lawn care, while the Asia-Pacific region logs the fastest gains as urbanization and mega-facility construction spur incremental demand.
Key Report Takeaways
- By product type, fungicides led with a 37.50% share of the turf protection market in 2025, while biostimulants are projected to rise at a 10.81% CAGR through 2031.
- By application, landscaping accounted for 42.10% of the turf protection market size in 2025, while sports fields are forecast to expand at a 9.36% CAGR by 2031.
- By end-user, residential customers held 45.40% of the turf protection market share in 2025, whereas sports facility owners are set to record a 8.92% CAGR between 2026 and 2031.
- By mode of action, chemical formulations captured 71.20% of revenue in 2025, but biological solutions are advancing at a 11.59% CAGR.
- By formulation, liquid concentrates represented 57.30% of sales in 2025 and will post a 10.32% CAGR over the forecast horizon.
- By region, North America held 34.70% of the turf protection market in 2025, while Asia-Pacific will accelerate at an 8.32% CAGR through 2031.
- By company, the five largest players collectively controlled majority share of the turf protection market in 2025, with Syngenta being one of the prominent players followed by Bayer CropScience.
Note: Market size and forecast figures in this report are generated using Mordor Intelligence’s proprietary estimation framework, updated with the latest available data and insights as of 2026.
Market Trends and Insights
Drivers Impact Analysis of Turf Protection Market*
| Driver | (~) % Impact on CAGR Forecast | Geographic Relevance | Impact Timeline |
|---|---|---|---|
| Rising construction of golf courses and professional sports venues | +1.8% | Global, highest in Asia-Pacific and the Middle East | Medium term (2-4 years) |
| Increasing incidence of turfgrass diseases | +1.5% | North America and Europe | Short term (≤ 2 years) |
| Growing residential demand for aesthetic lawns | +1.2% | North America and Europe | Medium term (2-4 years) |
| Shift toward biological fungicides and biostimulants | +1.0% | Europe and North America | Long term (≥ 4 years) |
| Adoption of sensor-based precision turf management | +0.8% | North America, Europe, and developed Asia-Pacific | Long term (≥ 4 years) |
| Climate-change-induced heat-stress mitigation solutions | +0.9% | Warmer global regions | Long term (≥ 4 years) |
| Source: Mordor Intelligence | |||
Rising construction of golf courses and professional sports venues
Capital allocations for new facilities surged after the pandemic, particularly across India, China, and Gulf states, creating steady pull-through demand for hybrid turf systems that balance durability with natural playability. Professional leagues have formalized surface-quality metrics, prompting venue owners to specify fungicides, plant growth regulators, and stress-mitigation products that pass stricter safety tests. Once built, each venue requires season-long disease control, anchoring recurring revenue for suppliers. Developers also lean on integrated packages that bundle seed, nutrition, and digital monitoring, opening cross-selling opportunities in the turf protection market.
Increasing incidence of turfgrass diseases
Milder winters and prolonged humidity are intensifying outbreaks of dollar spot and brown patch, prompting superintendents to adopt dynamic rotation programs that respond to real-time pathogen pressure instead of calendar schedules. Research shows tall fescue plots receiving high nitrogen suffer 40% higher brown patch severity than moderately fertilized turf, underscoring the need for balanced nutrition strategies. Advanced diagnostic kits and AI models now detect dollar spot with 97% accuracy, enabling earlier interventions and optimized fungicide loads. The trend is pushing the turf protection industry toward predictive analytics and site-specific treatments that preserve beneficial soil organisms.
Growing residential demand for aesthetic lawns
Homeowners increasingly view lawn quality as an asset that supports property valuation and outdoor lifestyles. Products such as Primo Maxx cut mowing frequency by up to 50% while thickening turf canopies, positioning growth regulators as a retail staple. Drought regulations in western states favor low-maintenance, water-efficient blends supplemented with biostimulants. Retailers are widening their premium shelves, letting do-it-yourself consumers access formerly trade-only technologies, which further broadens the turf protection market.
Shift toward biological fungicides and biostimulants
Environmental policy and public pressure against synthetic residues are propelling biological inputs. Corteva’s Bexfond forms microbial bio-barriers that suppress soil pathogens and stimulate root vigor, exemplifying next-generation offerings. The European Union’s microplastic restrictions on artificial turf are also nudging facility owners toward natural surfaces fortified with bio-solutions. Enhanced shelf stability, easy-to-mix formulations, and evidence of improved drought tolerance have expanded adoption among high-end courses and sports complexes.
Restraints Impact Analysis of Turf Protection Market*
| Restraint | (~) % Impact on CAGR Forecast | Geographic Relevance | Impact Timeline |
|---|---|---|---|
| Rapid penetration of artificial turf solutions | −1.2% | Global, water-scarce regions | Medium term (2-4 years) |
| High research and development cost for novel chemistries | −0.8% | Global | Long term (≥ 4 years) |
| Regulatory pressure on conventional fungicides | −1.0% | Europe and North America | Short term (≤ 2 years) |
| Micro- and nanoplastic pollution concerns from turf inputs | −0.6% | Europe, North America, Australia | Medium term (2-4 years) |
| Source: Mordor Intelligence | |||
Rapid penetration of artificial turf solutions
Synthetic fields eliminate routine mowing and pesticide spending, enticing school boards and municipalities wrestling with labor and water constraints. Installations in the United States now run between 1,200 and 1,500 per year[1]. Nonetheless, PFAS contamination findings and microplastic-shed estimates of 16,000 tons annually in Europe have triggered policy reviews that could stall conversions and breathe life into natural alternatives. Turf protection vendors are responding with hybrid technology and communication campaigns highlighting the health and sustainability benefits of natural systems.
Regulatory pressure on conventional fungicides
The United States Environmental Protection Agency’s interim decision on chlorothalonil imposes tighter application windows and label amendments, pressuring distributors to reformulate portfolios[2]. Europe’s Sustainable Use Regulation similarly restricts the use of certain strobilurins. These moves accelerate the migration to integrated programs but could temporarily dampen sales of legacy products.
*Our forecasts treat driver/restraint impacts as directional, not additive. The impact forecasts reflect baseline growth, mix effects, and variable interactions.
Turf Protection Market Segment Analysis
By Product Type:
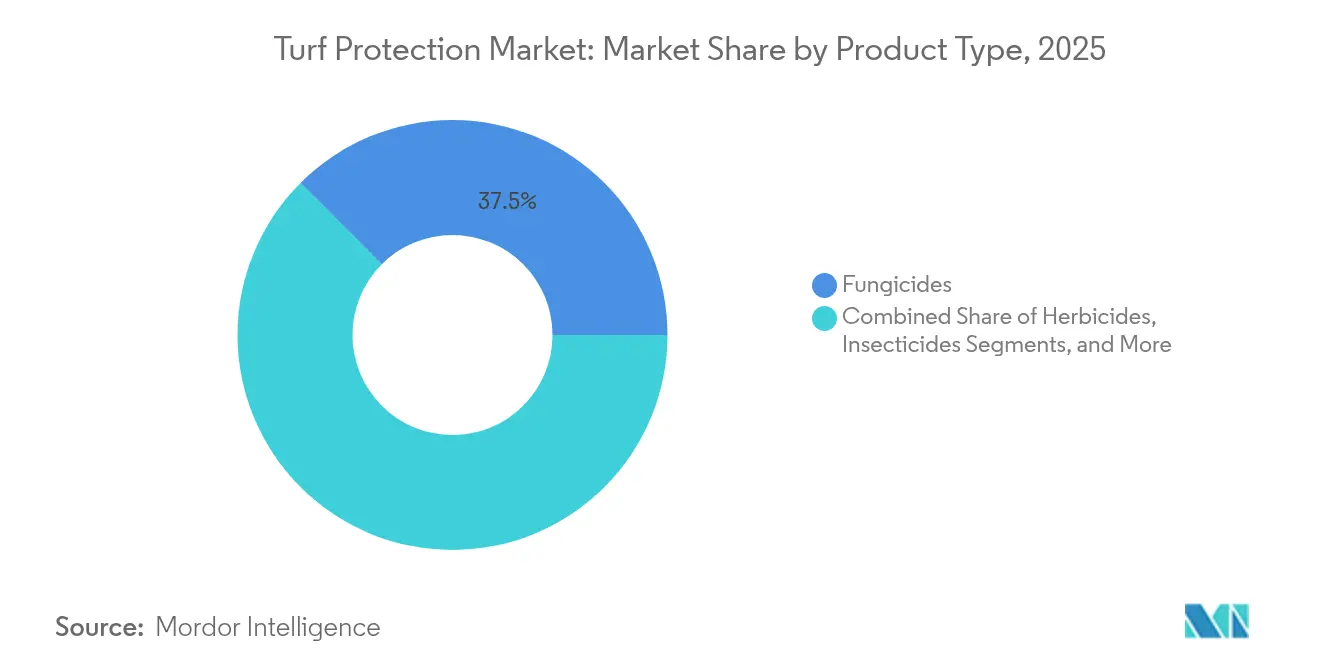
Biologicals Drive InnovationFungicides generated the largest slice of turf protection market revenue with a 37.50% share in 2025, reflecting the continual threat of dollar spot, brown patch, and Pythium. Sophisticated rotation plans mixing SDHI, QoI, and DMI chemistry remain indispensable for courses aiming to maintain tournament-grade surfaces. However, biostimulants, posting an 10.81% CAGR, highlight the market’s pivot toward sustainable inputs backed by proven stress tolerance and root health gains. Herbicides hold a prominent share in total demand as managers tackle annual bluegrass and broadleaf weeds, while plant growth regulators find traction by trimming mower fuel and labor costs.
The turf protection market size for plant growth regulators is poised to expand in tandem with heightened labor constraints and sustainability targets. Iron-based alternatives and microbial cocktails now supplement conventional fungicides, demonstrating equivalent dollar spot suppression with lower environmental risk. Biologicals and synthetics are spawning co-formulations that enhance uptake and persistence, broadening choice for superintendents.

By Application:
Sports Fields Accelerate GrowthLandscaping maintained 42.10% of overall demand in 2025, supported by steady residential and commercial spending on curb appeal. Product mixes focus on broad-spectrum weed control, slow-release nutrition, and colorants that deliver a uniform appearance. In contrast, sports fields are leading the growth table with a 9.36% CAGR, as franchises and universities prioritize athlete safety and surface consistency. The NFL’s push for standardized field testing is already shaping purchasing specifications toward high-performance fungicide programs and hybrid overseeding blends.
The turf protection market size dedicated to golf courses holds a significant share, but growth plateaus relative to sports arenas, as many mature courses transition from capital expansion to a renovation mode. Sod farms, while niche, exert influence through their role in supplying disease-free sod that demands intensive pest control.
By End-User:
Facility Owners Lead Precision AdoptionHomeowners purchased 45.40% of turf protection products in 2025, reflecting easy access to pro-grade formulations through big-box and e-commerce outlets. Clear labeling, hose-end sprayers, and subscription lawn-care kits simplify adoption, feeding segment momentum. Sports facility owners, expanding at a 8.92% CAGR, reflect the surge in semi-professional leagues and community recreation complexes that demand stadium-quality surfaces.
Commercial landscape contractors are another segment that holds significant demand and is increasing their bundling of agronomic consulting, irrigation installations, and digital monitoring into service contracts. Private-equity investment is driving consolidation among contractors, facilitating bulk procurement and vendor partnerships that influence the dynamics of the turf protection market.
By Formulation:
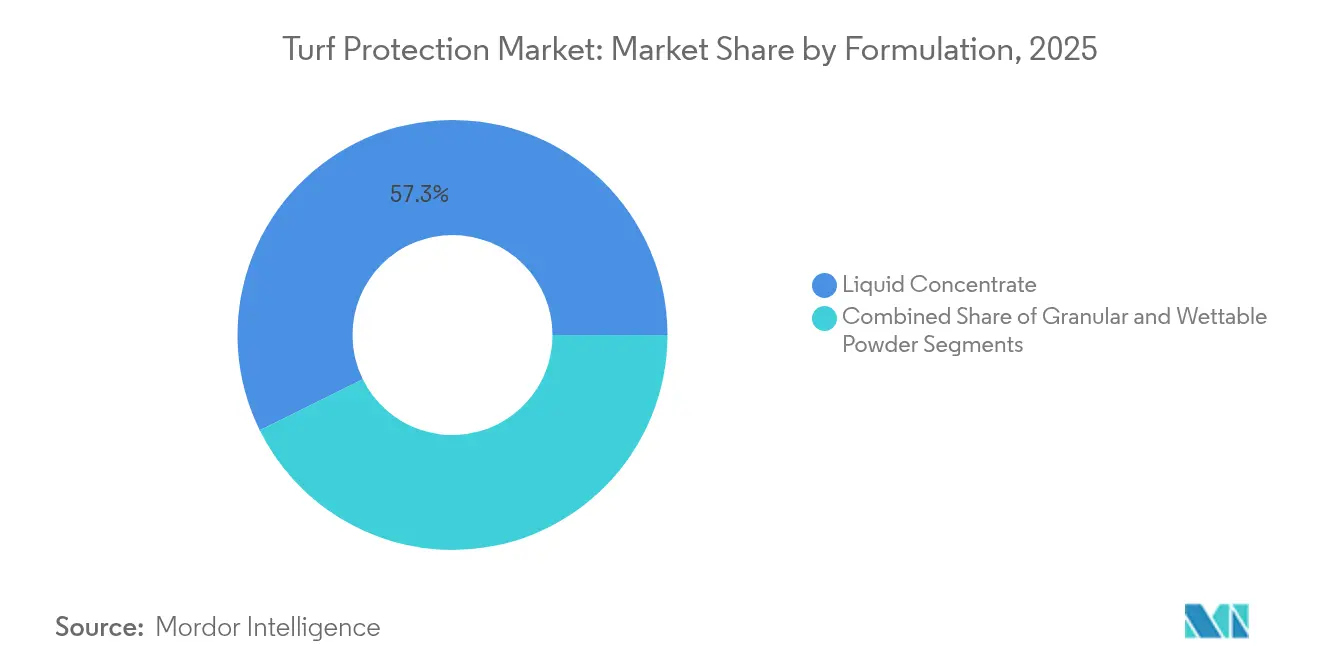
Liquid Concentrates DominateLiquid concentrates captured 57.30% of sales in 2025 and posted the fastest growth, at a 10.32% CAGR, because they dissolve quickly, support tank mixes, and suit precision booms. Encapsulation advances such as Corteva’s Enversa 3CS extend residual life and crop safety, making liquids even more attractive. Granulars still play a vital role in pre-emergent herbicide programs and combination fertilizer products, which are favored for their slow release and ease of application through broadcast spreaders.
Ultra-low-volume liquids are emerging, requiring less carrier and supporting drone-based treatments. Such innovation aligns with sustainability goals and labor savings, reinforcing the leading position of liquid concentrates in the turf protection market.
By Mode of Action:
Integrated Solutions Gain TractionChemicals still accounted for 71.20% of revenue in 2025, driven by broad-spectrum activity and predictable results. Yet, biological inputs are growing at a 11.59% CAGR, as university trials demonstrate performance against Rhizoctonia and Fusarium that is comparable to synthetics. Integrated programs blending Bacillus strains with reduced-rate fungicides deliver resistance management benefits and environmental relief.
The turf protection market share for pure biologicals is anticipated to increase as pending reviews of older actives prompt buyers to opt for lower-risk options. Ultraviolet treatments and heat-shock applications appear on the horizon as non-chemical complements, underscoring the market’s continuous diversification.
Geography Analysis
North America Turf Protection Market
North America retained 34.70% of global revenue in 2025, anchored by more than 15,000 golf courses and one of the world’s largest portfolios of professional stadiums. The United States represents roughly 90% of regional demand and benefits from the early adoption of IoT soil probes and AI spray scheduling tools. Canada’s shorter growing window concentrates disease outbreaks into intense summer peaks, encouraging premium fungicide programs. Mexico’s resort corridors channel investment into salt-tolerant turf cultivars and fertility programs that thrive in coastal soils.
APAC Turf Protection Market
Asia-Pacific is projected to clock an 8.32% CAGR, the fastest worldwide. China’s research institutes are expanding germplasm collections for stress-resistant turf, but course operators still import many premium cultivars. India’s urban golf and cricket infrastructure underpins robust demand for fungicide and growth-regulator packages capable of withstanding monsoon swings. Japan’s mature golf scene is pivoting toward precision irrigation and biological inputs to meet government sustainability targets. Australian course managers face stringent water quotas, increasing reliance on wetting agents and drought-resilient blends to safeguard playing quality.
Europe Turf Protection Market
Europe remains a technology- and regulation-driven arena. The European Commission’s push for sustainable pesticide use and microplastic bans incentivizes biological programs and biodegradable carriers. Germany and the United Kingdom spearhead the uptake of connected-sensor networks that fine-tune fungicide timing. France’s grounds crews are early adopters of biostimulant seed treatments to comply with national pesticide-reduction objectives, showcasing how policy influences procurement choices.
Regulatory Landscape
Turf protection suppliers operate under pesticide and biopesticide registration rules that increasingly tighten labels, formulations, and monitoring across major markets. In the European Union, Commission Regulation (EU) 2026/1123 (May 26, 2026) mandates new labelling requirements for plant protection products aligned with CLP (Regulation (EC) No 1272/2008), while Regulation (EU) 2026/1120 (May 26, 2026) prohibits twelve co-formulants in plant protection products with authorization withdrawals required by June 16, 2028. EU control and surveillance continues through Commission Implementing Regulation (EU) 2026/748 (March 31, 2026), which sets the coordinated multiannual control programme for pesticide residue monitoring for 2027 to 2029 and raises compliance and documentation demands across supply chains.
Outside the EU, subnational and national actions are reshaping turf portfolios and integrated pest management choices. New Yorks Birds and Bees Protection Act requires a phase-out of neonicotinoid use (including imidacloprid, thiamethoxam, and acetamiprid) in outdoor turf and ornamental applications effective December 31, 2026, shifting distributors and professional applicators toward alternative insect control strategies. In India, a draft order issued July 14, 2026 under the Insecticides Act, 1968 proposes a nationwide ban on Paraquat Dichloride, reinforcing the broader trend of higher scrutiny on legacy chemistries and accelerating interest in lower-risk actives and biological programs where registration pathways and product claims support use on turf and ornamentals.
Competitive Landscape
The turf protection market is moderately fragmented the top five suppliers combined hold a significant share. Syngenta Group leads with leveraging the Heritage fungicide franchise and GreenCast digital advisory platform. Bayer AG follows by differentiates itself through a combination of chemical and biological pipelines. BASF ranks third, distinguishing itself throughdistinguishing itself through AI-powered decision support tools and substantial research and development funding.
Consolidation is gaining pace. Envu’s 2024 purchase of FMC’s turf division expanded its footprint in professional segment fungicides and insecticides. Bigger players are also pouring resources into biologicals; Corteva’s launch of Bacillus-based Bexfond and Syngenta’s acquisition of Valagro exemplify the pivot. Smaller innovators compete on specialization, offering niche growth regulators or stress-tolerance enhancers that large players may later acquire.
Technology is an increasingly decisive battleground. BASF’s Xarvio suite couples weather analytics with disease models to boost spray precision, while Syngenta Group pilots machine-vision scouting robots. Partnerships with sensor manufacturers and software developers are common as vendors strive to integrate their product portfolios with real-time agronomic advice, thereby deepening customer lock-in and expanding recurring revenue streams.
Turf Protection Industry Leaders
-
Syngenta Group
-
Bayer AG
-
BASF SE
-
UPL Limited
-
Corteva Agriscience
- *Disclaimer: Major Players sorted in no particular order
Turf Protection Market Companies Covered in this Report
- Syngenta Group
- Bayer AG
- BASF SE
- UPL Limited
- Nufarm Limited
- AMVAC Chemical Corporation
- Sumitomo Group
- Bioceres LLC (Morrone Bio Innovations)
- ICL Group
- FMC Corporation
- Corteva Agriscience
- SePRO Corporation
- Gowan Company, L.L.C.
- Koch Agronomic Services, LLC
- LebanonTurf (Lebanon Seaboard Corporation)
Market Opportunities and Future Outlook
Regulatory and label changes are creating near-term space for reformulations, alternative modes of action, and biological or integrated programs tailored to professional turf and high-value landscaping. In the United States, the EPA federal registration of Syngentas Atexzo insecticide/miticide for golf courses, sod farms, and athletic turf adds a new chemistry option for resistance-management rotations and can be linked with decision support programs such as Syngentas WeevilTrak Plus for annual bluegrass weevil management. Policy actions such as New Yorks neonicotinoid phase-out in outdoor turf and ornamentals (effective December 31, 2026) and Indias July 2026 draft proposal to ban Paraquat Dichloride also underscore demand for replacement solutions that balance efficacy with stewardship, drift mitigation, and improved environmental profiles.
Commercialization is increasingly tied to service-integrated turf protection, with professional buyers moving toward season-long programs rather than standalone products. The market shows pull from precision turf management practices highlighted in the competitive landscape (for example, GreenCast and Xarvio-style advisory approaches), and from the need to manage tighter application windows under more rigorous labels and monitoring regimes. Key opportunities focus on packaged offerings that pair liquid-concentrate formulations (the leading formulation type by 2025 share) with sensor-driven scouting, optimized spray scheduling, and biological add-ons designed to reduce total chemical load while maintaining playability and aesthetic standards for sports fields, golf courses, and premium residential lawns.
Recent Industry Developments in Turf Protection Market
- April 2026: Syngenta received US EPA federal registration for Atexzo insecticide/miticide for use on golf courses, sod farms, and athletic turf. The approval introduces a new chemistry option for turf insect control and supports resistance-management programs where legacy insecticides face tighter stewardship. It also strengthens Syngentas ability to bundle products with its advisory and superintendent-focused programs.
- January 2025: The US Environmental Protection Agency finalized its interim registration review decision for chlorothalonil, tightening use limits and requiring revised labels. Turf managers recalibrated fungicide rotations and application timing to remain compliant, increasing attention on integrated programs and biological complements. Portfolio adjustments by distributors also shifted purchasing toward alternatives that fit new label constraints.
- July 2024: Envu completed its acquisition of FMCs turf assets, expanding its professional turf fungicide and insecticide portfolio and strengthening channel reach into golf, sports fields, and lawn care. The deal increased competitive intensity in the professional segment by broadening Envus product breadth for superintendents and contractors. It also elevated consolidation as a pathway for scale in turf and ornamental protection.
Turf Protection Market Report Scope and Research Methodology
Market Definition and Coverage
For this study, the turf protection market is defined as products and solutions used to prevent, control, and reduce pest, disease, and stress damage in natural turfgrass across residential, commercial, and sports surfaces, with market value measured at the point of sale in USD.
Scope exclusions: Synthetic turf installation materials and heavy temporary event flooring panels are not counted in this market sizing.
Segments Covered in This Report
- By Product Type
- Fungicides
- Herbicides
- Insecticides
- Plant Growth Regulators
- Biostimulants and Bio-fertilizers
- By Application
- Landscaping
- Golf Courses
- Sports Fields
- Sod Farms
- By End-user
- Residential Customers
- Commercial Landscape Contractors
- Sports Facility Owners
- Municipalities and Schools
- By Mode of Action
- Chemical
- Biological
- Integrated Solutions
- By Formulation
- Granular
- Liquid Concentrate
- Wettable Powder
- By Geography
- North America
- United States
- Canada
- Mexico
- Rest of the North America
- South America
- Brazil
- Argentina
- Rest of South America
- Europe
- Germany
- United Kingdom
- France
- Italy
- Spain
- Russia
- Rest of Europe
- Asia-Pacific
- China
- India
- Japan
- Australia
- South Korea
- Rest of Asia-Pacific
- Middle East
- Saudi Arabia
- United Arab Emirates
- Rest of Middle East
- Africa
- South Africa
- Egypt
- Rest of Africa
- North America
Data Sources, Market Sizing, and Validation
Desk Research
Desk work starts with mapping the demand base and the rule environment that shapes what can be applied on turf. We reviewed public sources such as pesticide registration and re-registration databases (for active ingredients and permitted uses), USDA and similar agriculture statistics for relevant input trends, and FAOSTAT style crop and land use series where turf proxies are needed. We also used US EPA documentation and comparable regulators in other regions to understand restrictions, bans, and label changes that can move volumes.
To ground the commercial picture, we referenced company annual reports and investor presentations for portfolio mix and geographic exposure, along with trade association pages and reputable press for new product launches and channel shifts. Patent databases were used to sanity check innovation intensity around biologicals and formulations, and an import and export shipment-level database was used selectively to understand cross-border movement for key turf care chemistries and intermediates. These desk sources are illustrative only, and many other public references were used for data collection, clarification, and validation.
Primary Interviews and Surveys
Primary work was used to convert broad turf activity into realistic purchase behavior, and then to pressure test assumptions that are hard to observe from public datasets. We spoke with stakeholders across manufacturers, distributors, turf managers, agronomists, and applicator networks, and the inputs were checked across APAC, EMEA, and the Americas so regional differences in regulation, seasonality, and price realization were not averaged out.
Distribution of primary research fieldwork respondents
| Company type | Respondent position | Region |
|---|---|---|
| Top tier: 33% | CXOs: 21% | APAC: 40% |
| Mid tier: 46% | Functional/Unit leaders: 26% | EMEA: 33% |
| Smaller Players: 21% | Managers: 53% | Americas: 27% |
Market-Sizing & Forecasting
The sizing model is built using a top-down approach where treated turf area and typical protection spend are reconstructed by region, then split by use settings such as golf, sports fields, landscaping, and sod production. Those totals are corroborated through selective bottom-up approximations, including sampled price per pack or per liter multiplied by realistic application frequency, plus channel checks on product mix to adjust the final value.
Key inputs used in the model include managed turf acreage proxies, season length and weather-driven disease pressure, application intensity by surface type, shifts toward biological solutions, and regulatory changes that impact product availability and dose rates. Pricing is handled through a simple ASP logic by major product groups, then adjusted for mix changes and inflation where it is supported by interview feedback. For forecasting, we apply scenario analysis around regulation and adoption (for example, faster biological uptake versus tighter chemical availability), and the scenario path is selected using consensus signals from primary experts. Where bottom-up checks have gaps, such as limited visibility on small local brands, we apply conservative penetration assumptions and keep them consistent with distributor feedback before finalizing totals.
Data Validation & Update Cycle
Validation is done through multiple checks so single-source bias does not drive the outcome. We compare results against independent signals such as turf activity indicators, regulatory event timelines, and trade movement patterns, then investigate large variances before sign-off. If a number looks out of pattern for a region, the assumptions are re-worked and the relevant respondents are re-contacted to confirm whether it is a real shift or a modeling artifact.
Before publication, the model and narratives go through step-by-step analyst reviews, and the final output is checked for currency consistency and year alignment across all tables. Reports are refreshed annually, and interim updates are made when material events occur, such as major regulatory actions or sharp price movements. Right before delivery, a fresh pass is completed so clients receive the most recently updated view.
Mordor Intelligence's Turf Protection Market Size Compared With Other Published Estimates
Published market sizes for turf protection often vary because the timing and conversion choices inside the model are not the same across publishers, even when the topic name looks identical. Differences show up quickly when exchange rates are taken from different months, when price assumptions are carried forward without being rechecked, or when a study mixes year labels like base, estimate, and forecast.
In practice, the biggest gap drivers are refresh cadence and price realization, since turf inputs can move on regulation news and seasonal demand. Some studies also widen the boundary by adding synthetic turf materials, while others narrow it by focusing only on a few chemical classes or by excluding biologicals and mechanical protection tools. By re-validating ASPs with channel feedback close to the base year and locking currency timing to that same period, Mordor Intelligence reduces drift that can otherwise inflate or suppress the 2026 value.
Benchmark comparison
| Source | Market Size | Gaps in Research Methodology |
|---|---|---|
| Mordor Intelligence | USD 9.29 B (2026) | |
| Global Consultancy A | USD 6.38 B (2025) | Uses a 2025 base year with a different time window, and the page-level definition does not clarify whether mechanical protection tools and certain adjunct inputs are counted, which can narrow the priced basket versus broader turf care coverage. |
| Regional Consultancy B | USD 5.91 B (2023) | Anchors the model to a 2023 base, and the disclosed scope is centered on application buckets, which can miss later price normalization and mix shifts, especially if exchange rates and inflation are not aligned to the sizing year. |
The comparison shows that the spread is mainly explained by year timing and what gets priced into the basket, not by a single dramatic demand assumption. When scope is kept specific to natural turf and prices are refreshed to the same currency window used for the base year, the estimate becomes easier to trace back to treated area, application intensity, and realistic ASPs.
Key Questions Answered in the Report
What is the current value of the turf protection market?
The turf protection market is valued at USD 9.29 billion in 2026.
Which region leads turf protection spending?
North America holds 34.70% of global revenue owing to its dense golf and professional sports infrastructure.
Why are biological turf products growing faster than chemicals?
Regulatory pressure on conventional fungicides and demand for sustainable solutions are propelling biologicals at a 11.59% CAGR.
What application segment is expanding the quickest?
Sports fields post the highest growth at 9.36% CAGR as leagues enforce stricter player -safety and surface-quality standards.
How concentrated is the competitive landscape?
The top five companies command just over half of global sales, indicating moderate concentration and room for niche innovators.
Which formulation type is most popular?
Liquid concentrates lead with a 57.30% share, favored for ease of mixing and compatibility with precision-spray equipment.