Fly Trap Market Size and Share
Market Overview
| Study Period | 2021 - 2031 |
|---|---|
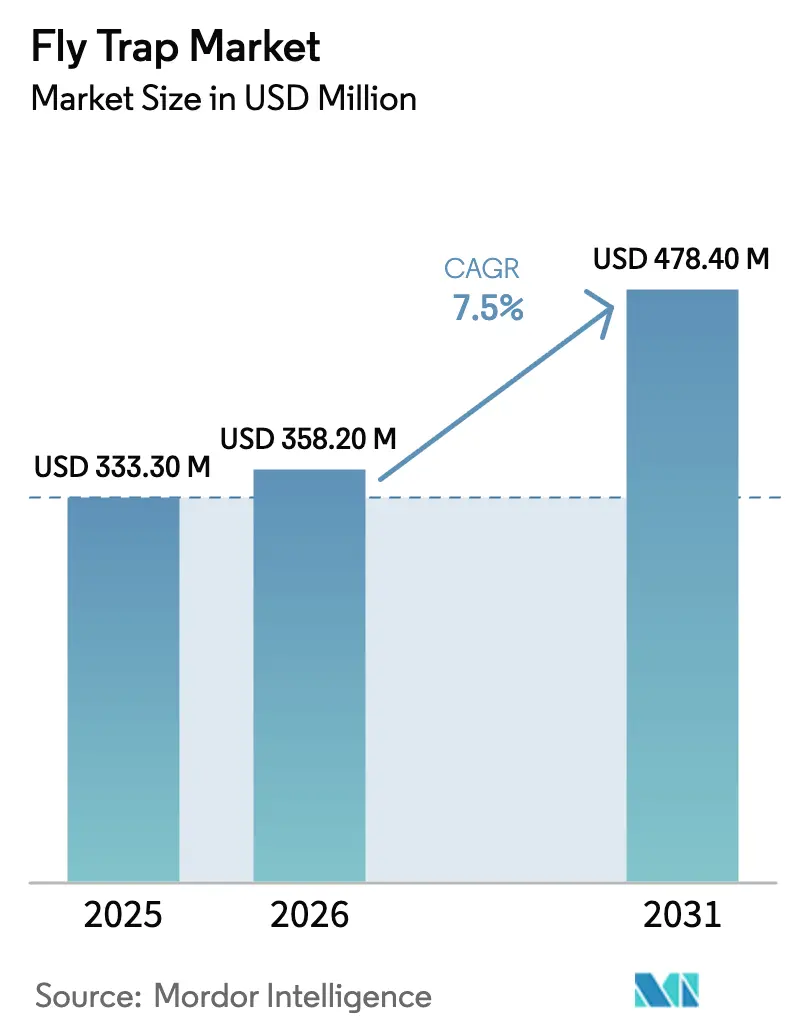
| Market Size (2026) | USD 358.20 Million |
| Market Size (2031) | USD 478.40 Million |
| Growth Rate (2026 - 2031) | 7.50% CAGR |
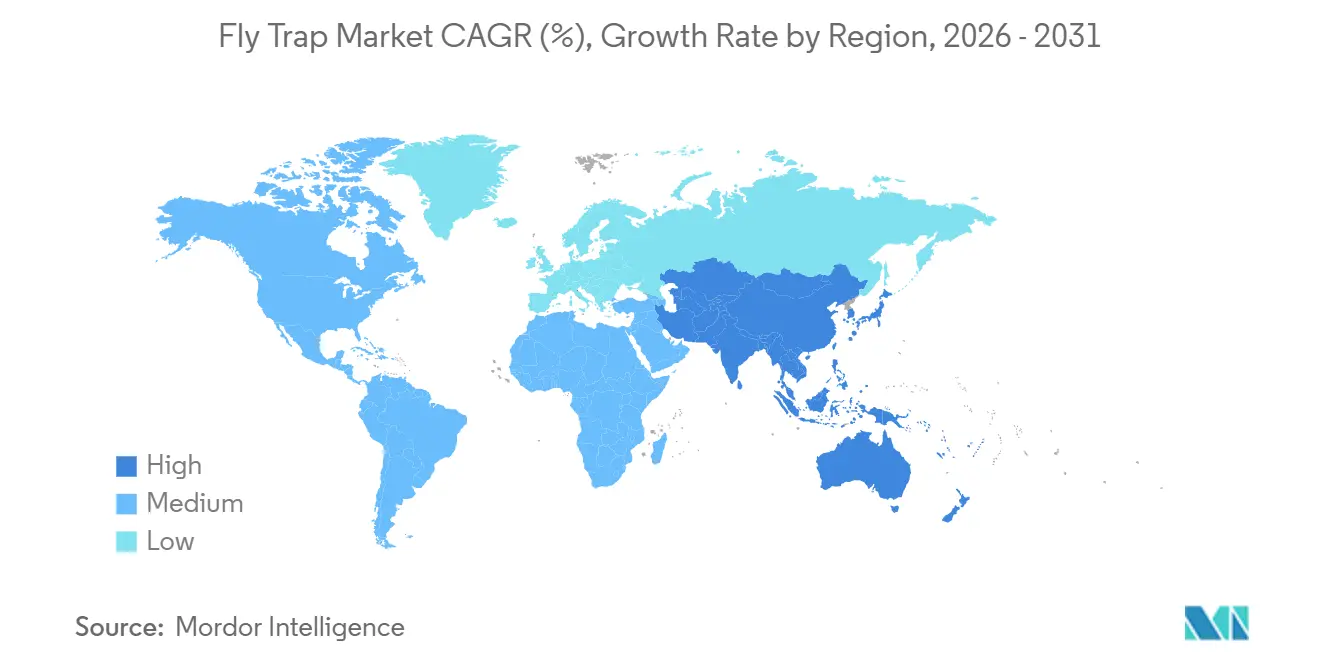
| Fastest Growing Market | Asia Pacific |
| Largest Market | Europe |
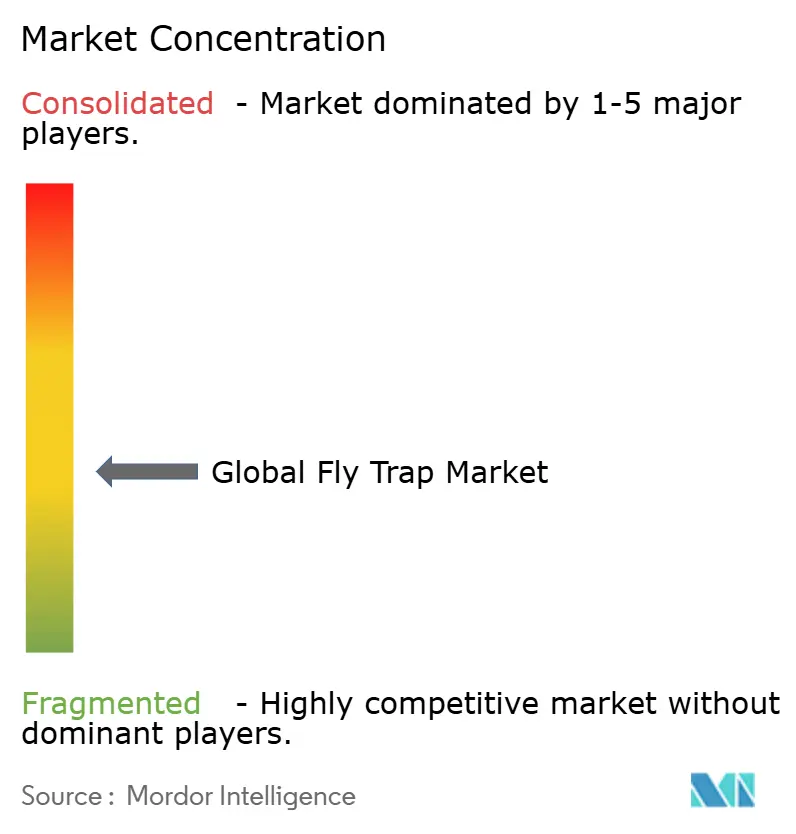
| Market Concentration | Medium |
Major Players *Disclaimer: Major Players sorted in no particular order Image © Mordor Intelligence. Reuse requires attribution under CC BY 4.0. | |
Fly Trap Market Analysis by Mordor Intelligence
The fly trap market size is projected to grow from USD 333.3 million in 2025 to USD 358.2 million in 2026, reaching USD 478.4 million by 2031, with a CAGR of 7.5% during the period 2026-2031. Sticky traps accounted for a significant share of the market due to their affordability and compatibility with organic certification standards. Meanwhile, ultraviolet (UV) light systems are gaining traction as advancements in light-emitting diode (LED) technology improve energy efficiency and reduce non-target mortality. Hybrid devices combining pheromones with visual lures are experiencing rapid growth, driven by increasing resistance in Drosophila suzukii populations in certain orchards. Regulatory restrictions on pesticide residues in regions such as Europe, Japan, and North America are further driving adoption. Subsidy programs in regions like China, the European Union, and the United States are encouraging trials that often lead to long-term use. Competitive intensity is rising as biological control specialists and traditional pest management companies target the same customer base. Several established players are incorporating Internet of Things (IoT) sensors to differentiate their products from commoditized offerings.
Key Report Takeaways
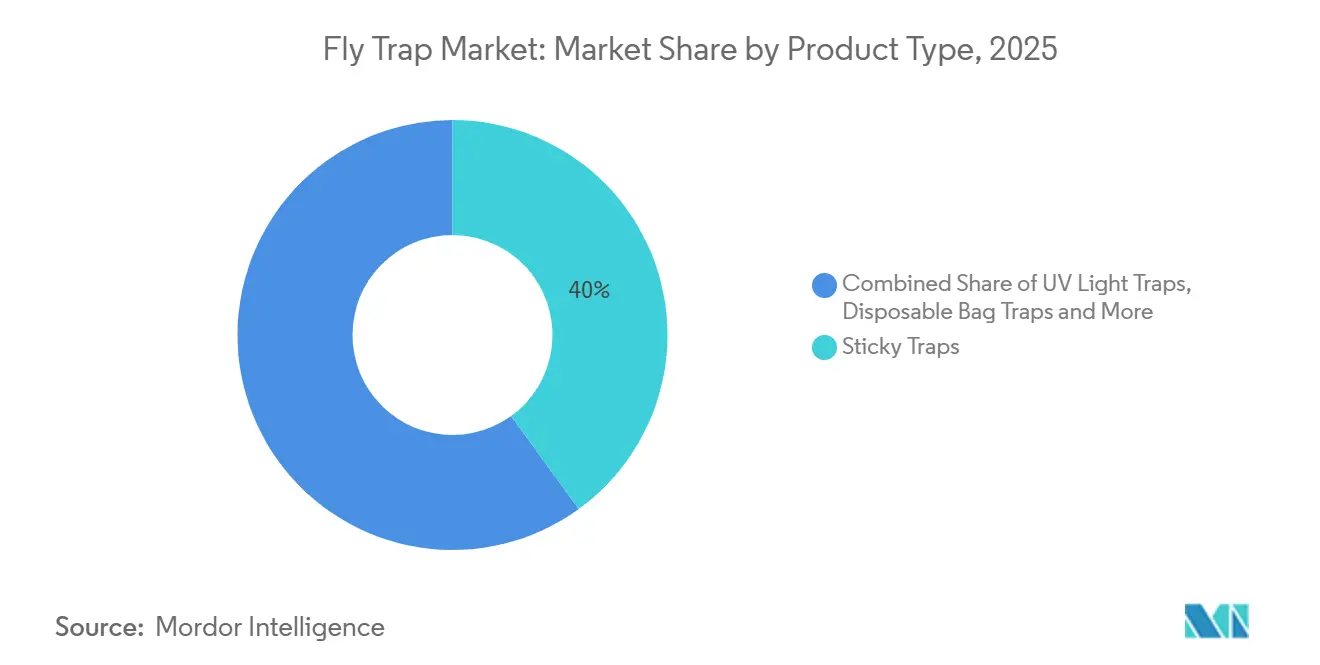
- By product type, sticky traps led the largest 40% of the fly trap market share in 2025, while the UV light traps market size is projected to grow at the fastest CAGR of 10.1% through from 2026 to 2031.
- By trap mechanism, physical-attraction devices accounted for the largest 46% of the fly trap market share in 2025, whereas the integrated hybrids market size is projected to achieve the fastest CAGR of 11.2% from 2026 to 2031.
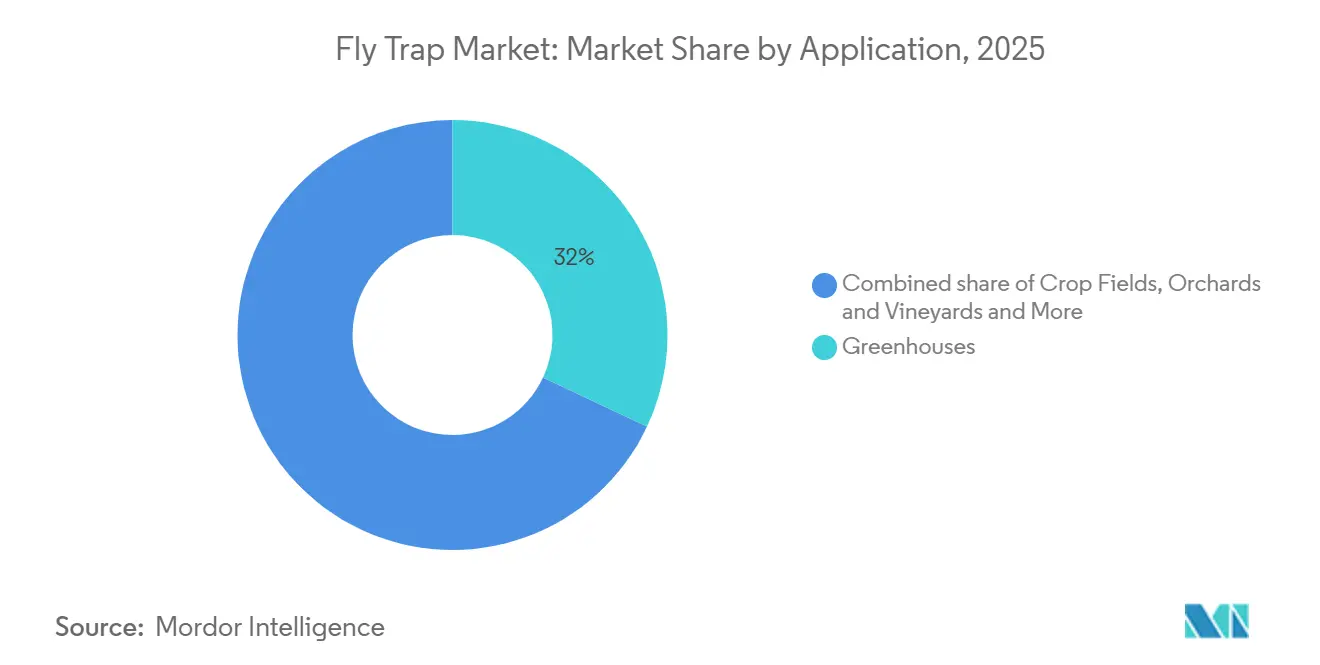
- By application, greenhouses accounted for the largest 32% of the fly trap market share in 2025, while the storage and processing units market size is anticipated to grow at the fastest CAGR of 9.4% from 2026 to 2031.
- By geography, Europe held the largest 33% of the fly trap market share in 2025, while the Asia-Pacific market size is projected to grow at the fastest CAGR of 9.3% from 2026 to 2031.
Note: Market size and forecast figures in this report are generated using Mordor Intelligence’s proprietary estimation framework, updated with the latest available data and insights as of January 2026.
Global Fly Trap Market Trends and Insights
Drivers Impact Analysis*
| Driver | (~) % Impact on CAGR Forecast | Geographic Relevance | Impact Timeline |
|---|---|---|---|
| Growing shift toward pesticide-free integrated pest management | +1.3% | Global, early uptake in Europe and North America | Medium term (2-4 years) |
| Stricter chemical-residue regulations on export crops | +1.1% | Europe, Japan, North America, spillover to South America and Asia-Pacific exporters | Short term (≤ 2 years) |
| Subsidy programs for greenhouse biological controls | +0.9% | North America, Europe, and China | Medium term (2-4 years) |
| Rapid expansion of protected cultivation acreage | +1.2% | Asia-Pacific core, Middle East and North Africa | Long term (≥ 4 years) |
| Internet-connected smart traps enabling real-time pest counts | +0.7% | North America and Europe, emerging in Asia-Pacific | Medium term (2-4 years) |
| Carbon-credit revenue potential for chemical-free trapping | +0.8% | Europe, North America voluntary markets, and pilot schemes in South America | Long term (≥ 4 years) |
| Source: Mordor Intelligence | |||
Growing Shift Toward Pesticide-Free Integrated Pest Management
The increasing adoption of pesticide-free integrated pest management (IPM) is a key factor driving the growth of the fly trap market. Industries are progressively implementing non-chemical pest control methods to comply with regulatory requirements and achieve sustainability objectives. IPM focuses on monitoring and mechanical control, resulting in greater utilization of sticky and light-based fly traps across agriculture, food processing, and residential applications. Research indicates that IPM can reduce pesticide usage by up to 30% compared to previous levels, with some systems eliminating chemical inputs. This shift has heightened the dependence on traps for effective pest monitoring and control [1]Source: Integrated Pest Management for Sustainable Intensification of Agriculture in Asia and Africa, journal Insects (MDPI), mdpi.com.
Stricter Chemical-Residue Regulations on Export Crops
Stricter regulations on chemical residues in export crops are driving the adoption of non-chemical pest control methods, such as fly traps, particularly within high-value horticulture and fresh produce supply chains. Export-oriented producers are required to meet stringent maximum residue limits (MRLs), including Japan’s Positive List System, which enforces a default limit of 0.01 ppm for unregistered pesticides, and the European Union’s pesticide reduction targets under the Farm to Fork Strategy. These regulatory requirements are prompting growers to adopt integrated pest management (IPM) practices, where sticky and light-based fly traps are commonly used for pest monitoring and control without the risk of chemical residues [2]Source: Ministry of Health, Labour and Welfare (Japan), Positive List System. European Commission, Farm to Fork Strategy..
Subsidy Programs for Greenhouse Biological Controls
Subsidy programs supporting greenhouse biological controls are facilitating the adoption of non-chemical pest management tools, such as fly traps, by reducing cost barriers and encouraging integrated pest management (IPM). In the European Union, support under the Common Agricultural Policy (CAP) plays a significant role, as research indicates that the adoption of biocontrol practices often relies on public subsidies due to higher initial costs. In greenhouse systems, where biological control methods are particularly effective, adoption rates have reached approximately 96% for pepper crops and 71% for tomatoes in Spain, highlighting the impact of policy-driven initiatives [3]Source: Institute for European Environmental Policy, “Biocontrol Use in CAP Strategic Plans,” ieep.eu.
Rapid Expansion of Protected Cultivation Acreage
China's protected areas are projected to expand significantly, reflecting substantial efforts in environmental conservation. Similarly, India is focusing on increasing its greenhouse coverage, showcasing its commitment to sustainable agricultural practices. Each newly established structure includes monitoring boards at the time of commissioning, ensuring effective management and operational control. This progress serves as a long-term growth driver for the fly trap market, as the rising demand for urban produce aligns with the objectives of water-efficient agriculture, addressing both environmental sustainability and food security concerns.
Restraints Impact Analysis*
| Restraint | (~) % Impact on CAGR Forecast | Geographic Relevance | Impact Timeline |
|---|---|---|---|
| Limited efficacy against mixed pest populations | -0.6% | Global greenhouse operations with diverse pest complexes | Short term (≤ 2 years) |
| Price sensitivity among smallholder farmers | -0.5% | Sub-Saharan Africa, South and Southeast Asia, South America smallholders | Medium term (2-4 years) |
| Short product life in extreme outdoor climates | -0.4% | Middle East, North Africa, tropical Asia-Pacific, and arid Australia | Short term (≤ 2 years) |
| E-waste compliance costs for UV/electric trap disposal | -0.3% | Europe, North America, Japan, and emerging in Asia-Pacific | Long term (≥ 4 years) |
| Source: Mordor Intelligence | |||
Limited Efficacy Against Mixed Pest Populations
Single-color boards are effective against specific pests but are less efficient in environments where thrips, whiteflies, and fungus gnats are present simultaneously. Adhesive saturation can reduce catch rates in greenhouses with high fungus gnat populations, requiring the deployment of additional traps. This increases both labor and material expenses. Hybrid visual-plus-pheromone traps provide broader coverage by combining visual and chemical attractants. However, their higher cost limits their adoption. This is particularly significant for price-sensitive crops, where growers prioritize cost-effectiveness over advanced trapping methods.
Price Sensitivity Among Smallholder Farmers
Farmers with lower earnings often prioritize essential inputs such as seeds, fertilizers, and affordable pyrethroids over traps, as these are considered more critical for ensuring immediate agricultural productivity and securing returns. Surveys conducted in East Africa indicate that the adoption rate for traps is significantly higher when the cost is covered through micro-credit schemes, as this reduces the financial burden on growers. Unless trap prices decrease or subsidies become more accessible to farmers, adoption rates in this segment are likely to remain limited due to the competing priorities for essential agricultural inputs.
*Our forecasts treat driver/restraint impacts as directional, not additive. The impact forecasts reflect baseline growth, mix effects, and variable interactions.
Segment Analysis
By Product Type: Disposables Dominate, Yet Smart Systems Gain Share
Sticky traps represented the largest 40% of the fly trap product market share in 2025 and remain critical in certified-organic production due to their adherence to residue-free standards. The market size for UV light traps is projected to grow at the fastest CAGR of 10.1% from 2026 to 2031. The adoption of LED modules supports market growth. Disposable bag units remain popular for household use. However, their need for frequent disposal limits their suitability for professional applications. Electric grid devices cater to instant-knockdown requirements in livestock buildings but have faced criticism following the American Veterinary Medical Association's classification of electrocution as a non-preferred method.
Rentokil Initial's recent innovation marks a significant development in the market. Its North American launch features UV-A LEDs combined with high-tack adhesive sheets and a capacitive sensor that records catch counts. Trials demonstrated improved capture rates compared to traditional boards. This success has led to orders from processing plants where minimizing downtime is a priority. The premium segment is dominated by smart IoT-enabled traps, holding a significant market share. Increased deployment among precision-farming operations reflects strong demand, particularly in regions with higher labor costs. These trends underscore the fly trap market's gradual transition toward data-driven solutions that reduce dependence on repetitive manual monitoring.


By Trap Mechanism: Hybrids Outpace Single-Mode Systems
Physical-attraction devices represented the largest share of the fly trap mechanism market at 46% in 2025. The market size for integrated hybrid mechanisms is projected to grow at the fastest CAGR of 11.20% from 2026 to 2031. Chemical attractants, such as (Z)-9-tricosene for houseflies, need regular replacement. While this increases operational costs, it ensures species-specific targeting. Hybrid boards, like the Russell IPM Optiroll Super Plus, have proven effective in capturing mixed pests in Greek olive groves. Although growers face higher initial costs, they avoid crop losses that outweigh these expenses.
Resistance to spinosad has been identified in North American Drosophila suzukii populations, emphasizing the need for integrated pest management systems in berries and stone fruits. This resistance has driven the fly trap market to adopt systems that combine visual, chemical, and, in some cases, acoustic cues. These advanced mechanisms provide growers with a more effective and sustainable pest control solution. By addressing resistance challenges, these systems enhance crop protection, reduce reliance on single-mode treatments, and help minimize economic losses associated with pest infestations.
By Application: Storage Facilities Emerge as Growth Frontier
Greenhouses are anticipated to represent the largest 32% of the market share by 2025. The market size for storage and processing units is projected to grow at the fastest CAGR of 9.4% from 2026 to 2031. This growth is driven by the Food and Drug Administration's Preventive Controls rules, which require documented pest control measures in all facilities. Auditors typically mandate the placement of traps within ten meters of production lines, with penalties for non-compliance increasing each year. These regulations are encouraging facilities to implement more efficient pest management solutions.
Orchards, vineyards, and crop fields are maintaining a stable market share as mass-trapping programs reduce the reliance on broad-spectrum pesticide sprays. In livestock operations, there is a shift from electrified grids to UV-adhesive combinations to meet animal welfare standards. Each application demands specific trap densities, glue formulations, and maintenance schedules, highlighting the diverse yet interconnected dynamics of the fly trap market. This tailored approach ensures effective pest control across various use cases.
Geography Analysis
Europe is projected to account for the largest 33% of the fly trap market share in 2025. This dominance is attributed to well-established greenhouse clusters in the Netherlands and Germany, where sticky boards are widely used as primary pest control tools and to optimize the timing of biological releases. The enforcement of Maximum Residue Level (MRL) regulations has significantly limited pesticide options, further integrating traps into pest management protocols. North America ranks second, with specialty crops in California, Washington, and Oregon increasingly adopting smart units connected to digital dashboards.
The Asia-Pacific market size is anticipated to be the fastest-growing market, with a projected CAGR of 9.3% from 2026 to 2031. China's extensive protected cultivation and India's plans to increase greenhouse acreage are driving significant demand for pest control solutions. Furthermore, Japan's stringent Positive List System, which enforces strict residue limits, has made UV units critical for export crops such as strawberries and tomatoes. These factors collectively position the Asia-Pacific region as a key contributor to the global market's growth.
In South America, growth is being driven by Koppert's investment in Brazil, which has localized the production of traps and beneficial organisms. This localization reduces shipping delays and improves the availability of pest control solutions in the region. Meanwhile, the Middle East and Africa are expanding greenhouse capacity to address food security challenges. For instance, a significant percentage of climate-controlled greenhouses in Saudi Arabia now include traps in new constructions. This development is increasing demand for pest control products and supporting sustainable agricultural practices in the region.

Competitive Landscape
The market is moderately concentrated with the top five companies, including AP&G Co., Inc. (Catchmaster), Koppert Biological Systems B.V., BioFirst Group NV (Biobest Group), Russell IPM Limited, and The Wonderful Company LLC (Suterra) in 2025. Koppert has reinforced its vertical integration strategy by acquiring a stake in Amoeba and establishing facilities in Brazil. These facilities are designed to integrate beneficial insects, biofungicides, and traps, thereby enhancing Koppert's product portfolio and operational efficiency. This strategic initiative highlights the company's focus on innovation and market expansion.
Rentokil Initial's sensor-equipped UV platform reported a significant increase in catch rates after field trials. This development underscores the company's commitment to utilizing technology for improved pest control solutions. BASF's acquisition of AgBiTech in 2026 aims to combine synthetic chemistry with biological expertise. This merger supports the development of pheromone-plus-adjuvant hybrid solutions. Patent activity remains strong, with key players securing a notable share of United States Patent and Trademark Office grants during the period.
Price competition in commodity boards has intensified, with Chinese exports creating pressure on established players to differentiate their offerings. Companies are increasingly focusing on ISO-certified glue strength and peer-reviewed field data to remain competitive. Regional specialists are identifying opportunities in storage facilities and emerging African greenhouses, where demand is on the rise. However, the emphasis on differentiation has shifted towards analytics, documented efficacy, and regulatory expertise. This shift reflects the market's evolving priorities, moving from low-cost assembly to value-added solutions that meet stringent performance and compliance standards.
Fly Trap Industry Leaders
AP&G Co., Inc. (Catchmaster)
Koppert Biological Systems B.V.
BioFirst Group NV (Biobest Group)
Russell IPM Limited
The Wonderful Company LLC (Suterra)
- *Disclaimer: Major Players sorted in no particular order

Recent Industry Developments
- August 2025: Koppert Biological Systems B.V. has formed a strategic partnership with Insect Science to provide semiochemical solutions for monitoring lures, mass trapping, and attract-and-kill systems. This collaboration enhances its range of fly and insect trapping technologies integrated with biological control methods.
- June 2024: Rentokil Initial plc established an Innovation Center in Dallas, Texas, dedicated to artificial intelligence-based image recognition technology. This center focuses on enhancing the identification of flies on adhesive boards, aiming to improve pest control efficiency and accuracy through advanced AI solutions.
- May 2021: Brandenburg (UK) Limited launched new LED-based UV fly traps and electric grid systems as part of its professional hygiene portfolio. These products are intended for use in livestock facilities and food processing environments within the UV and electric trap segment.


Global Fly Trap Market Report Scope
A fly trap is a device used to attract, capture, and control flies through methods like sticky surfaces, bait, or light. It is widely used in agriculture, households, and commercial settings to reduce fly populations and support hygiene and food safety. The fly trap market report is segmented by product type (sticky traps, UV light traps, disposable bag traps, electric grid traps, smart IoT enabled traps and other product types), by trap mechanism (physical attraction, chemical/pheromone attraction and integreated hybrid), by application (greenhouses, crop fields, orchards and vineyards, livestock facilities and storage and processing units), and by geography (North America, South America, Europe, Asia-Pacific, Middle East, and Africa). The report offers the market size and forecasts in terms of value (USD).
| Sticky Traps |
| UV Light Traps |
| Disposable Bag Traps |
| Electric Grid Traps |
| Smart IoT-Enabled Traps |
| Other Product Types |
| Physical Attraction |
| Chemical/Pheromone Attraction |
| Integrated Hybrid |
| Greenhouses |
| Crop Fields |
| Orchards and Vineyards |
| Livestock Facilities |
| Storage and Processing Units |
| North America | United States |
| Canada | |
| Mexico | |
| Rest of North America | |
| South America | Brazil |
| Argentina | |
| Rest of South America | |
| Europe | Germany |
| France | |
| Russia | |
| United Kingdom | |
| Italy | |
| Spain | |
| Rest of Europe | |
| Asia-Pacific | China |
| India | |
| Japan | |
| Australia | |
| Thailand | |
| Vietnam | |
| Philippines | |
| Indonesia | |
| Rest of Asia-Pacific | |
| Middle East | Saudi Arabia |
| United Arab Emirates | |
| Rest of Middle East | |
| Africa | South Africa |
| Kenya | |
| Rest of Africa |
| By Product Type | Sticky Traps | |
| UV Light Traps | ||
| Disposable Bag Traps | ||
| Electric Grid Traps | ||
| Smart IoT-Enabled Traps | ||
| Other Product Types | ||
| By Trap Mechanism | Physical Attraction | |
| Chemical/Pheromone Attraction | ||
| Integrated Hybrid | ||
| By Application | Greenhouses | |
| Crop Fields | ||
| Orchards and Vineyards | ||
| Livestock Facilities | ||
| Storage and Processing Units | ||
| By Geography | North America | United States |
| Canada | ||
| Mexico | ||
| Rest of North America | ||
| South America | Brazil | |
| Argentina | ||
| Rest of South America | ||
| Europe | Germany | |
| France | ||
| Russia | ||
| United Kingdom | ||
| Italy | ||
| Spain | ||
| Rest of Europe | ||
| Asia-Pacific | China | |
| India | ||
| Japan | ||
| Australia | ||
| Thailand | ||
| Vietnam | ||
| Philippines | ||
| Indonesia | ||
| Rest of Asia-Pacific | ||
| Middle East | Saudi Arabia | |
| United Arab Emirates | ||
| Rest of Middle East | ||
| Africa | South Africa | |
| Kenya | ||
| Rest of Africa | ||


Key Questions Answered in the Report
What is the current fly trap market size and its growth outlook?
The fly trap market size was USD 333.3 million in 2025, is projected to grow from USD 358.2 million in 2026 to USD 478.4 million by 2031 at a 7.5% CAGR froom 2026-2031.
Which product segment will grow fastest through 2031?
UV light systems are forecast to lead grow faster with a 10.1% CAGR from 2026-2031 as LED efficiency reduces running costs and residue-compliance concerns favor non-chemical approaches.
Why is Asia-Pacific projected to outpace Europe after 2025?
Rapid greenhouse expansion in China and India, backed by subsidy programs and export-market residue limits, fuels a 9.3% CAGR for the region.
How are smart traps adding value for growers?
IoT-enabled devices deliver real-time pest counts, reduce scouting labor by up to 40%, and help time interventions precisely, cutting insecticide use by close to 30%.
Page last updated on:


