Red Biotechnology Market Size and Share
Market Overview
| Study Period | 2020 - 2031 |
|---|---|
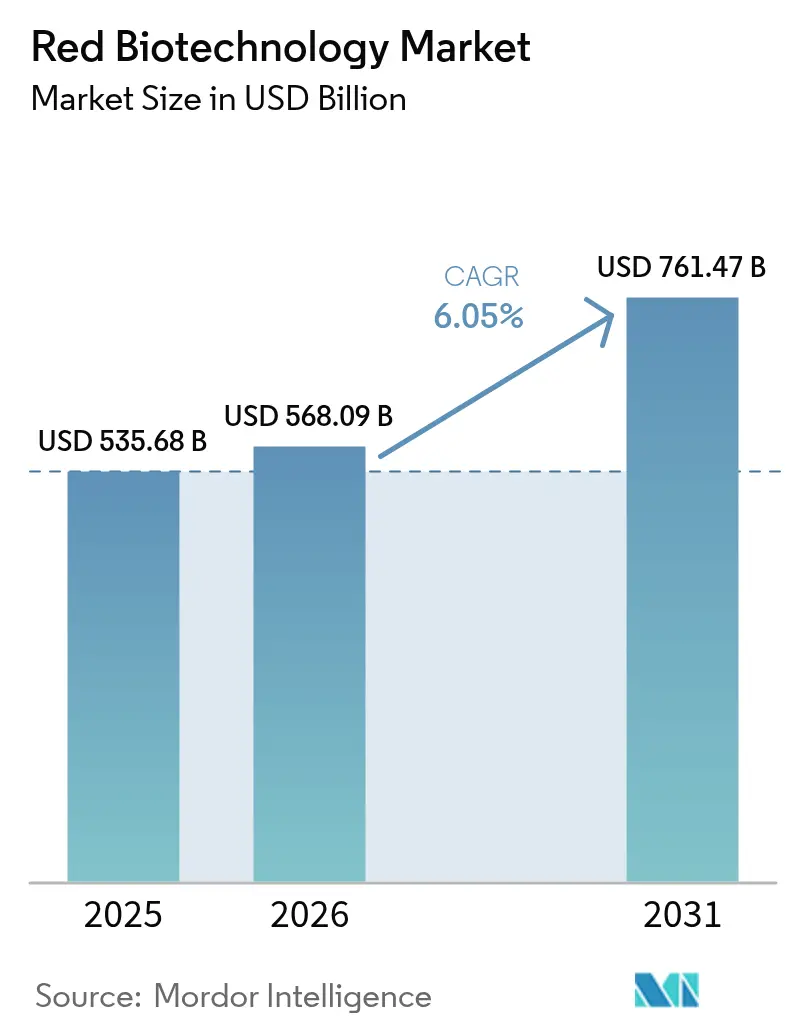
| Market Size (2026) | USD 568.09 Billion |
| Market Size (2031) | USD 761.47 Billion |
| Growth Rate (2026 - 2031) | 6.05% CAGR |
| Fastest Growing Market | Asia Pacific |
| Largest Market | North America |
| Market Concentration | Medium |
Major Players *Disclaimer: Major Players sorted in no particular order Image © Mordor Intelligence. Reuse requires attribution under CC BY 4.0. | |
Red Biotechnology Market Analysis by Mordor Intelligence
The red biotechnology market size was valued at USD 535.68 billion in 2025 and estimated to grow from USD 568.09 billion in 2026 to reach USD 761.47 billion by 2031, at a CAGR of 6.05% during the forecast period (2026-2031). Growth rests on a transition from pandemic-focused vaccine output toward diversified pipelines that now include cell and gene therapies, next-generation monoclonal antibodies, and precision diagnostics. Faster regulatory reviews underpin momentum, illustrated by 24 biological license approvals issued by the FDA in 2024. Parallel government spending—most notably the USD 79.5 billion Public Health Emergency Medical Countermeasures Enterprise (PHEMCE) allocation through 2027—bolsters domestic capacity for both development and manufacturing. On the industry side, large-scale capital projects such as Merck’s USD 1 billion vaccine facility in North Carolina add resilient capacity that can flex between pandemic response and routine commercial production. Together, these factors create a predictable environment for scaling high-complexity biologics, encouraging venture investment and public–private partnerships that shorten time-to-clinic for innovative assets.
Key Report Takeaways
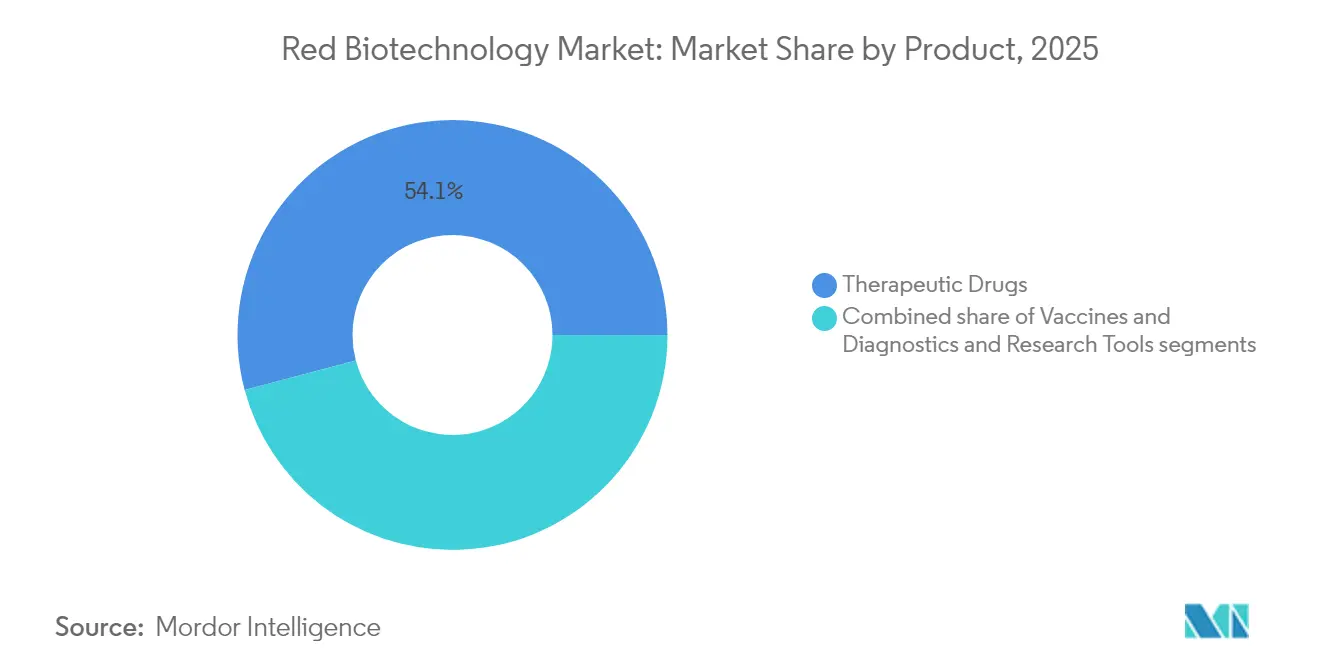
- By product category, the therapeutic drugs segment captured 54.12% of the red biotechnology market share in 2025; the same segment is projected to expand at a 6.63% CAGR to 2031.
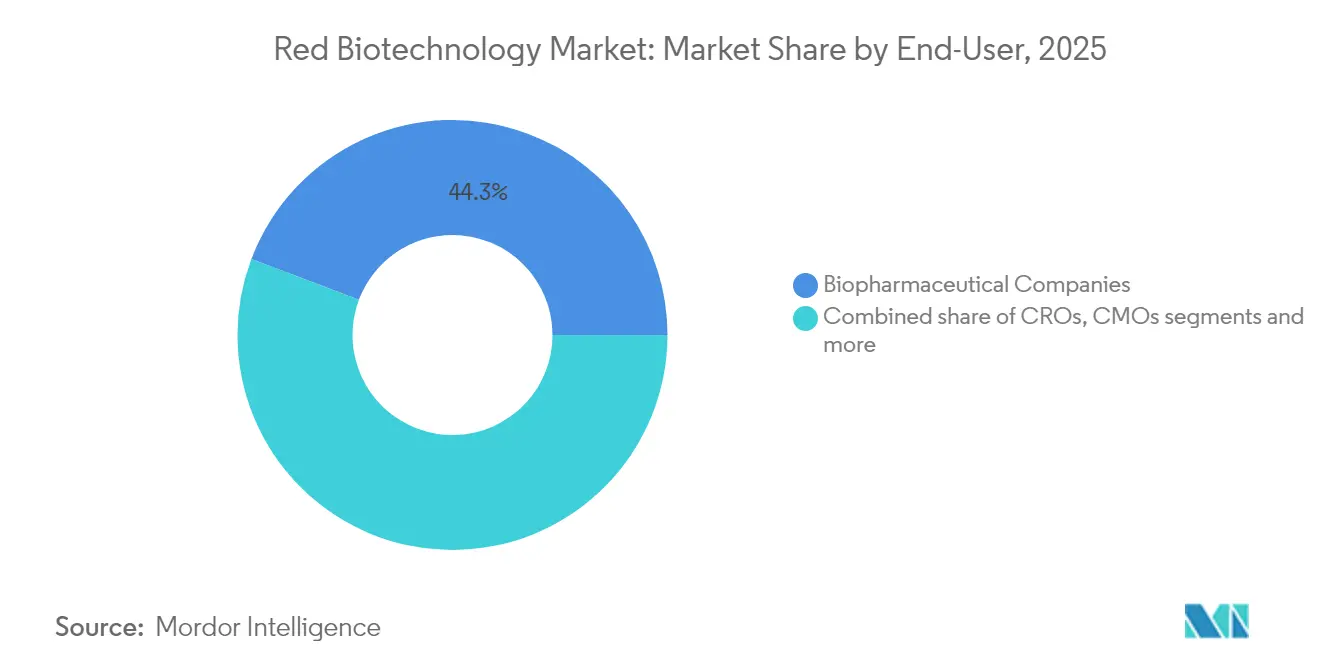
- By end-user, biopharmaceutical companies held 44.25% of the red biotechnology market size in 2025, while academic & research institutes recorded the highest projected CAGR at 7.05% through 2031.
- By geography, North America accounted for 38.72% of the red biotechnology market size in 2025; Asia-Pacific is advancing at a 6.94% CAGR over the same period.
Note: Market size and forecast figures in this report are generated using Mordor Intelligence’s proprietary estimation framework, updated with the latest available data and insights as of 2026.
Global Red Biotechnology Market Trends and Insights
Drivers Impact Analysis*
| Driver | (~) % Impact on CAGR Forecast | Geographic Relevance | Impact Timeline |
|---|---|---|---|
| Rising incidence & prevalence of chronic and rare diseases | +1.2% | Global, with concentration in aging populations of North America & Europe | Long term (≥ 4 years) |
| Healthcare funding expansion & public-private partnerships | +0.9% | Global, particularly strong in APAC and emerging markets | Medium term (2-4 years) |
| Personalized-medicine adoption & companion diagnostics uptake | +0.8% | North America & EU leading, expanding to APAC | Medium term (2-4 years) |
| mRNA-platform spill-over fast-tracking new biologics | +0.7% | Global, with manufacturing hubs in North America & Europe | Short term (≤ 2 years) |
| AI-driven de-risking of early-stage biologics design | +0.6% | Global, concentrated in innovation centers | Medium term (2-4 years) |
| Government-led pandemic-preparedness programmes scaling global vaccine manufacturing capacity | +0.5% | Global, with strategic focus on domestic capabilities | Long term (≥ 4 years) |
| Source: Mordor Intelligence | |||
Rising incidence & prevalence of chronic and rare diseases
Eight novel cell and gene therapies cleared FDA review in 2024, underlining how unmet-need areas convert scientific breakthroughs into commercial assets. Oncology continued to dominate approvals, representing 34% of all new biological products[1]Zinnet Sevval Aksoyalp, “A Year in Pharmacology: New Drugs Approved by the US Food and Drug Administration in 2024,” Naunyn-Schmiedeberg's Archives of Pharmacology, link.springer.com in 2024. Demographic shifts intensify demand; Japan’s policy priority on next-generation monoclonal antibodies and gene therapies reflects the challenge of managing a rapidly aging population. Rare-disease pipelines benefit from Orphan Drug incentives, as 88% of 2024 gene-therapy approvals carried that designation. The FDA’s Rare Disease Innovation Hub and its START pilot compress development timelines, encouraging companies to target niche diseases once considered commercially unattractive.
Healthcare funding expansion & public-private partnerships
The 2023-2027 PHEMCE allocation set aside USD 79.5 billion[2]U.S. Department of Health & Human Services, “Public Health Emergency Medical Countermeasures Enterprise Multi-Year Budget FY 2023-2027,” U.S. Department of Health & Human Services, aspr.hhs.gov for countermeasure R&D and domestic manufacturing, a USD 15.5 billion increase over the earlier planning cycle. BARDA’s USD 2 billion BioMaP-Consortium extends this support by co-investing in flexible facilities that can pivot from antibodies to mRNA vaccines within months. Canada’s Biologics Manufacturing Centre in Montréal adds 250 million-dose annual capacity for viral-vector and protein subunit vaccines. The European Commission’s GenAI4EU programme earmarks EUR 1 billion for AI projects including biologics discovery, reinforcing cross-border knowledge transfer. Emerging economies mirror the model; India’s BIO-E3 framework supplies concessional finance and streamlined land acquisition for new bioproduction campuses.
Personalized-medicine adoption & companion diagnostics uptake
FDA guidance released in 2025 clarifies how artificial intelligence may augment regulatory decision-making for biologics, signaling formal acceptance of ML-powered companion diagnostics. Genetic tests now represent 45% of commercial precision-diagnostic kits, with oncology accounting for one-quarter of overall demand. Hospitals increasingly deploy cloud-linked POCT platforms, a market expected to top USD 90.25 billion by 2030, giving clinicians real-time mutation status before therapy initiation. Wider access to next-generation sequencing lowers per-genome costs, allowing mid-sized biopharma to stratify trials without prohibitive budgets. Regulatory clarity, lower assay costs, and readily accessible bioinformatics collectively drive the uptake of companion diagnostics that anchor personalized therapeutic regimens.
mRNA-platform spill-over fast-tracking new biologics
Seventy active clinical trials assessed mRNA-based vaccines beyond COVID-19 as of June 2024, targeting oncology, RSV, and cystic fibrosis. Trans-amplifying constructs cut RNA input by forty-fold, lowering the cost-of-goods while maintaining immunogenicity. Circular mRNA vectors synthesized at Nagoya University deliver 200-times higher protein output, opening therapeutic windows in metabolic and rare genetic disorders. Moderna is commissioning three regional plants—the UK, Australia, and Canada—each able to fill 100 million dose equivalents, demonstrating global scalability for rapid-turnover mRNA pipelines as production moves to continuous, single-use formats, tech-transfer timelines shrink, enabling small developers to navigate from IND to Phase 1 in under 12 months.
Restraints Impact Analysis*
| Restraint | (~) % Impact on CAGR Forecast | Geographic Relevance | Impact Timeline |
|---|---|---|---|
| High biomanufacturing & cold-chain costs | -0.8% | Global, particularly challenging in emerging markets | Medium term (2-4 years) |
| Complex, shifting global biologics regulations | -0.6% | Global, with regional variations in compliance requirements | Long term (≥ 4 years) |
| Supply-chain fragility for critical raw materials | -0.5% | Global, with concentration risks in Asia-Pacific suppliers | Short term (≤ 2 years) |
| Immunogenicity risks in next-gen gene therapies | -0.4% | Global, with heightened scrutiny in North America & Europe | Medium term (2-4 years) |
| Source: Mordor Intelligence | |||
High biomanufacturing & cold-chain costs
Industry losses from cold-chain failures hit USD 35 billion annually, undermining affordability for temperature-sensitive biologics. CAR-T autologous therapies still cost above USD 500,000 per patient due to labor-intensive manufacture and cryogenic distribution. Annex 1 revisions tightened aseptic-processing rules, compelling upgrades to isolator technology and environmental monitoring that inflate capex for greenfield plants. Supply-chain concentration compounds the problem; more than 75% of U.S. API imports originate outside its borders, exposing production to geopolitical shocks. Although AI-enabled route-planning software and digital twins promise 15-25% logistics savings, widespread deployment remains in pilot stages, delaying near-term relief.
Complex, shifting global biologics regulations
The EU Clinical Trials Regulation, effective January 2025, obliges sponsors to upload legacy study data into the new CTIS portal, causing administrative backlogs. Concurrently, an EMA fee overhaul lifted scientific-advice costs to as high as EUR 98,400, straining small developers. The FDA’s CoGenT Global initiative seeks harmonized gene-therapy guidelines but currently covers only rare diseases, leaving broader categories in regulatory limbo. In the United States, the replacement of all Advisory Committee on Immunization Practices (ACIP) members in June 2025 injected uncertainty into forthcoming vaccine policy schedules. Collectively, unaligned standards extend time-to-approval and increase the volume of bridging studies needed for multi-region launches.
*Our forecasts treat driver/restraint impacts as directional, not additive. The impact forecasts reflect baseline growth, mix effects, and variable interactions.
Segment Analysis
By Product: Therapeutic Drugs Lead Innovation Wave
Therapeutic drugs generated USD 289.76 billion in 2025, corresponding to a 54.12% share of the Red biotechnology market size, and are forecast to grow at 6.63% CAGR to 2031. Monoclonal antibodies anchor the category, boasting more than 200 approved agents and close to 1,400 active clinical candidates worldwide. Bispecific formats achieve the highest clinical-to-approval conversion, prompting companies such as BioNTech and Bristol Myers Squibb to pursue multi-billion-dollar codevelopment deals. Gene therapies accelerated following the FDA endorsement of eight products in 2024, while CRISPR-modified CAR-T platforms now dominate early-phase haem-oncology trials. mRNA therapeutics move beyond infectious disease into cardiometabolic indications, supported by circular RNA technology that multiplies in vivo protein yield.
Vaccines maintain strategic relevance, supported by BARDA option clauses that guarantee minimum call-off volumes during outbreaks. Diagnostics and research tools expand as sequencing reagents and liquid-biopsy assays gain adoption in decentralized settings. In parallel, therapeutic proteins evolve toward antibody-drug conjugates and fusion cytokines tailored to specific disease microenvironments, reflecting the Red biotechnology market emphasis on precision targeting.


By End-User: Academic Partnerships Drive Growth
Biopharmaceutical companies retained 44.25% of the red biotechnology market share in 2025 through vertical integration that spans discovery to commercial supply. Academic and research institutes, however, represent the fastest-growing constituency at 7.05% CAGR, buoyed by grant inflows and corporate co-recruitment of principal investigators. University core facilities now provide GMP-compliant vector suites, allowing spin-outs to run early trials without building dedicated infrastructure. NVIDIA’s alliance with Novo Nordisk supplies cloud GPU credits and structural-prediction algorithms to more than 100 academic labs, democratizing access to AI design tools.
Contract manufacturing organizations (CMOs) and contract research organizations see parallel momentum as outsourcing mitigates capital burden; CMOs are on track to control 54% of global biologics capacity by 2028, reshaping make-versus-buy calculus for small innovators. Hospitals and specialty clinics emerge as niche end-users for point-of-care cell therapies, especially in oncology centers equipped with closed-system manufacturing pods. This diffusion of capability reflects an industry migration toward distributed yet interconnected development networks.
Geography Analysis
North America captured 38.72% of the Red biotechnology market size in 2025, and is projected to register a 5.78% CAGR through 2031. The region benefits from a full-spectrum ecosystem that bundles discovery, regulation, and industrial-scale manufacture. BARDA’s BioMaP-Consortium and the PHEMCE capital pool safeguard domestic production for both routine and emergency biologics, while the FDA’s expedited designations shorten lead times for innovative therapies. Ongoing regulatory restructuring, such as the ACIP membership overhaul, introduces short-term uncertainty for vaccine launch timing. Yet, sizeable Congressional proposals seeking USD 15 billion for biotech competitiveness underscore sustained political commitment.
Europe is projected to grow at 6.02% CAGR to 2031. Policy reforms, including the Clinical Trials Regulation and Horizon Europe funds, facilitate multinational trials and cross-border knowledge sharing. HERA’s EUFab infrastructure offers nimble surge capacity, capable of switching among mRNA, viral-vector, and protein vaccines within 100 days, enhancing the bloc’s autonomy. Fee increases under new EMA regulations add cost pressure, but simultaneous consultation on streamlined biosimilar dossiers could broaden access to lower-priced biologics for state payers.
Asia-Pacific shows the fastest momentum, expanding at 6.94% CAGR and expected to more than double its segment value by 2031. Japan’s national strategy seeks to triple sectoral output to 15 trillion yen by 2030 through tax credits and accelerated review lanes. India’s biotech value rocketed from USD 10 billion in 2014 to USD 130 billion in 2024, leveraging cost advantages and a 60% share of global vaccine volume. China deepens AI-enabled discovery, epitomized by AstraZeneca’s USD 5.3 billion partnership with CSPC Pharmaceutical that targets autoimmune disorders. Regional governments are synchronizing regulations to ease trans-border clinical trials, accelerating first-in-human studies and subsequent scale-up in nearby contract plants.
Competitive Landscape
Market leadership is tilting toward companies that combine differentiated platforms with networked alliances rather than pure scale. BioNTech and Bristol Myers Squibb’s USD 7.6 billion bispecific-antibody pact signposts the premium investors place on modular immune-oncology platforms. AstraZeneca’s AI-centric deal with CSPC advanced multi-omics models that shorten lead optimization cycles by up to 50%. These partnerships exemplify a pattern where big-pharma capital merges with specialty know-how to share risk and accelerate validation.
The Red biotechnology market, meanwhile, opens white-space in RNA modalities; the segment is forecast to expand six-fold, creating room for startups focused on delivery vehicles such as lipid nanoparticles and protein nanocages. CMOs capture disproportionate value by offering plug-and-play capacity, with projections that they will own a higher stake of global biologics output by 2030. Emergent disruptors—e.g., Arcturus Therapeutics’ self-amplifying RNA vaccine, or Camurus’s lipid-based depot gels that underpin a USD 870 million Lilly alliance—demonstrate how formulation innovation can unlock both patient convenience and economic upside.
Competitive intensity remains moderate because high capital barriers limit the entry of single-product entities. Yet the role of AI is lowering discovery costs, enabling new entrants to gain traction quickly by licensing manufacturing rather than building asset-heavy footprints. Consequently, incumbents strengthen IP positions and pursue earlier-stage licensing to secure pipeline depth, illustrated by Agenus granting Zydus rights to its checkpoint antibodies while co-launching a U.S. BioCDMO business.
Red Biotechnology Industry Leaders
AstraZeneca PLC
F. Hoffmann-La Roche Ltd
Bristol Myers Squibb
Novartis AG
Pfizer Inc.
- *Disclaimer: Major Players sorted in no particular order


Recent Industry Developments
- June 2025: BioNTech and Bristol Myers Squibb announced a USD 7.6 billion collaboration to co-develop and co-commercialise BNT327, a bispecific antibody targeting PD-L1 and VEGF-A for multiple tumors, sharing profits on a 50/50 basis
- June 2025: AstraZeneca entered a USD 5.3 billion AI-led research agreement with CSPC Pharmaceutical Group to discover small-molecule therapies for chronic diseases, including a USD 110 million upfront payment.
- June 2025: Eli Lilly formed a USD 870 million alliance with Camurus to co-develop long-acting GLP-1 and incretin-based obesity drugs using Camurus’s lipid-based gel depot technology.
- June 2025: Agenus and Zydus Lifesciences finalized a USD 141 million partnership centered on botensilimab and balstilimab, alongside Zydus launching a U.S. BioCDMO unit utilizing Agenus’s existing facilities.


Research Methodology Framework and Report Scope
Market Definitions and Key Coverage
Our study defines the red biotechnology market as the aggregate revenue generated worldwide from therapeutic biologics, preventive vaccines, cell- and gene-based medicines, and molecular diagnostics that rely on living cells, engineered organisms, or their derivatives to treat, detect, or prevent human disease.
Scope exclusion: industrial enzymes, agricultural biotech inputs, and biomaterials not used for patient care are outside the frame.
Segmentation Overview
- By Product
- Vaccines
- mRNA Vaccines
- Viral Vector Vaccines
- Recombinant-protein Vaccines
- Conjugate & Subunit Vaccines
- Live-attenuated & Inactivated Vaccines
- Therapeutic Drugs
- Monoclonal Antibodies
- Recombinant Proteins
- Gene Therapies
- Cell Therapies
- RNA Therapeutics
- Diagnostics & Research Tools
- Sequencing Reagents & Kits
- Companion-diagnostic Assays
- Point-of-care Molecular Tests
- Vaccines
- By End-User
- Biopharmaceutical Companies
- Contract Manufacturing Organizations (CMOs)
- Contract Research Organizations (CROs)
- Academic & Research Institutes
- Hospitals & Specialty Clinics
- By Geography
- North America
- United States
- Canada
- Mexico
- Europe
- Germany
- United Kingdom
- France
- Italy
- Spain
- Rest of Europe
- Asia-Pacific
- China
- India
- Japan
- Australia
- South Korea
- Rest of Asia-Pacific
- Middle East and Africa
- GCC
- South Africa
- Rest of Middle East and Africa
- South America
- Brazil
- Argentina
- Rest of South America
- North America
Detailed Research Methodology and Data Validation
Primary Research
Mordor analysts interviewed manufacturing directors at biopharma firms, procurement leads at contract development organizations, oncologists running CAR-T trials, and payor advisors in the United States, Germany, India, and Brazil. These discussions validated average selling prices, uptake curves after regulatory approvals, and regional reimbursement caps, bridging gaps found in desk research.
Desk Research
We began with standard-setting sources such as the US FDA Biologics License Application database, European Medicines Agency approvals archive, and WHO vaccine procurement dashboards, which signal commercialized product counts and launch timing. Trade statistics from UN Comtrade and customs bodies helped us map cross-border flows of bulk biologics, while clinical-trial registers and peer-reviewed journals clarified pipeline density and attrition. Company 10-Ks and investor decks shed light on selling prices and capacity additions, and then paid platforms like D&B Hoovers and Dow Jones Factiva supplied audited revenue splits that sharpened segment ratios. This list is illustrative; many other public and paid references supported data collection and cross-checks.
Market-Sizing & Forecasting
A top-down demand pool was reconstructed from biologic drug sales, vaccine dose shipments, and genetic test volumes, which are then benchmarked against production capacity roll-ups and sampled ASP × volume checks for reasonableness. Key variables like R&D spend on advanced therapies, approved indication count, bioreactor utilization rates, patent expiries, prevalence-to-treated patient ratios, and national immunization coverage feed a multivariate regression that projects value through 2030. Where bottom-up supplier data were thin, we prorated using validated regional penetration rates before iterating results with experts.
Data Validation & Update Cycle
Outputs undergo variance scans versus historical sales trends and macro health expenditure indicators; anomalies trigger re-contact with sources before sign-off. Reports refresh each year, with interim updates if material events such as landmark approvals or safety withdrawals arise.
Why Mordor's Red Biotechnology Baseline Commands Reliability
Published estimates often differ, and we acknowledge that scope choices, price assumptions, and refresh cadence typically drive the gaps.
Key gap drivers include whether diagnostics revenue is counted, the treatment of one-time gene therapy payments, currency conversions on fast-moving biologic ASPs, and the frequency at which pipeline-to-market transitions are captured. Mordor's model locks definition early, applies audited ASP bands, and updates annually, whereas others may blend historical and scenario numbers that age quickly.
Benchmark comparison
| Market Size | Anonymized source | Primary gap driver |
|---|---|---|
| USD 535.68 B | Mordor Intelligence | - |
| USD 427.20 B | Global Consultancy A | excludes companion diagnostics; uses 2024 average prices |
| USD 667.92 B | Industry Association B | rolls in veterinary biologics and double counts contract fees |
| USD 910.26 B | Regional Consultancy C | aggressive pipeline conversion and 2023 FX rates |
The comparison shows that once scope creep and price inflation are stripped out, Mordor's disciplined, annually refreshed approach delivers a balanced baseline that decision-makers can trace back to clear variables and reproducible steps.


Key Questions Answered in the Report
Which therapeutic modalities are gaining the fastest regulatory traction in red biotechnology?
Cell and gene therapies are receiving accelerated reviews under programs like the FDA’s Rare Disease Innovation Hub, leading to quicker approvals for niche, high-impact treatments.
How is artificial intelligence reshaping biologics discovery and development?
Deep-learning models now predict protein folding and immunogenic hotspots in hours, allowing researchers to iterate designs rapidly and cut early-stage failure risk.
What strategic advantages do biopharmaceutical firms gain by partnering with contract manufacturing organizations (CMOs)?
CMOs offer modular, single-use facilities that let sponsors scale production without heavy capital outlay, enabling faster commercial launch and flexible pandemic surge capacity.
In what ways are evolving global regulations influencing market entry strategies?
Divergent post-2025 rules in the EU and United States are prompting companies to sequence submissions, run region-specific bridging studies, and budget for higher scientific-advice fees.
How is the rise of personalized medicine altering diagnostic workflows?
Companion diagnostics are moving closer to the point of care, integrating rapid genomic assays that help clinicians select targeted therapies during the initial patient visit.
Which technological advances are helping to lower cold-chain logistics costs for biologics?
Trans-amplifying mRNA vaccines and next-generation stabilizing excipients extend product shelf life at standard refrigeration, reducing reliance on ultra-cold storage networks.
Page last updated on:


