Agricultural Biologicals Market Size and Share
Market Overview
| Study Period | 2021 - 2031 |
|---|---|
| Market Size (2026) | USD 32.56 Billion |
| Market Size (2031) | USD 51.12 Billion |
| Growth Rate (2026 - 2031) | 9.44% CAGR |
| Fastest Growing Market | North America |
| Largest Market | Europe |
| Market Concentration | Low |
Major Players *Disclaimer: Major Players sorted in no particular order Image © Mordor Intelligence. Reuse requires attribution under CC BY 4.0. | |
Agricultural Biologicals Market Analysis by Mordor Intelligence
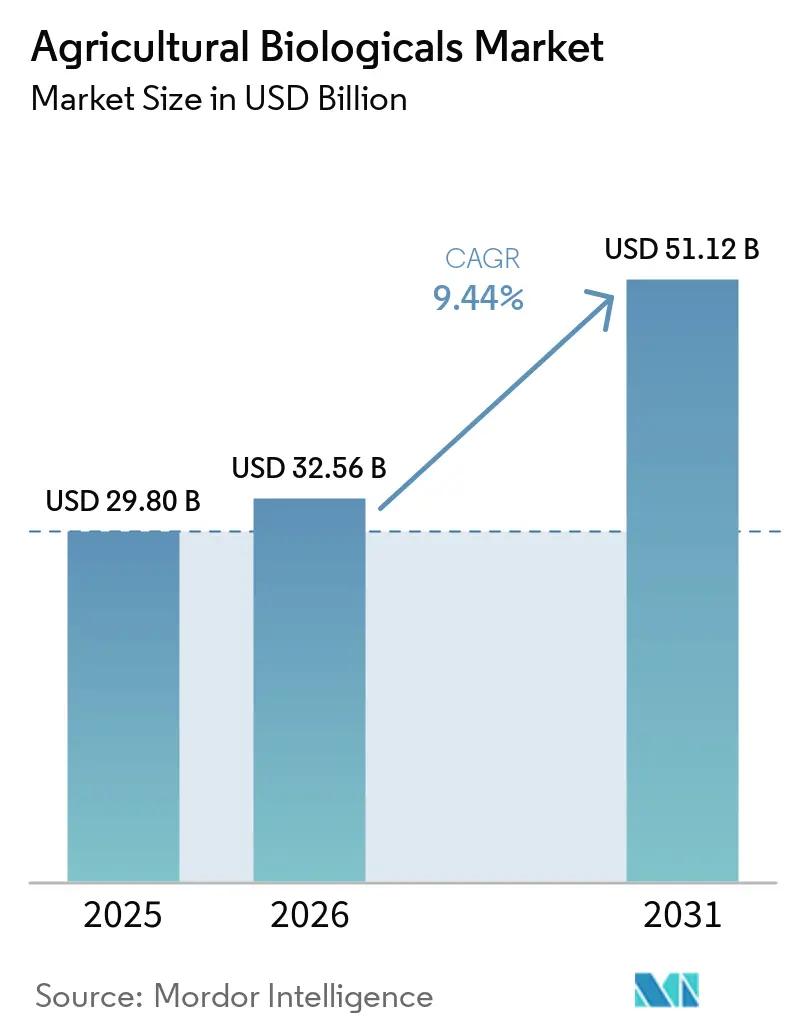
The agricultural biologicals market size is projected to grow from USD 29.80 billion in 2025 to USD 32.56 billion in 2026 and USD 51.12 billion by 2031, registering a CAGR of 9.44% from 2026 to 2031. This market is advancing more rapidly than most crop input categories due to factors such as stricter maximum residue limits (MRLs) in export channels, an increase in organic farmland, and residue-free sourcing programs, which are positioning biological products as integral to crop management strategies. Global organic farmland expansion and the growing adoption of biological inputs across both conventional and organic farming systems are supporting this trend. Growth is driven by tightening regulations on conventional chemical inputs and more accessible registration pathways for biological products. Competitive activity in the market is also intensifying as major crop input companies expand their biological product portfolios through acquisitions and increased production capacity. However, challenges such as cold-chain dependence and feedstock volatility continue to limit the scalability of the agricultural biologicals market in certain regions.
Key Report Takeaways
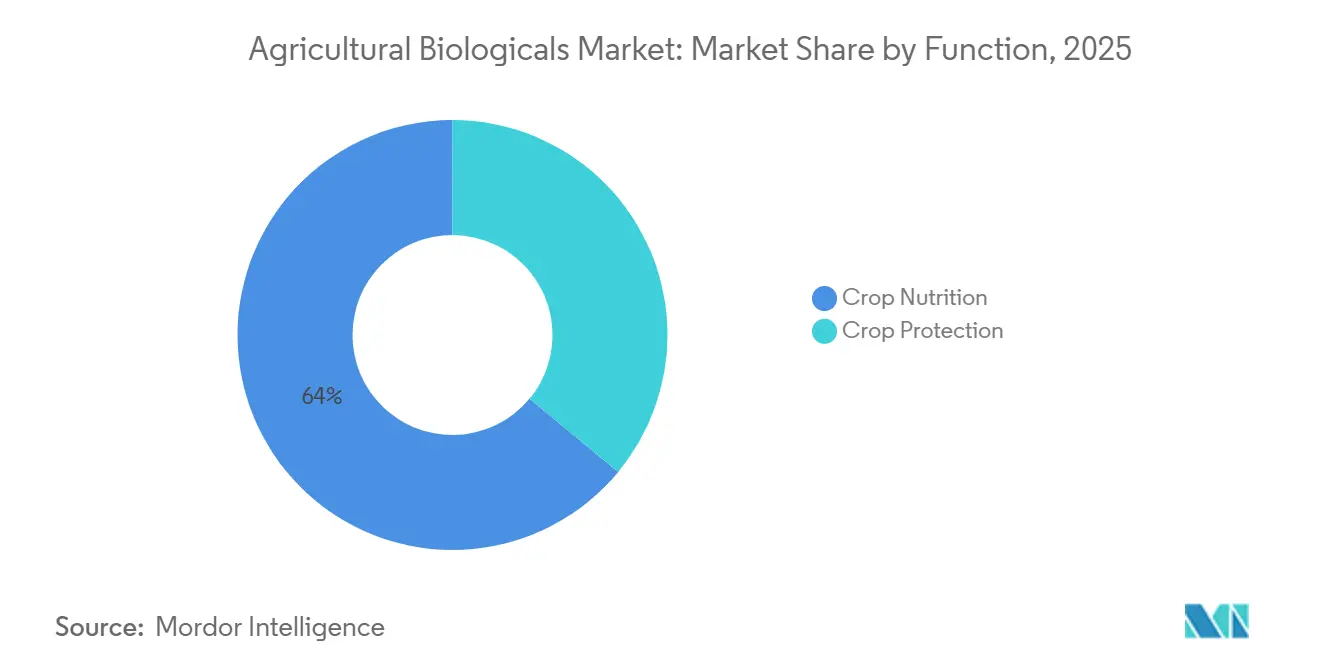
- By function, the agricultural biologicals market share for the crop nutrition segment held the largest 64.0% in 2025, while the agricultural biologicals market size for the crop protection segment recorded the fastest projected CAGR at 9.5% from 2026 to 2031.
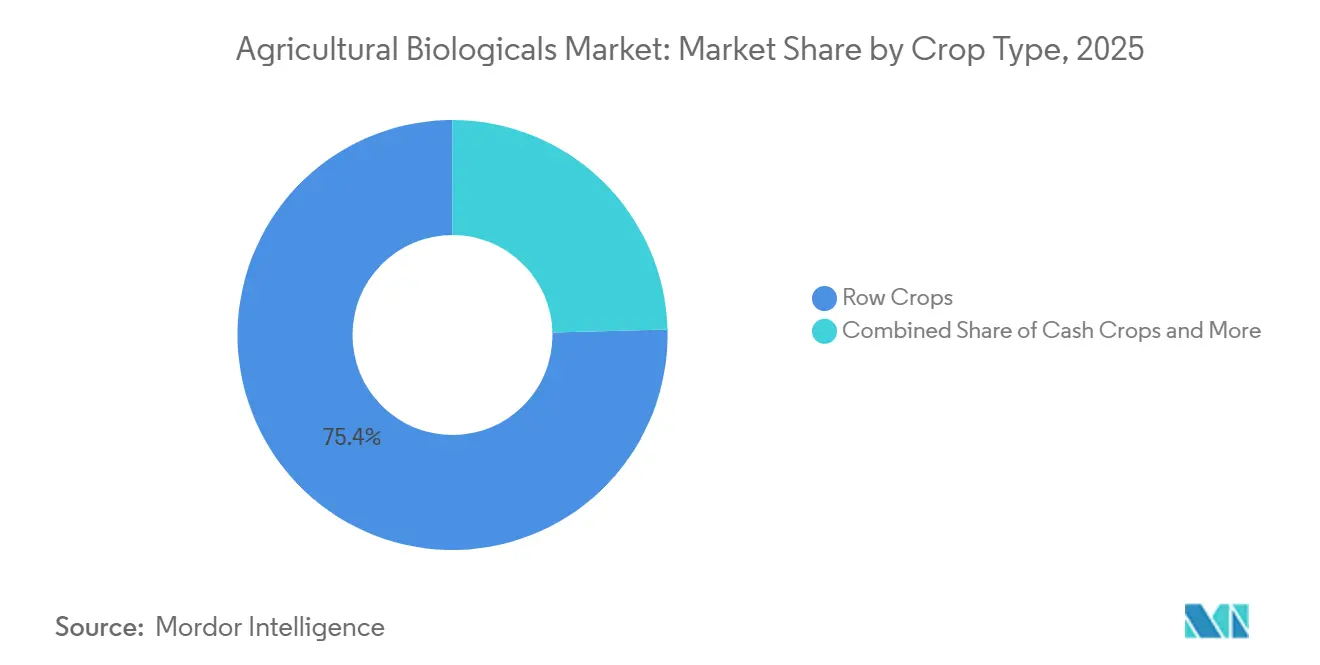
- By crop type, row crops captured the largest 75.4% of the agricultural biologicals revenue share in 2025, while horticultural crops are advancing at the fastest 9.5% CAGR from 2026 to 2031.
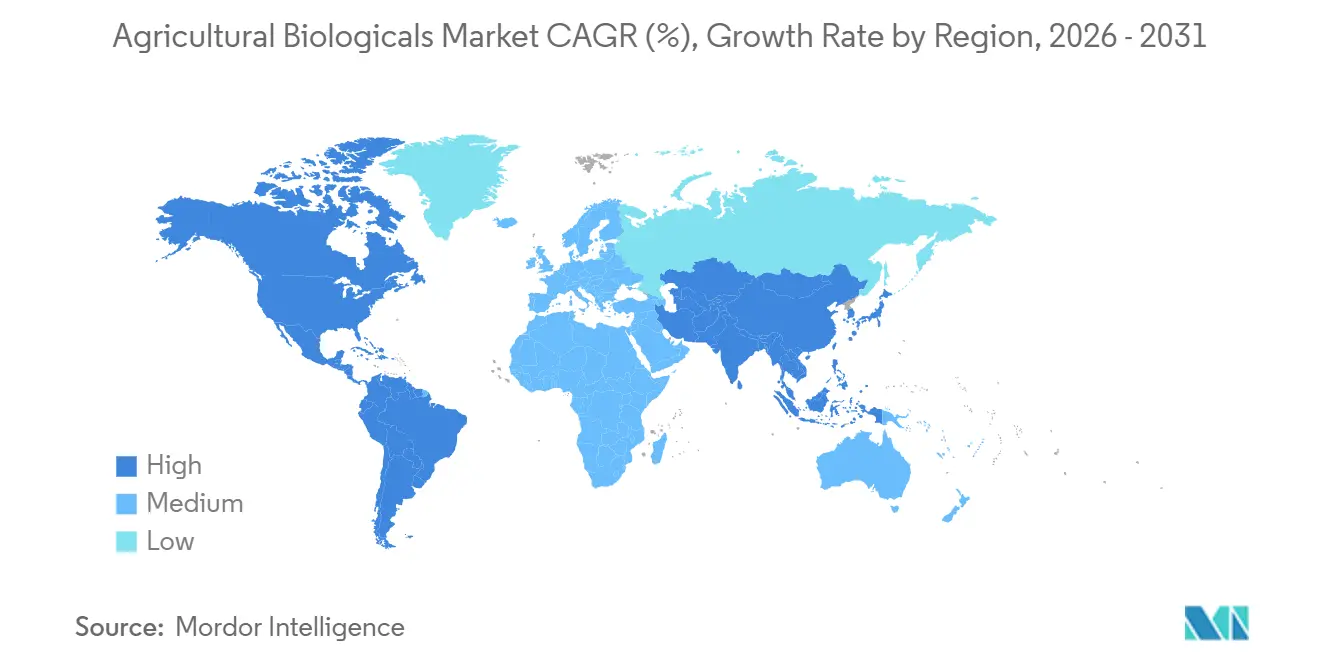
- By geography, Europe held the largest 34% of global revenue in 2025, while North America is the fastest regional segment with an 11.8% CAGR from 2026 to 2031.
Note: Market size and forecast figures in this report are generated using Mordor Intelligence’s proprietary estimation framework, updated with the latest available data and insights as of 2026.
Global Agricultural Biologicals Market Trends and Insights
Drivers Impact Analysis*
| Driver | (~) % Impact on CAGR Forecast | Geographic Relevance | Impact Timeline |
|---|---|---|---|
| Rising demand for organic and residue-free produce | +3% | Global, highest intensity in Europe, North America, and Japan | Medium term (2-4 years) |
| Stricter regulations on synthetic agrochemical residues and ingredients | +2.5% | Europe and North America primary, with spillover to South America and Asia-Pacific | Short term (≤ 2 years) |
| Growing use of biologicals in integrated pest management | +2% | North America, Europe, Brazil, and Australia | Medium term (2-4 years) |
| Regenerative agriculture incentives and carbon insetting programs | +1.2% | North America, Europe, South America, and Australia | Medium term (2-4 years) |
| Artificial intelligence (AI)-enabled microbial strain discovery and formulation optimization | +0.8% | Global, led by North America and Europe | Long term (≥ 4 years) |
| Localized fermentation and on-farm bio-input manufacturing models | +0.7% | Brazil, India, South America, and Africa | Short term (≤ 2 years) |
| Source: Mordor Intelligence | |||
Rising Demand for Organic and Residue-Free Produce
The agricultural biologicals market is growing due to the rising adoption of organic and residue-sensitive farming systems in major production regions. According to the study published in "Growth of Organic Farming in India," the area under organic cultivation in India reached approximately 7.3 million hectares in 2024, compared to 0.5 million hectares two decades ago, and the country had over 2.3 million organic farmers in 2024, highlighting the rapid expansion of sustainable agricultural practices. This growth is driving demand for biological crop protection and soil enhancement products that facilitate residue-free farming. Furthermore, retailer and processor purchasing requirements are extending residue-free sourcing beyond certified organic channels, incorporating biological inputs into conventional farming practices, and broadening market demand.
Stricter Regulations on Synthetic Agrochemical Residues and Ingredients
The agricultural biologicals market is benefiting from stricter compliance regulations on conventional insecticide usage and streamlined approval processes for biological products. In Europe, the European Commission announced in December 2025 that provisional national authorizations for biocontrol products could save developers EUR 22 million (USD 23.5 million) annually in delayed marketing losses [1]Source: European Commission, “Commission Implementing Regulation (EU) Document,” food.ec.europa.eu. This development enhances the economic feasibility of product launches in the agricultural biologicals market. As these regulatory processes become more efficient, investment decisions within the market are projected to increasingly favor biological pipelines that can be commercialized more rapidly and with reduced regulatory hurdles.
Growing Use of Biologicals in Integrated Pest Management
The agricultural biologicals market is growing as biological products are increasingly incorporated into the design phase of integrated pest management (IPM) programs, rather than being applied only at the end of the season. Research published by the Invasive Species Corporation indicates that 2025 data highlights the potential for greater adoption of biological pesticides within IPM programs, particularly when seed treatment is included from the planting stage. Seed-applied biologicals play a significant role by influencing pest pressure, nitrogen fixation, and root development without requiring changes to field operations later in the season. Additionally, the market for agricultural biologicals benefits as resistance to conventional chemical solutions increases, shifting biological products from optional inputs to essential components of crop protection strategies.
Regenerative Agriculture Incentives and Carbon Insetting Programs
The agricultural biologicals market is experiencing growth as regenerative agriculture programs increasingly associate the use of biological inputs with measurable environmental benefits. In April 2026, Regenagri introduced Carbon Insetting Standard 2.0, encompassing 361,000 hectares across 25 active projects [2]Source: Regenagri, “Regenagri Launches Carbon Insetting Standard 2.0,” Regenagri, regenagri.org . Biological inputs were acknowledged for their role in improving soil organic carbon and reducing greenhouse gas emissions. Similarly, the Ecosystem Services Market Consortium identified microbial inoculants, biostimulants, and soil amendments as eligible inputs for verified environmental outcomes under the EcoHarvest program. This initiative provides biological inputs with a more defined role within corporate sustainability frameworks. Unlike offset models, insetting ensures that interventions occur within the buyer’s own supply chain. This approach enables food brands and retailers to act as active demand channels, fostering direct commercial demand for agricultural biologicals in high-value supply chains where residue management, carbon reduction, and soil health objectives are integrated.
Restraints Impact Analysis*
| Restraint | (~) % Impact on CAGR Forecast | Geographic Relevance | Impact Timeline |
|---|---|---|---|
| Short shelf life and cold-chain dependence of many formulations | -0.9% | Global, most acute in Africa, South Asia, and Southeast Asia | Medium term (2-4 years) |
| Complex and non-harmonized registration pathways | -0.8% | Europe, Asia-Pacific, Middle East, and Africa | Medium term (2-4 years) |
| Proliferation of counterfeit and sub-standard products | -0.6% | India, China, Sub-Saharan Africa, and parts of South America | Short term (≤ 2 years) |
| Volatile seaweed and other biological feedstock supply | -0.4% | Global, with highest exposure in biostimulant-reliant markets in Europe and North America | Medium term (2-4 years) |
| Source: Mordor Intelligence | |||
Short Shelf Life and Cold-Chain Dependence of Many Formulations
The agricultural biologicals market faces a notable distribution challenge, as many microbial and living-agent formulations lose effectiveness under suboptimal storage and transportation conditions. Research published in the 2025 Journal of Crop Health indicated that the emergence rates for Aphidius colemani dropped from 84.4% under controlled conditions to 34.8% after 96 hours of refrigeration. Similarly, Orius laevigatus populations declined from 83.97% to 22.12% after 168 hours, demonstrating a rapid loss of viability [3]Source: Springer Nature, “Article Published in Journal of Crop Science and Biotechnology,” link.springer.com. This issue is particularly significant in regions such as South Asia, Southeast Asia, and Sub-Saharan Africa, where the agricultural biologicals market has strong adoption potential but is hindered by inadequate cold-chain infrastructure at the last mile.
Complex and Non-Harmonized Registration Pathways
The agricultural biologicals market faces challenges when approval systems remain fragmented across jurisdictions. In November 2025, the European Parliament adopted a resolution for faster approval processes and stronger authorization procedures for biological control agents. This highlights that the policy issue is now acknowledged at the regional level. The primary challenge lies not only in slow review processes but also in weak mutual recognition among member states. Companies may still encounter repeated country-level regulatory requirements within what is intended to function as a single market. This structure increases compliance costs and extends product launch timelines, favoring larger companies capable of managing multi-country dossiers and lengthy regulatory cycles. Consequently, the agricultural biologicals market may experience faster consolidation than the pace of innovation suggests, as smaller specialized firms, often with unique products, struggle to navigate non-harmonized regulations.
*Our forecasts treat driver/restraint impacts as directional, not additive. The impact forecasts reflect baseline growth, mix effects, and variable interactions.
Segment Analysis
By Function: Crop Nutrition Anchors Revenue While Crop Protection Accelerates
The agricultural biologicals market share for the crop nutrition segment held the largest 64.0% in 2025, supported by the rising adoption of biofertilizers, biostimulants, and organic nutrient management programs across commercial farming systems. Farmers are increasingly integrating biological nutrition inputs into conventional agronomy practices due to their ability to enhance nutrient uptake efficiency, soil microbial activity, and abiotic stress tolerance without requiring significant operational changes. Demand is particularly robust in row crops and horticultural production, where sustainable farming practices and residue management are key factors influencing purchasing decisions. Additionally, the compatibility of these products with existing fertilizer programs supports their broader acceptance in large-scale farming operations.
The agricultural biologicals market size for the crop protection segment recorded the fastest projected CAGR at 9.5% from 2026 to 2031. driven by expanding use of biological solutions in resistance management and residue-sensitive crop systems. Biological fungicides, bioinsecticides, and bionematicides are increasingly incorporated into integrated pest management programs as growers seek alternatives to synthetic chemistries facing tighter regulatory scrutiny. The overlap between crop nutrition and crop protection functions is also increasing, because several biological products support both plant defense responses and stress management. This convergence is influencing product development strategies, portfolio positioning, and commercial partnerships throughout the agricultural biologicals industry.


By Crop Type: Row Crops Drive Volume While Horticultural Crops Drive Innovation
Row crops captured the largest 75.4% of the agricultural biologicals market share in 2025 because soybean, corn, wheat, and rice cultivation cover extensive planted acreage globally. The adoption of large-scale mechanized farming systems has sustained strong demand for inoculants, biofertilizers, and biological crop protection products across these crops. Agricultural producers prefer biological inputs for row crops as even moderate agronomic improvements can yield significant commercial returns over large cultivation areas. Established distribution networks, seasonal repeat usage, and operational scalability further support the penetration of biological products in major field crop systems across both developed and emerging agricultural economies.
Horticultural crops are projected to advance at the fastest CAGR of 9.5% from 2026 to 2031 due to stricter residue management requirements and higher crop value per hectare. Fruits, vegetables, ornamentals, and greenhouse crops increasingly depend on biological solutions to meet export compliance and premium-quality production standards. Biological crop protection products are gaining importance in horticultural systems as growers aim to reduce residues without compromising productivity. Specialty crop producers are more inclined to invest in premium biological programs, as higher commercial returns can more effectively offset product costs compared to large-scale commodity crop categories globally.
Geography Analysis
Europe accounted for the largest 34% share of global revenue in 2025 because stricter sustainability policies, residue standards, and regulatory pressure on conventional crop protection products continue encouraging biological adoption across farming systems. Regional demand is further supported by the alignment between sustainable agriculture objectives and food supply chain requirements. In November 2025, the European Parliament adopted a resolution to accelerate the registration and uptake of biological control agents, including streamlined authorization procedures and enhanced mutual recognition frameworks for biological products. This policy direction is bolstering commercialization opportunities for biological inputs across European agriculture.
North America is projected to achieve the fastest CAGR of 11.8% from 2026 to 2031, supported by expanding biological registrations, organic transition initiatives, and increasing integration of biological products into conventional crop programs. The United States remains the largest contributor in the region, as growers adopt biological inputs for resistance management, soil health improvement, and residue reduction strategies. Commercial demand is also increasing among specialty crop and row crop producers seeking compatibility with integrated pest management systems. Strong private-sector investments in fermentation infrastructure, formulation technologies, and large-scale biological manufacturing are further enhancing regional market competitiveness and product availability.
South America continues to solidify its position through the growing adoption of biological inputs in large-scale agricultural production systems, particularly in Brazil and Argentina. Brazil remains the regional growth hub, with biological inputs increasingly integrated into soybean, corn, sugarcane, and horticultural cultivation programs. In 2025, Brazil approved 162 bio-input products, marking the highest annual level recorded in the country and reinforcing the rapid commercialization of biological solutions in agriculture. The wider use of inoculants and biological crop protection products is further driving adoption across large-acre farming systems.

Competitive Landscape
The agricultural biologicals market is fragmented, with increasing consolidation among companies focusing on biological crop protection, microbial fermentation, and distribution expansion. Leading agricultural input suppliers such as BASF SE, Bayer AG, Corteva, Inc., UPL Limited, and Syngenta Group are enhancing their biological portfolios through acquisitions, production investments, and research collaborations. Competition is shifting towards fermentation scalability, formulation quality, and field-level consistency, rather than merely expanding product portfolios. Companies that successfully integrate biological products into comprehensive crop management programs are strengthening their commercial presence in global agricultural markets.
Specialized biological companies remain highly competitive due to their expertise in microbial formulation, strain selection, and agronomy programs for protected crops. Firms operating in horticultural and specialty crop systems benefit from robust technical advisory networks and strong regional product positioning. Medium-sized biological suppliers are expanding their international presence through distribution partnerships and direct commercial operations in regions such as South America, Europe, and Asia-Pacific. Competitive differentiation increasingly hinges on product reliability, microbial viability, and consistent field performance under varying climatic conditions. These capabilities are critical, as grower confidence relies heavily on the stable efficacy of biological products in diverse commercial farming environments.
Innovation is intensifying competition in upstream areas, including discovery science and platform capabilities. A study published in Chemical and Biological Technologies in Agriculture on Bacillus genomes and antimicrobial peptides in 2025 highlighted that digital screening can significantly accelerate the identification of biological actives compared to traditional discovery methods. Meanwhile, the agricultural biologicals market increasingly favors companies that combine precise discovery processes, scalable production, and consistent field performance. However, this trend continues to support partnerships between platform specialists and established commercial suppliers, rather than creating a winner-takes-all dynamic.
Agricultural Biologicals Industry Leaders
Syngenta Group
Corteva, Inc.
Bayer AG
BASF SE
UPL Limited
- *Disclaimer: Major Players sorted in no particular order


Recent Industry Developments
- April 2026: BASF SE has completed the acquisition of AgBiTech to expand its portfolio in biological insect control and strengthen its agricultural biologicals business. This acquisition enhances BASF's capabilities in biological crop protection, particularly in significant agricultural markets like Brazil.
- April 2026: Valent BioSciences LLC, MGK, and Valent North America LLC have merged to form the new Sumitomo Biorational Company LLC, creating a global center for biorational innovation. This integration enhances capabilities in microbial and botanical technologies, focusing on sustainable agricultural biologicals and crop protection solutions.
- November 2025: Corteva, Inc. has introduced Goltrevo in South America, a broad-spectrum microbial-based insecticide. It is derived from a novel strain of the entomopathogenic fungus Beauveria bassiana 203, originally isolated from palm weevil beetles.


Global Agricultural Biologicals Market Report Scope
Agricultural biologicals are crop input solutions derived from living organisms or natural materials, including microbes, plant-based compounds, and beneficial organisms, designed to improve nutrient efficiency, pest and disease control, and overall crop performance. The Agricultural Biologicals Market Report is segmented by function (crop nutrition and crop protection), by crop type (row crops, horticultural crops, and cash crops), and by geography (North America, South America, Europe, Asia-Pacific, Middle East, and Africa). The market forecasts are provided in value (USD).
| Crop Nutrition | Biofertilizers | Azospirillum |
| Azotobacter | ||
| Mycorrhiza | ||
| Phosphate Solubilizing Bacteria | ||
| Rhizobium | ||
| Other Biofertilizers | ||
| Biostimulants | Amino Acids | |
| Fulvic Acid | ||
| Humic Acid | ||
| Protein Hydrolysates | ||
| Seaweed Extracts | ||
| Other Biostimulants | ||
| Organic Fertilizer | Manure | |
| Meal Based Fertilizers | ||
| Oilcakes | ||
| Other Organic Fertilizers | ||
| Crop Protection | Biocontrol Agents | Macrobials |
| Microbials | ||
| Biopesticides | Biofungicides | |
| Bioherbicides | ||
| Bioinsecticides | ||
| Other Biopesticides | ||
| Row Crops |
| Horticultural Crops |
| Cash Crops |
| North America | United States |
| Canada | |
| Mexico | |
| Rest of North America | |
| South America | Brazil |
| Argentina | |
| Rest of South America | |
| Europe | Germany |
| United Kingdom | |
| France | |
| Spain | |
| Italy | |
| Netherlands | |
| Russia | |
| Turkey | |
| Rest of Europe | |
| Asia-Pacific | China |
| India | |
| Japan | |
| Australia | |
| Vietnam | |
| Thailand | |
| Indonesia | |
| Philippines | |
| Rest of Asia-Pacific | |
| Middle East | Iran |
| Saudi Arabia | |
| Rest of Middle East | |
| Africa | South Africa |
| Nigeria | |
| Egypt | |
| Rest of Africa |
| By Function | Crop Nutrition | Biofertilizers | Azospirillum |
| Azotobacter | |||
| Mycorrhiza | |||
| Phosphate Solubilizing Bacteria | |||
| Rhizobium | |||
| Other Biofertilizers | |||
| Biostimulants | Amino Acids | ||
| Fulvic Acid | |||
| Humic Acid | |||
| Protein Hydrolysates | |||
| Seaweed Extracts | |||
| Other Biostimulants | |||
| Organic Fertilizer | Manure | ||
| Meal Based Fertilizers | |||
| Oilcakes | |||
| Other Organic Fertilizers | |||
| Crop Protection | Biocontrol Agents | Macrobials | |
| Microbials | |||
| Biopesticides | Biofungicides | ||
| Bioherbicides | |||
| Bioinsecticides | |||
| Other Biopesticides | |||
| By Crop Type | Row Crops | ||
| Horticultural Crops | |||
| Cash Crops | |||
| By Geography | North America | United States | |
| Canada | |||
| Mexico | |||
| Rest of North America | |||
| South America | Brazil | ||
| Argentina | |||
| Rest of South America | |||
| Europe | Germany | ||
| United Kingdom | |||
| France | |||
| Spain | |||
| Italy | |||
| Netherlands | |||
| Russia | |||
| Turkey | |||
| Rest of Europe | |||
| Asia-Pacific | China | ||
| India | |||
| Japan | |||
| Australia | |||
| Vietnam | |||
| Thailand | |||
| Indonesia | |||
| Philippines | |||
| Rest of Asia-Pacific | |||
| Middle East | Iran | ||
| Saudi Arabia | |||
| Rest of Middle East | |||
| Africa | South Africa | ||
| Nigeria | |||
| Egypt | |||
| Rest of Africa | |||


Key Questions Answered in the Report
What is driving growth in agricultural biologicals through 2031?
Growth is being supported by tighter residue rules, organic acreage expansion, integrated pest management adoption, and carbon insetting programs driving the market to USD 51.12 billion by 2031.
Which region leads global revenue for agricultural biologicals?
Europe is the largest region, with 34% of market share in 2025.
Which region is expanding the fastest?
North America is the fastest-growing region, with an 11.8% CAGR from 2026 to 2031.
Which function holds the largest share of demand?
Crop nutrition is the largest function and accounted for 64% of value in 2025.
Page last updated on:


