Market Overview
| Study Period | 2021 - 2031 |
|---|---|
| Forecast Data Period | 2026 - 2031 |
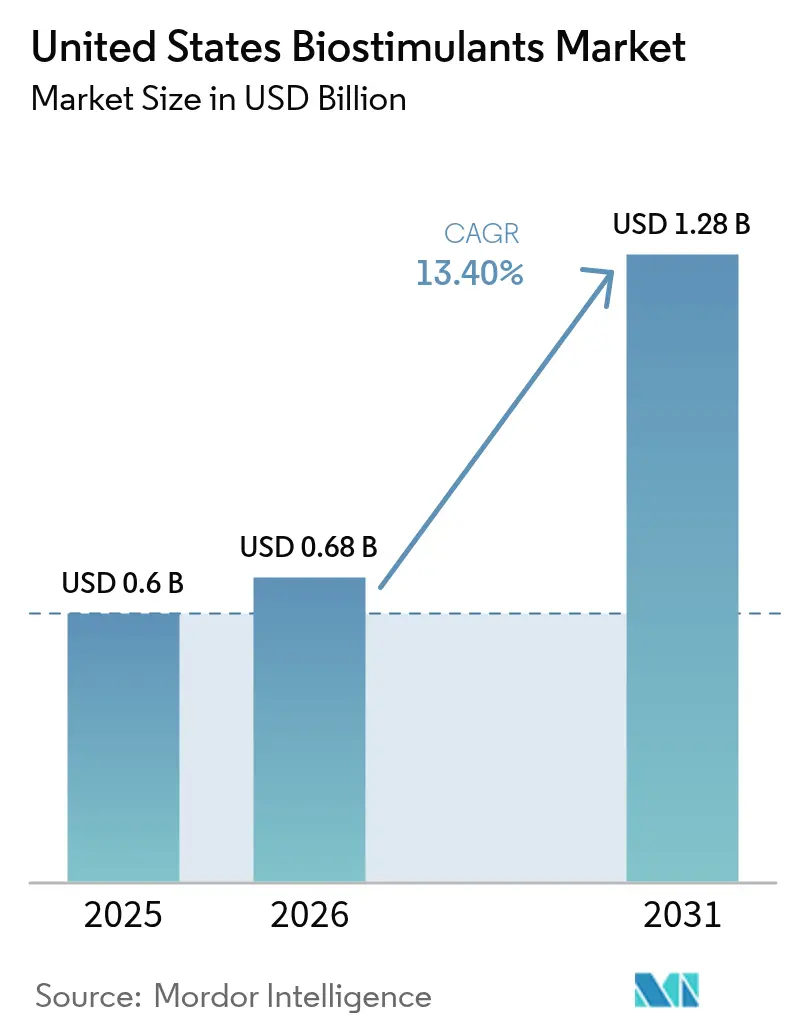
| Base Year Market Size (2025) | USD 0.60 Billion |
| Market Size (2026) | USD 0.68 Billion |
| Market Size (2031) | USD 1.28 Billion |
| Growth Rate (2026 - 2031) | 13.40% CAGR |
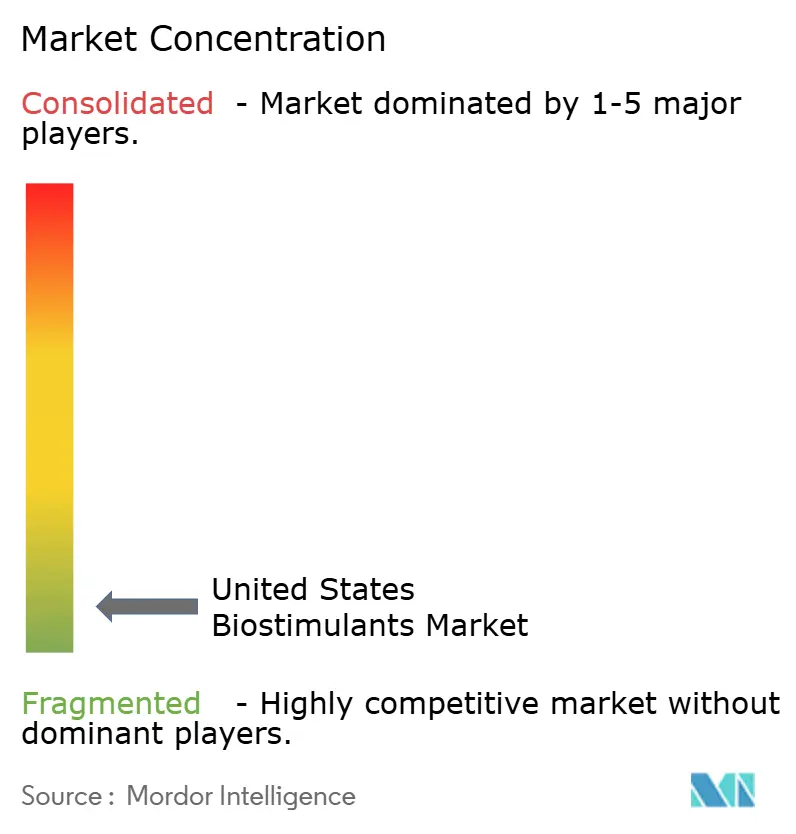
| Market Concentration | Low |
Major Players *Disclaimer: Major Players sorted in no particular order Image © Mordor Intelligence. Reuse requires attribution under CC BY 4.0. | |
United States Biostimulants Market Analysis by Mordor Intelligence
United States biostimulants market size in 2026 is estimated at USD 0.68 billion, growing from 2025 value of USD 0.60 billion with 2031 projections showing USD 1.28 billion, growing at 13.40% CAGR over 2026-2031. Sustained federal cost-share support, retailer mandates for residue-free produce, and rapid formulation advances are converting biological inputs from niche supplements to standard agronomic tools[1]Source: USDA, “Climate-Smart Commodities Initiative,” usda.gov. Growers in high-value specialty crops accept higher input costs to secure premium contracts, while corn and soybean operations rely on nutrient-use efficiency gains to offset fertilizer reductions. Manufacturers are responding with controlled-release technologies and digital advisory platforms that document environmental compliance, strengthening grower confidence and reinforcing demand. Supply-chain diversification, especially for seaweed extracts, remains crucial as West Coast harvest quotas tighten.
Key Report Takeaways
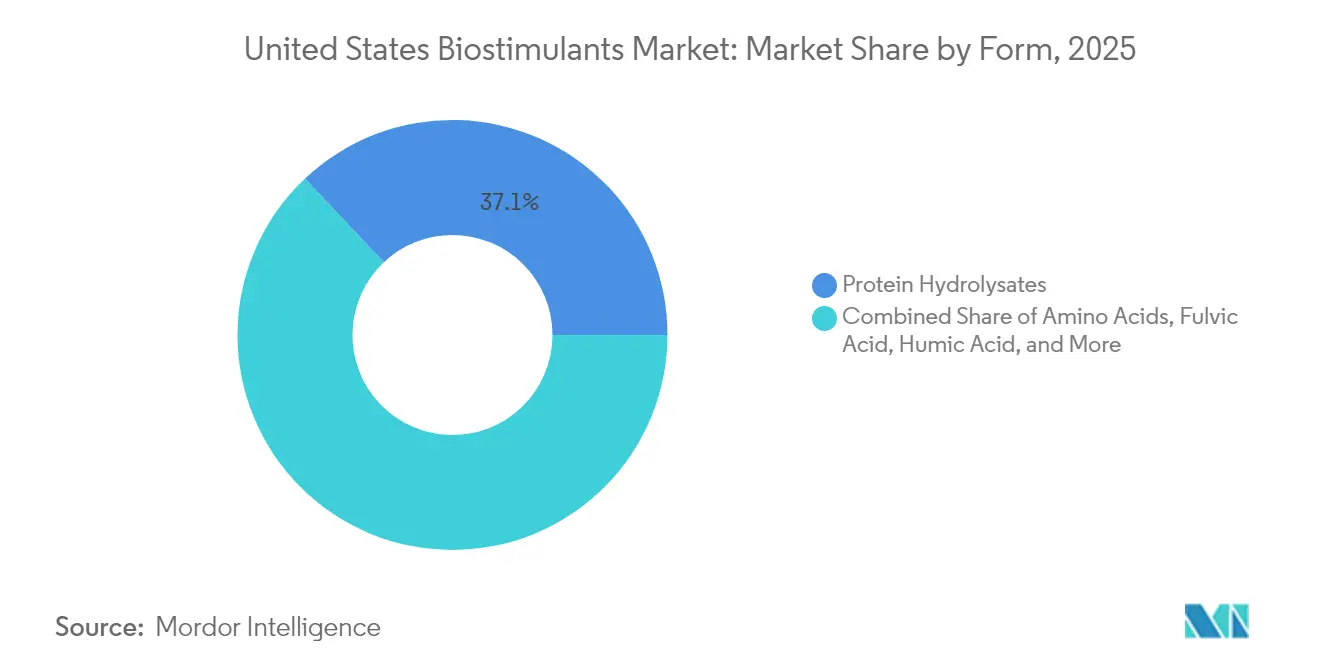
- By form, protein hydrolysates led with 37.05% revenue share in 2025, whereas humic acid is forecast to expand at a 13.85% CAGR through 2031.
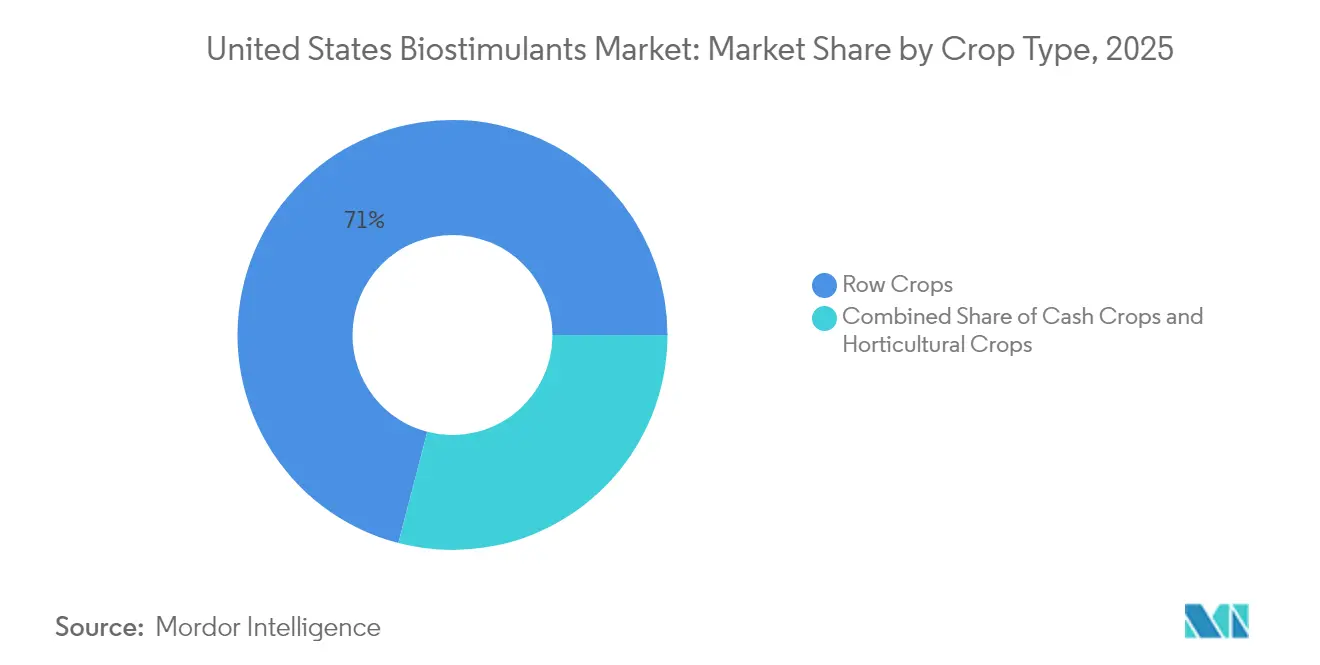
- By crop type, row crops held 70.95% of the United States biostimulants market share in 2025, while horticultural crops are projected to grow at a 13.74% CAGR through 2031.
Note: Market size and forecast figures in this report are generated using Mordor Intelligence’s proprietary estimation framework, updated with the latest available data and insights as of 2026.
United States Biostimulants Market Trends and Insights
Drivers Impact Analysis*
| Driver | (~) % Impact on CAGR Forecast | Geographic Relevance | Impact Timeline |
|---|---|---|---|
| Rise in certified organic acreage and USDA National Organic Program enforcement | +2.1% | National, concentrated in California, Wisconsin, New York | Medium term (2-4 years) |
| Need to boost nutrient-use efficiency and comply with fertilizer-runoff limits | +1.8% | Midwest Corn Belt, Chesapeake Bay watershed, Florida Everglades | Short term (≤ 2 years) |
| Advances in amino-acid chelation and nano-encapsulation improving field efficacy | +1.5% | National, with early adoption in California, Iowa, Illinois | Long term (≥ 4 years) |
| Retailer push for residue-free produce | +1.3% | National, strongest in California, Florida, Arizona specialty crops | Short term (≤ 2 years) |
| USDA Climate-Smart Commodities grants subsidizing biological inputs | +1.0% | National, prioritizing disadvantaged farming communities | Medium term (2-4 years) |
| Ag-tech carbon-credit platforms bundling biostimulants with MRV data | +0.8% | Midwest and Great Plains, expanding to California | Long term (≥ 4 years) |
| Source: Mordor Intelligence | |||


Rise in certified organic acreage and USDA National Organic Program enforcement
Certified organic farmland expanded by 2.7% in 2024 to 5.6 million acres as the USDA National Organic Program tightened enforcement of synthetic input restrictions. The ruling that non-synthetic amino-acid biostimulants retain organic eligibility removed regulatory uncertainty and accelerated adoption. Organic price premiums reached USD 0.40 per pound for corn and USD 2.10 per pound for soybeans, covering the 15-30% cost premium for biological inputs. California leads acreage growth with 1.1 million acres, while the USDA Organic Transition Initiative allocates USD 300 million through 2027 to offset transition-period costs. These incentives magnify demand for the United States biostimulants market among growers shifting away from synthetic additives [2]Source: United States Department of Agriculture, “National Organic Standards Board Rulings,” usda.gov.
Need to Boost Nutrient-Use Efficiency and Comply with Fertilizer-Runoff Limits
State nutrient strategies, such as Iowa’s 45% nitrogen-reduction target and Florida’s Basin Management Action Plans, intensify pressure on growers. Biostimulants improve nutrient-use efficiency by enhancing root development and microbial activity, enabling 10-20% fertilizer reductions without yield loss. The Chesapeake Bay Program recognizes biological inputs as cost-share eligible, with Maryland earmarking USD 15 million annually for adoption. Environmental Protection Agency monitoring in 2024 showed 18% lower nitrate leaching on farms using biostimulants. These quantifiable benefits spur demand across the United States biostimulants market[3]Source: Environmental Protection Agency, “Water Quality Monitoring Data,” epa.gov.
Advances in Amino-Acid Chelation and Nano-Encapsulation Improving Field Efficacy
Recent advances in controlled-release formulations have improved biostimulant consistency and timing. Nano-encapsulation technology enables nutrient delivery that aligns with plant uptake patterns during the growing season. Research collaboration with the University of California Davis shows that nano-encapsulated biostimulants maintain active ingredient stability for 18 months, compared to 6 months for traditional liquid formulations. Patent filings for biostimulant delivery systems increased 42% in 2024, indicating ongoing research investment in new product development through 2027. These technological improvements allow manufacturers to provide performance guarantees, which reduce adoption risks for growers and support premium pricing strategies that enhance industry profitability.
Retailer Push for Residue-Free Produce
Major grocery chains have implemented strict policies regarding pesticide residues on fresh produce, establishing contractual requirements that encourage growers to use biological inputs to prevent chemical detection. Walmart's 2024 supplier standards mandate third-party residue testing and include financial penalties for violations, while Whole Foods Market provides 15-25% price premiums for produce meeting stringent residue requirements. These requirements have developed a two-tier market where growers serving premium channels use biological programs to maintain valuable contract relationships. Fresh produce distributors indicate that crops treated with biostimulants show 23% lower residue detection rates and better shelf life, reducing post-harvest losses. Beyond premium pricing, the secure contracts allow growers to obtain better financing terms and long-term planning stability, supporting increased investment in inputs.
Restraints Impact Analysis*
| Restraint | (~) % Impact on CAGR Forecast | Geographic Relevance | Impact Timeline |
|---|---|---|---|
| Fragmented federal/state regulatory definition for biostimulant products | -1.2% | National, with state-specific variations in California, Texas, Florida | Medium term (2-4 years) |
| Variable field performance across diverse United States agro-climates | -0.9% | National, most pronounced in transition zones between climate regions | Short term (≤ 2 years) |
| Higher upfront cost versus conventional NPK programs | -0.7% | National, greatest impact in commodity crop regions with tight margins | Short term (≤ 2 years) |
| West-Coast kelp-harvest limits creating seaweed-supply volatility | -0.4% | Pacific Coast states, affecting seaweed-dependent formulations | Medium term (2-4 years |
| Source: Mordor Intelligence | |||
Fragmented Federal and State Regulatory Definition for Biostimulant Products
The Association of American Plant Food Control Officials model legislation remains unevenly adopted, forcing manufacturers to navigate conflicting requirements. California requires separate registrations for multi-ingredient products while Texas allows single registrations, increasing compliance costs. The Environmental Protection Agency, United States Department of Agriculture, and Food and Drug Administration harmonization plan extends through 2026, prolonging uncertainty. Smaller firms in the United States biostimulants market face disproportionate burdens, conceding an advantage to larger competitors with dedicated regulatory teams.
Variable Field Performance Across Diverse United States Agro-Climates
Biostimulant performance varies across the United States due to differences in soil types, climate zones, and cropping systems. University extension trials show that amino-acid treatments exhibit 25% efficacy variation between humid Southeast and arid Southwest regions. Humic acid products developed for alkaline Western soils show reduced effectiveness in acidic Eastern soils, requiring region-specific formulations. The absence of standardized field testing protocols complicates product development, as manufacturers rely on limited trial data. Grower surveys indicate 34% of users report inconsistent results across different fields or seasons, leading to reduced usage. These performance variations require extensive local testing and customized recommendations, increasing costs and slowing market expansion.
*Our forecasts treat driver/restraint impacts as directional, not additive. The impact forecasts reflect baseline growth, mix effects, and variable interactions.
Segment Analysis
By Form: Protein Hydrolysates Consolidate Leadership
Protein hydrolysates accounted for 37.05% of the United States biostimulants market size in 2025, reflecting established manufacturing bases and proven stress-tolerance benefits in row crops. Hello Nature USA Inc. leverages vertical integration from raw materials through formulation to deliver consistent quality, enabling competitive pricing that reinforces segment dominance. Amino-acid products rank second, buoyed by Corteva Agriscience’s Sosdia Stress launch that delivered 8% corn yield gains in twelve-state trials. Humic acid holds a smaller share but leads growth at a 13.85% CAGR, aided by granulated controlled-release formats that align with standard fertilizer passes.
Kelp supply limits cap seaweed extract expansion despite strong specialty-crop demand. Fulvic acid remains niche, focusing on soil-conditioning functions. Combination products that merge multiple active ingredients gain traction as the Environmental Protection Agency guidance streamlines registration. These innovations encourage wider experimentation, sustaining momentum across the United States biostimulants market.


By Crop Type: Row Crops Provide Scale, Horticulture Drives Growth
Row crops held 70.95% of the United States biostimulants market share in 2025 as large-acreage corn and soybean operations spread costs over thousands of acres. In the Midwest Corn Belt, nutrient-efficiency mandates reinforce adoption, and bulk purchasing agreements lower per-acre expenses. Cotton and wheat show moderate uptake, constrained by commodity price volatility that limits willingness to pay premiums.
Horticultural crops offer the fastest trajectory with a 13.74% CAGR. California’s Central Valley, responsible for 45% of specialty-crop consumption, leverages export requirements and retailer standards to justify higher input investment. The United States Department of Agriculture Specialty Crop Block Grant Program’s USD 85 million allocation in 2024 funds research that validates biological inputs, further stimulating the United States biostimulants market among fruit and vegetable growers.
Geography Analysis
California holds a significant share of the market, anchored by high-value fruits and vegetables and strict environmental rules that discourage synthetic inputs. Central Valley growers employ seaweed and amino-acid formulations to secure residue-free certifications that support export premiums. Water-use restrictions amplify demand for products that enhance drought resilience, making California a pivotal growth engine within the United States biostimulants market.
Iowa and Illinois contributed through extensive corn and soybean acreage, where protein hydrolysate programs improve nutrient-use efficiency and satisfy nutrient-runoff regulations. Adoption is accelerated by robust extension support and large cooperatives capable of testing new technologies at scale. Texas is leveraging cotton acreage and expanding specialty-crop zones. Humic acid treatments that bolster drought tolerance gain traction across the state’s variable climates.
The Southeast, led by Florida, Georgia, and North Carolina, represented a substantial demand, serving citrus, peanut, and tobacco producers who value stress-mitigation benefits. Florida Basin Management Action Plans drive nutrient-reduction investments, and the region’s multi-season production intensifies input-rotation frequency. The Pacific Northwest focuses on apples and potatoes, where biostimulants enhance storage life and reduce post-harvest losses. Remaining states account for scattered demand, yet federal conservation incentives are gradually increasing adoption, broadening the geographic footprint of the United States biostimulants market.
Competitive Landscape
High fragmentation defines the United States biostimulants market, with the top five players capturing a significant share of revenue. This fragmented structure reflects the diverse crop requirements and regional preferences that prevent any single company from achieving a dominant market position, while enabling rapid innovation cycles as smaller manufacturers can compete effectively through differentiated products and direct grower relationships.
Syngenta AG leverages its comprehensive portfolio spanning seaweed extracts, amino acids, and microbial formulations to maintain market leadership, while Corteva Agriscience has gained significant traction through strategic retail partnerships and the successful commercialization of Sosdia Stress treatments that demonstrate measurable yield improvements in university trials.
Technology integration represents the primary competitive differentiator, with leading manufacturers investing in precision application systems, controlled-release formulations, and digital platforms that provide growers with real-time performance monitoring and optimization recommendations. Vertical integration strategies further shape the competitive landscape, as companies like Hello Nature USA Inc. control raw material sourcing and manufacturing processes to ensure consistent product quality and competitive cost structures that support market expansion in price-sensitive segments.
United States Biostimulants Industry Leaders
BioLine Corporation
Corteva Agriscience
Hello Nature USA Inc.
Humic Growth Solutions Inc.
Syngenta AG
- *Disclaimer: Major Players sorted in no particular order

Recent Industry Developments
- October 2025: Summit Agro Chile SpA introduced its BioPowered portfolio in the United States, which combines biological active ingredients with crop protection chemicals for the United States agricultural market. The portfolio includes biostimulant products Tarma and Spurt.
- June 2025: Syngenta AG opened a 22,000 m² biologicals manufacturing facility in Orangeburg, South Carolina, with a production capacity of 16,000 metric tons per year of biostimulants. The company also integrated the Strains and Natural Products collection from Novartis.
- March 2025: Redox Bio-Nutrients (U.S.) introduced "RDX-N", a stable botanical-extract biostimulant that improves nitrogen metabolism in plants, resulting in approximately 50% increased efficiency in synthetic liquid nitrogen applications.


United States Biostimulants Market Report Scope
The United States Biostimulants Market Report is Segmented by Form (Amino Acids, Fulvic Acid, Humic Acid, Protein Hydrolysates, Seaweed Extracts, Other Biostimulants), Crop Type (Cash Crops, Horticultural Crops, Row Crops). The Market Forecasts are Provided in Terms of Value (USD) and Volume (Metric Tons).
Form
| Amino Acids |
| Fulvic Acid |
| Humic Acid |
| Protein Hydrolysates |
| Seaweed Extracts |
| Other Biostimulants |
Crop Type
| Cash Crops |
| Horticultural Crops |
| Row Crops |
| Form | Amino Acids |
| Fulvic Acid | |
| Humic Acid | |
| Protein Hydrolysates | |
| Seaweed Extracts | |
| Other Biostimulants | |
| Crop Type | Cash Crops |
| Horticultural Crops | |
| Row Crops |


Market Definition
- AVERAGE DOSAGE RATE - The average application rate is the average volume of biostimulants applied per hectare of farmland in the respective region/country.
- CROP TYPE - Crop type includes Row crops (Cereals, Pulses, Oilseeds), Horticultural Crops (Fruits and vegetables) and Cash Crops (Plantation Crops, Fibre Crops and Other Industrial Crops)
- FUNCTION - The Crop Protection function of agirucultural biological include products that prevent or control various biotic and abiotic stress.
- TYPE - Biostimulants boost crop growth and yield by preventing or controlling various abiotic stresses.
| Keyword | Definition |
|---|---|
| Cash Crops | Cash crops are non-consumable crops sold as a whole or part of the crop to manufacture end-products to make a profit. |
| Integrated Pest Management (IPM) | IPM is an environment-friendly and sustainable approach to control pests in various crops. It involves a combination of methods, including biological controls, cultural practices, and selective use of pesticides. |
| Bacterial biocontrol agents | Bacteria used to control pests and diseases in crops. They work by producing toxins harmful to the target pests or competing with them for nutrients and space in the growing environment. Some examples of commonly used bacterial biocontrol agents include Bacillus thuringiensis (Bt), Pseudomonas fluorescens, and Streptomyces spp. |
| Plant Protection Product (PPP) | A plant protection product is a formulation applied to crops to protect from pests, such as weeds, diseases, or insects. They contain one or more active substances with other co-formulants such as solvents, carriers, inert material, wetting agents or adjuvants formulated to give optimum product efficacy. |
| Pathogen | A pathogen is an organism causing disease to its host, with the severity of the disease symptoms. |
| Parasitoids | Parasitoids are insects that lay their eggs on or within the host insect, with their larvae feeding on the host insect. In agriculture, parasitoids can be used as a form of biological pest control, as they help to control pest damage to crops and decrease the need for chemical pesticides. |
| Entomopathogenic Nematodes (EPN) | Entomopathogenic nematodes are parasitic roundworms that infect and kill pests by releasing bacteria from their gut. Entomopathogenic nematodes are a form of biocontrol agents used in agriculture. |
| Vesicular-arbuscular mycorrhiza (VAM) | VAM fungi are mycorrhizal species of fungus. They live in the roots of different higher-order plants. They develop a symbiotic relationship with the plants in the roots of these plants. |
| Fungal biocontrol agents | Fungal biocontrol agents are the beneficial fungi that control plant pests and diseases. They are an alternative to chemical pesticides. They infect and kill the pests or compete with pathogenic fungi for nutrients and space. |
| Biofertilizers | Biofertilizers contain beneficial microorganisms that enhance soil fertility and promote plant growth. |
| Biopesticides | Biopesticides are natural/bio-based compounds used to manage agricultural pests using specific biological effects. |
| Predators | Predators in agriculture are the organisms that feed on pests and help control pest damage to the crops. Some common predator species used in agriculture include ladybugs, lacewings, and predatory mites. |
| Biocontrol agents | Biocontrol agents are living organisms used to control pests and diseases in agriculture. They are alternatives to chemical pesticides and are known for their lesser impact on the environment and human health. |
| Organic Fertilizers | Organic fertilizer is composed of animal or vegetable matter used alone or in combination with one or more non-synthetically derived elements or compounds used for soil fertility and plant growth. |
| Protein hydrolysates (PHs) | Protein hydrolysate-based biostimulants contain free amino acids, oligopeptides, and polypeptides produced by enzymatic or chemical hydrolysis of proteins, primarily from vegetal or animal sources. |
| Biostimulants/Plant Growth Regulators (PGR) | Biostimulants/Plant Growth Regulators (PGR) are substances derived from natural resources to enhance plant growth and health by stimulating plant processes (metabolism). |
| Soil Amendments | Soil Amendments are substances applied to soil that improve soil health, such as soil fertility and soil structure. |
| Seaweed Extract | Seaweed extracts are rich in micro and macronutrients, proteins, polysaccharides, polyphenols, phytohormones, and osmolytes. These substances boost seed germination and crop establishment, total plant growth and productivity. |
| Compounds related to biocontrol and/or promoting growth (CRBPG) | Compounds related to biocontrol or promoting growth (CRBPG) are the ability of a bacteria to produce compounds for phytopathogen biocontrol and plant growth promotion. |
| Symbiotic Nitrogen-Fixing Bacteria | Symbiotic nitrogen-fixing bacteria such as Rhizobium obtain food and shelter from the host, and in return, they help by providing fixed nitrogen to the plants. |
| Nitrogen Fixation | Nitrogen fixation is a chemical process in soil which converts molecular nitrogen into ammonia or related nitrogenous compounds. |
| ARS (Agricultural Research Service) | ARS is the U.S. Department of Agriculture's chief scientific in-house research agency. It aims to find solutions to agricultural problems faced by the farmers in the country. |
| Phytosanitary Regulations | Phytosanitary regulations imposed by the respective government bodies check or prohibit the importation and marketing of certain insects, plant species, or products of these plants to prevent the introduction or spread of new plant pests or pathogens. |
| Ectomycorrhizae (ECM) | Ectomycorrhiza (ECM) is a symbiotic interaction of fungi with the feeder roots of higher plants in which both the plant and the fungi benefit through the association for survival. |


Research Methodology
Mordor Intelligence follows a four-step methodology in all our reports.
- Step-1: Identify Key Variables: In order to build a robust forecasting methodology, the variables and factors identified in Step-1 are tested against available historical market numbers. Through an iterative process, the variables required for market forecast are set and the model is built on the basis of these variables.
- Step-2: Build a Market Model: Market-size estimations for the forecast years are in nominal terms. Inflation is not a part of the pricing, and the average selling price (ASP) is kept constant throughout the forecast period.
- Step-3: Validate and Finalize: In this important step, all market numbers, variables and analyst calls are validated through an extensive network of primary research experts from the market studied. The respondents are selected across levels and functions to generate a holistic picture of the market studied.
- Step-4: Research Outputs: Syndicated Reports, Custom Consulting Assignments, Databases & Subscription Platforms.


