Market Overview
| Study Period | 2018 - 2031 |
|---|---|
| Forecast Data Period | 2026 - 2031 |
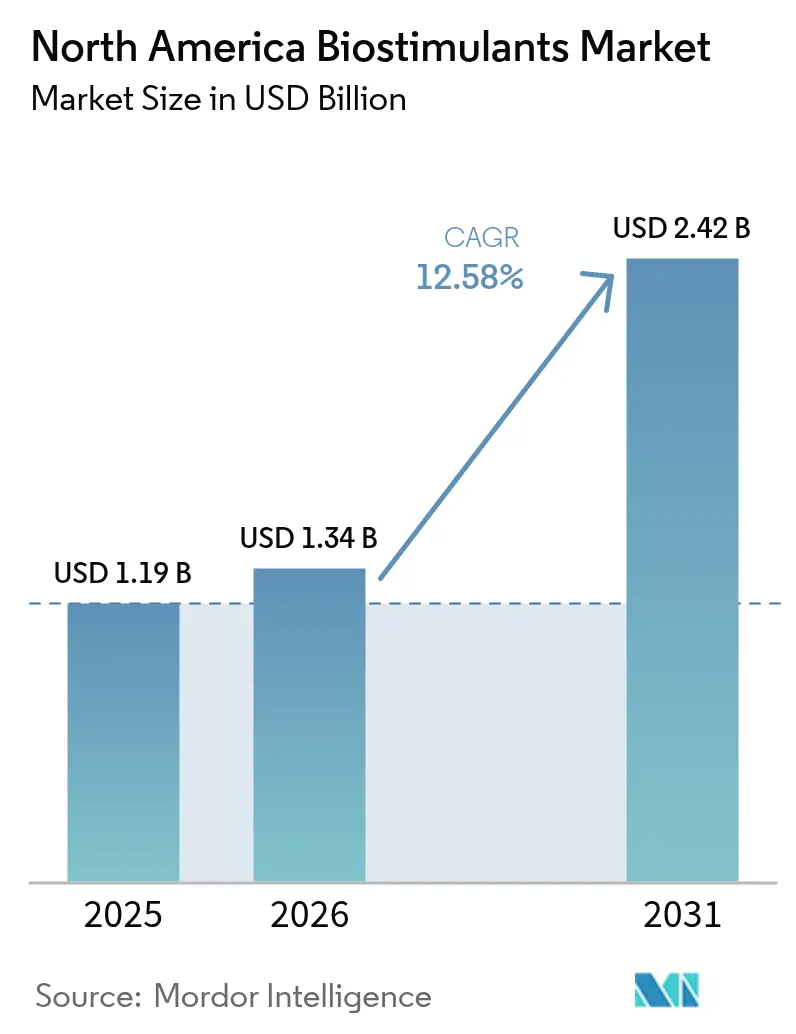
| Base Year Market Size (2025) | USD 1.19 Billion |
| Market Size (2026) | USD 1.34 Billion |
| Market Size (2031) | USD 2.42 Billion |
| Growth Rate (2026 - 2031) | 12.58% CAGR |
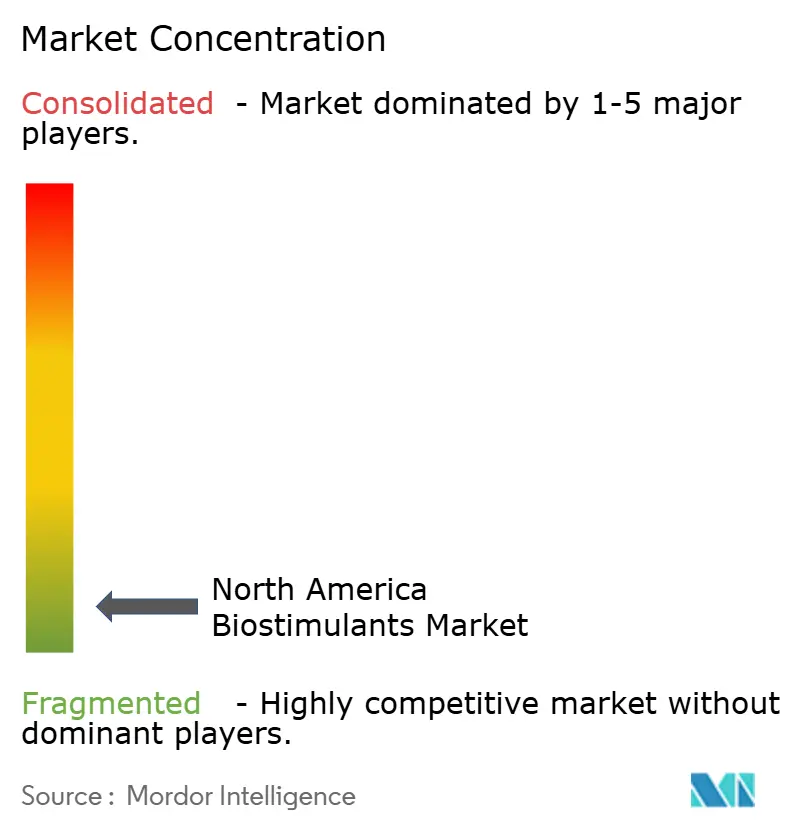
| Market Concentration | Low |
Major Players *Disclaimer: Major Players sorted in no particular order Image © Mordor Intelligence. Reuse requires attribution under CC BY 4.0. | |
North America Biostimulants Market Analysis by Mordor Intelligence
The North America biostimulants market size in 2026 is estimated at USD 1.34 billion, growing from 2025 value of USD 1.19 billion with 2031 projections showing USD 2.42 billion, growing at 12.58% CAGR over 2026-2031. This rapid expansion mirrors the region’s decisive move toward sustainable farming, propelled by stricter regulatory targets, consumer preference for residue-free produce, and sizable public funding for climate-smart practices.[1]Source: United States Department of Agriculture, “Climate-Smart Commodities Partnerships,” usda.gov Protein hydrolysates retain clear product leadership, while humic acid formulations emerge as the fastest riser on the back of carbon-credit opportunities tied to soil organic matter gains. Precision-agriculture hardware accelerates the return on investment from biostimulant use, especially in extensive corn and soybean operations. Controlled-environment agriculture unlocks high-margin demand for standardized recipes that safeguard crop uniformity in greenhouses. Parallel advances in seaweed aquaculture secure raw-material continuity, mitigating past sourcing volatility.
Key Report Takeaways
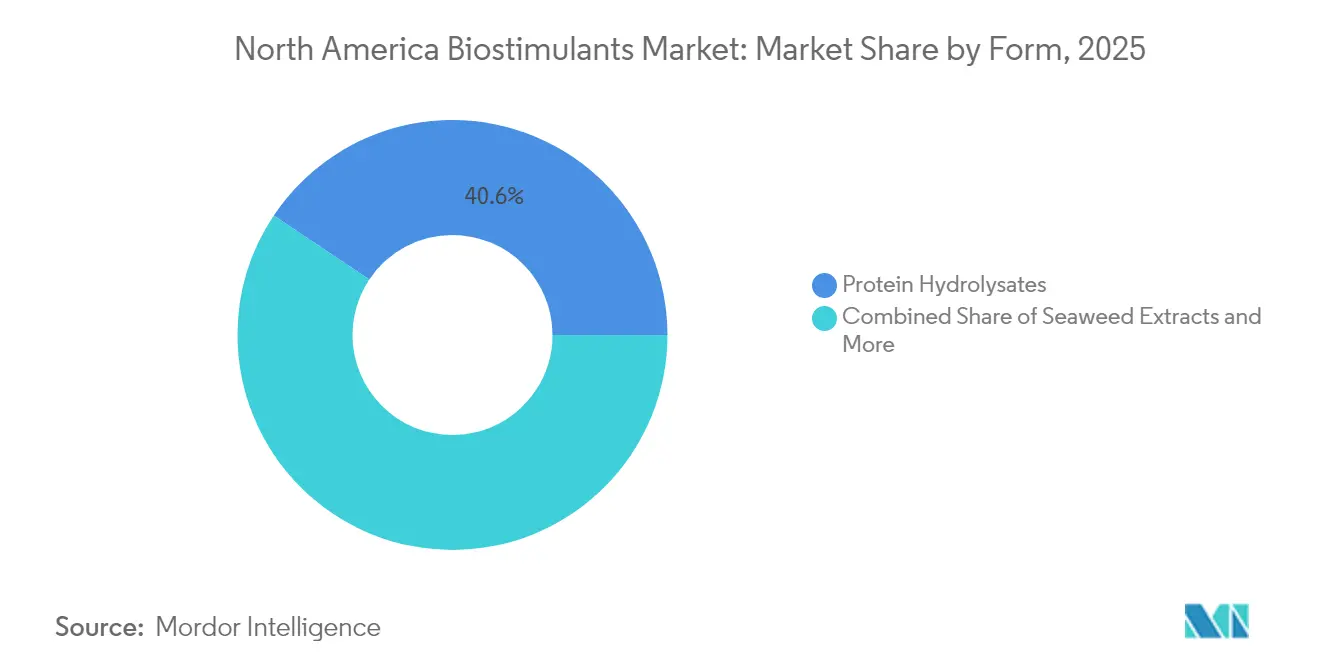
- By form, protein hydrolysates led with 40.62% of the North America biostimulants market share in 2025, while Humic acid is projected to expand at a 13.55% CAGR through 2031, the quickest among all forms.
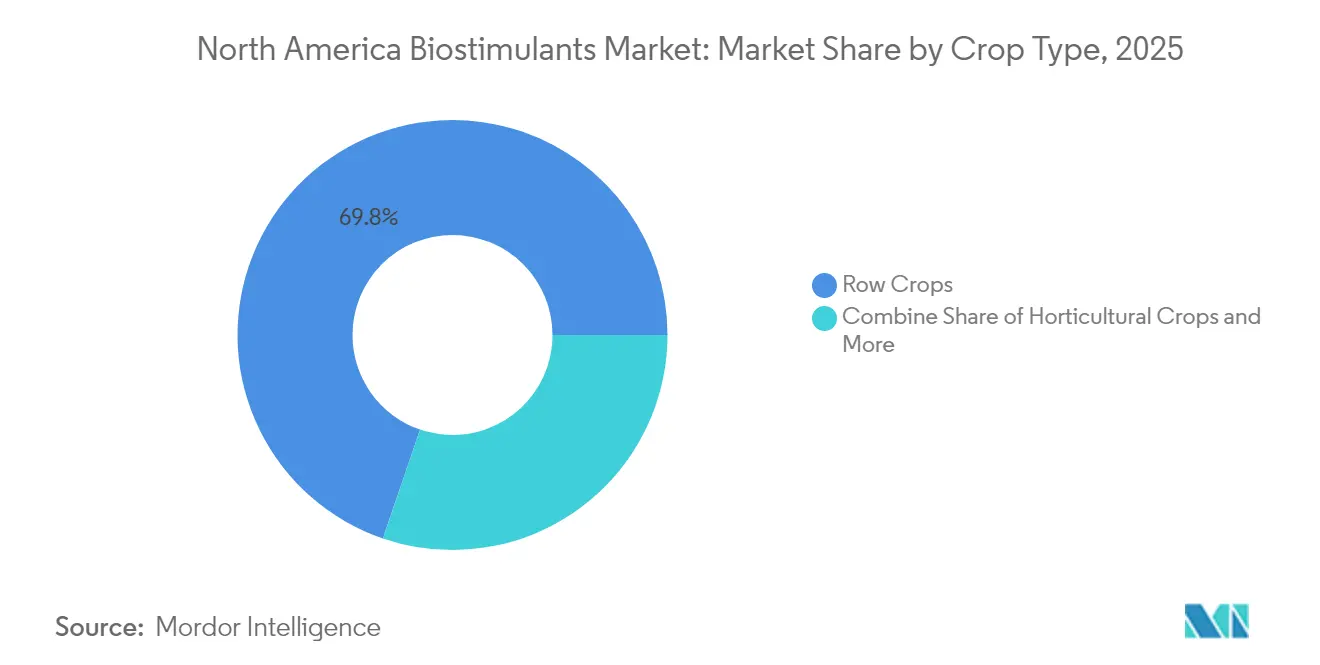
- By crop type, row crops commanded 69.75% of the North America biostimulants market size in 2025, while Horticultural crops exhibit the fastest growth at a 13.21% CAGR to 2031.
- By geography, the United States held 50.12% of the North America biostimulants market in 2025 and is advancing at a 13.24% CAGR.
Note: Market size and forecast figures in this report are generated using Mordor Intelligence’s proprietary estimation framework, updated with the latest available data and insights as of 2026.
Market Trends and Insights
Drivers Impact Analysis of North America Biostimulants Market*
| Driver | (~) % Impact on CAGR Forecast | Geographic Relevance | Impact Timeline |
|---|---|---|---|
| Rising demand for organic and sustainable food | +2.1% | United States and Canada and expansion into Mexico | Medium term (2-4 years) |
| Government incentives and eco-friendly input mandates | +1.8% | Region-wide and strongest in California and Ontario | Short term (≤2 years) |
| Precision-agriculture adoption raises biostimulant ROI | +2.3% | United States Midwest and Canadian Prairies | Medium term (2-4 years) |
| Seaweed aquaculture expansion stabilizes raw-material supply | +1.4% | Atlantic coasts and Pacific Northwest | Long term (≥4 years) |
| Carbon-credit monetization for soil-health improvements | +1.7% | United States and Canada, pilots in Mexico | Long term (≥4 years) |
| Controlled-environment agriculture recipes integration | +1.2% | Urban hubs and greenhouse clusters | Medium term (2-4 years) |
| Source: Mordor Intelligence | |||
Rising Demand for Organic and Sustainable Food
Organic food sales reached USD 63.6 billion in 2024 and continue to outpace total grocery growth.[2]Source: Organic Trade Association, “2024 Organic Industry Survey,” ota.com Certification rules forbid synthetic fertilizers and compel soil-health documentation, which positions biostimulants as core inputs. Institutional buyers such as Aramark and Sodexo are committed to sourcing 20% sustainable ingredients by 2025, amplifying pull-through demand. Retailers require full input transparency, prompting growers to adopt biologicals that enhance yield and environmental credentials. An average 25-30% price premium on organic produce cushions higher upfront costs, allowing the North America biostimulants market to thrive in value-sensitive segments. Continued consumer education campaigns magnify awareness of soil health, further cementing biostimulant relevance.
Government Incentives and Eco-Friendly Input Mandates
The Environmental Quality Incentives Program under the United States Farm Bill now reimburses up to 75% of costs for biological amendments that lift soil organic matter. California’s Healthy Soils Program disbursed USD 75 million in 2024 to encourage humic and fulvic acid use on specialty crops [3]Source: California Department of Food and Agriculture, “Healthy Soils Program,” cdfa.ca.gov. Canada’s Agricultural Clean Technology Program earmarked CAD 25 million (USD 18.4 million) for precision tools that cut synthetic fertilizer needs, which indirectly accelerates biostimulant adoption. These schemes reduce financial risk for growers and generate stable order books for suppliers across the North America biostimulants market. Legislative discussions in Mexico aim to mirror similar incentives, signaling region-wide policy alignment.
Precision-Agriculture Adoption Raises Biostimulant ROI
Variable-rate applicators, soil sensors, and real-time imagery now cover 68% of corn and soybean acres in the United States Midwest. When paired with site-specific data models, targeted biostimulant dosing frequently improves yields by 15-25% compared with blanket application. Equipment makers such as Raven Industries introduced injection kits designed expressly for biological inputs, reducing waste and labor. Cost-benefit analyses from land-grant universities reveal that precise placement cuts payback periods in half. As a result, growers perceive biostimulants less as premium additives and more as calculated yield accelerators within the North America biostimulants market.
Seaweed Aquaculture Expansion Stabilizes Raw-Material Supply
Wild harvest fluctuations previously undercut production reliability for seaweed extracts. Controlled kelp farms are closing that gap. Acadian Seaplants invested USD 50 million in Nova Scotia to cultivate 2,000 hectares of kelp, ensuring consistent biomass intake. Ocean Rainforest demonstrated industrial-scale yields of 1,000 metric tons per hectare in 2024, setting new benchmarks for predictable output. Biostimulant producers now negotiate long-term offtake agreements that lock in pricing and quality, which stabilizes formulation performance and inventory levels. In turn, growers gain confidence that supply will meet seasonal demand peaks, fueling broader uptake across the North America biostimulants market.
Restraints Impact Analysis of North America Biostimulants Market*
| Restraint | (~) % Impact on CAGR Forecast | Geographic Relevance | Impact Timeline |
|---|---|---|---|
| Premium pricing versus conventional fertilizers | -2.4% | North America wide, most acute in commodity crop regions | Short term (≤ 2 years) |
| Regulatory fragmentation across US, Canada, and Mexico | -1.6% | Cross-border trade corridors, multinational operations | Medium term (2-4 years) |
| Retail-channel consolidation squeezes smaller brands | -1.3% | Rural agricultural communities, independent dealers | Medium term (2-4 years) |
| Seasonal volatility in Ascophyllum nodosum harvests | -0.9% | Atlantic coastal processing facilities | Short term (≤ 2 years) |
| Source: Mordor Intelligence | |||
Premium Pricing Versus Conventional Fertilizers
Cost competitiveness remains the primary adoption barrier, with biostimulants typically priced 3-5 times higher per acre than conventional fertilizer programs. The 2024 fertilizer price volatility, which saw nitrogen costs fluctuate between USD 400-800 per metric ton, created temporary windows of improved biostimulant competitiveness but also highlighted farmers' price sensitivity. Economic analysis by the University of Illinois indicates that biostimulants require yield improvements of 8-12% to achieve cost parity with synthetic fertilizers at current pricing levels.
Regulatory Fragmentation Across US, Canada, and Mexico
Divergent regulatory frameworks create market access complications and increase compliance costs for manufacturers operating across North American borders. The United States EPA's guidance documents for biostimulants differ substantially from Canada's Pest Management Regulatory Agency requirements, forcing companies to maintain separate product registrations and efficacy datasets. Mexico's SENASICA approval process requires additional field trials conducted within national borders, adding 18-24 months to market entry timelines for new products.
*Our forecasts treat driver/restraint impacts as directional, not additive. The impact forecasts reflect baseline growth, mix effects, and variable interactions.
North America Biostimulants Market Segment Analysis
By Form:
Protein Hydrolysates Sustain Demand Across Diverse CropsProtein hydrolysates accounted for 40.62% of the North America biostimulants market share in 2025. Their amino acid profile moderates abiotic stress, elevating return potential in both field and greenhouse systems. Seaweed extracts hold significant ground due to organic certification compatibility and emerging evidence of hormone-like activity that boosts root development. Humic acid reflects the fastest growth path at a 13.55% CAGR through 2031, and its contribution to soil carbon now qualifies for voluntary offset credits.
Fulvic acid products find traction in calcareous soils where micronutrient mobility is critical, particularly across the Great Plains. Standardized controlled-environment recipes tighten product specifications, favoring suppliers with robust quality control and agronomy advisory teams. Over the forecast horizon, premium horticulture and carbon-focused row crop programs will continue to anchor volume for protein hydrolysates, while humic and fulvic blends scale rapidly in regenerative rotations. In value terms, the North America biostimulants market size for humic acid formulations is projected to double, reflecting policy support and carbon-credit monetization.


By Crop Type:
Row Crops Dominate but Horticulture Leads GrowthRow crops represented 69.75% of the North America biostimulants market size in 2025 due to expansive corn, soybean, and wheat acreage, where modest yield gains translate into significant revenue. Precision-fertility maps paired with biostimulant spraying create measurable cost savings that reinforce demand. Horticultural crops, although starting from a smaller base, are anticipated to post a 13.21% CAGR through 2031, making them the fastest-growing segment.
Greenhouse vegetables capture high price premiums, and consistent produce appearance motivates repeat biostimulant dosing. Specialty segments such as berries and tree nuts deploy targeted amino acid applications to improve flower retention and fruit set, offsetting labor-intensive thinning costs. Cash crops like cotton and canola increasingly test seaweed extracts for drought resilience. Academic field trials in processing tomatoes across California showed yield uplifts of 12-18%, validating commercial payback. Collectively, yield stabilization amid climate variability remains the unifying theme driving segment expansion in the North America biostimulants market.
Geography Analysis
United States Biostimulants Market
The United States anchors the North America biostimulants market with 50.12% of the total value in 2025, driven by widespread precision-ag platforms and favorable federal and state incentives. California’s Healthy Soils Program disbursed USD 75 million in grants that prioritize humic and fulvic inputs, catalyzing rapid adoption in specialty crops. In the Midwest, 68% of corn and soybean hectares now feature variable-rate applicators, enabling site-specific biological delivery that maximizes profit per acre. University extension networks translate peer-reviewed findings into actionable grower guides, boosting confidence.
Canada Biostimulants Market
Canada’s share, while smaller, is underpinned by the Agricultural Clean Technology Program, which allocates CAD 25 million (USD 18.4 million) to precision-fertility tools. Canola and spring wheat growers in Alberta and Saskatchewan emphasize soil health to protect moisture retention on prairie soils. Streamlined CFIA approvals paired with robust export standards support uptake, especially among producers targeting residue-sensitive European Union buyers.
Mexico Biostimulants Market
Mexico represents an emerging growth frontier. Greenhouse clusters in Baja California invest in biostimulant regimens to meet strict export quality grades and extend shelf life. SENASICA’s requirement for domestic efficacy trials lengthens time to market but ensures product reliability in local conditions. National policies increasingly promote water efficiency, and biologicals that improve nutrient uptake resonate with this goal. These dynamics collectively widen the addressable base for suppliers focused on the North America biostimulants market.
Competitive Landscape
The North America biostimulants market remains highly fragmented in 2025. This low concentration invites acquisition moves by major crop-input corporations eager to complement synthetic portfolios with biological lines. Recent transactions, such as BASF acquiring Plant Response Biotech for USD 150 million, exemplify the push to integrate proprietary protein hydrolysate technologies and established specialty-crop channels.
Patent filings hit 127 in 2024, reflecting intensified research into novel extraction and encapsulation methods that extend shelf life and improve field stability. Vertical integration is rising. Corteva earmarked USD 200 million to expand biostimulant output capacity in Iowa, highlighting a strategy to internalize production and safeguard supply. Manufacturers build alliances with precision hardware vendors to embed application algorithms, transforming biostimulants from stand-alone liquids into data-activated inputs.
Retail consolidation favors suppliers that offer broad product suites and agronomic training, challenging small stand-alone brands. Simultaneously, venture-backed startups leverage machine-learning models to refine timing and rates, threatening incumbents that lack digital chops. Over the forecast period, expect accelerated mergers targeting seaweed supply, fermentation know-how, and carbon-credit validation services within the North America biostimulants market.
North America Biostimulants Industry Leaders
Koppert B.V.
Actagro LLC (Nutrien Ltd.)
Valagro USA (Syngenta)
Humic Growth Solutions Inc.
Agrinos (American Vanguard Corp.)
- *Disclaimer: Major Players sorted in no particular order
North America Biostimulants Market Companies Covered in this Report
- Actagro LLC (Nutrien Ltd.)
- Agriculture Solutions Inc.
- Agrinos (American Vanguard Corp.)
- Agrocare Canada Inc.
- Hello Nature USA Inc. (Italpollina S.p.A.)
- Humic Growth Solutions Inc.
- Koppert B.V.
- Plant Response Biotech Inc. (The Mosaic Company)
- Sigma Agriscience LLC
- Valagro USA (Syngenta)
- Acadian Seaplants Limited
- UPL Ltd.
- BASF SE
- Verdesian Life Sciences (AEA Investors LP)
- FMC Corporation

Recent Industry Developments in North America Biostimulants Market
- July 2025: Yara North America has established a biostimulant demonstration farm in Saskatoon to highlight sustainable crop solutions. This initiative seeks to assess biostimulant performance under practical conditions and support regenerative agriculture practices in Canada.
- June 2025: The Plant Biostimulant Act of 2025, introduced in both the U.S. House and Senate, seeks to amend FIFRA and establish clear regulatory guidelines for biostimulants. This bipartisan effort could transform sustainable agriculture by promoting innovation and market clarity in the U.S. biostimulant sector.
- November 2024: Syngenta Canada has launched YieldON, a liquid foliar biostimulant designed to boost productivity in corn, wheat, and other row crops. It enhances nutrient transport and grain filling, and will be available across Canada for the 2025 growing season.


North America Biostimulants Market Report Scope
The North America Biostimulants Market Report is Segmented by Form (Amino Acids, Fulvic Acid, Humic Acid, Protein Hydrolysates, Seaweed Extracts, and Other Biostimulants), Crop Type (Cash Crops, Horticultural Crops, and Row Crops), and Geography (United States, Canada, Mexico, and the Rest of North America). The Market Forecasts are Provided in Terms of Value (USD) and Volume (Metric Tons).
Segmentation Overview
Form
| Amino Acids |
| Fulvic Acid |
| Humic Acid |
| Protein Hydrolysates |
| Seaweed Extracts |
| Other Biostimulants |
Crop Type
| Cash Crops |
| Horticultural Crops |
| Row Crops |
Country
| Canada |
| Mexico |
| United States |
| Rest of North America |
| Form | Amino Acids |
| Fulvic Acid | |
| Humic Acid | |
| Protein Hydrolysates | |
| Seaweed Extracts | |
| Other Biostimulants | |
| Crop Type | Cash Crops |
| Horticultural Crops | |
| Row Crops | |
| Country | Canada |
| Mexico | |
| United States | |
| Rest of North America |


Market Definition
- AVERAGE DOSAGE RATE - The average application rate is the average volume of biostimulants applied per hectare of farmland in the respective region/country.
- CROP TYPE - Crop type includes Row crops (Cereals, Pulses, Oilseeds), Horticultural Crops (Fruits and vegetables) and Cash Crops (Plantation Crops, Fibre Crops and Other Industrial Crops)
- FUNCTION - The Crop Protection function of agirucultural biological include products that prevent or control various biotic and abiotic stress.
- TYPE - Biostimulants boost crop growth and yield by preventing or controlling various abiotic stresses.
| Keyword | Definition |
|---|---|
| Cash Crops | Cash crops are non-consumable crops sold as a whole or part of the crop to manufacture end-products to make a profit. |
| Integrated Pest Management (IPM) | IPM is an environment-friendly and sustainable approach to control pests in various crops. It involves a combination of methods, including biological controls, cultural practices, and selective use of pesticides. |
| Bacterial biocontrol agents | Bacteria used to control pests and diseases in crops. They work by producing toxins harmful to the target pests or competing with them for nutrients and space in the growing environment. Some examples of commonly used bacterial biocontrol agents include Bacillus thuringiensis (Bt), Pseudomonas fluorescens, and Streptomyces spp. |
| Plant Protection Product (PPP) | A plant protection product is a formulation applied to crops to protect from pests, such as weeds, diseases, or insects. They contain one or more active substances with other co-formulants such as solvents, carriers, inert material, wetting agents or adjuvants formulated to give optimum product efficacy. |
| Pathogen | A pathogen is an organism causing disease to its host, with the severity of the disease symptoms. |
| Parasitoids | Parasitoids are insects that lay their eggs on or within the host insect, with their larvae feeding on the host insect. In agriculture, parasitoids can be used as a form of biological pest control, as they help to control pest damage to crops and decrease the need for chemical pesticides. |
| Entomopathogenic Nematodes (EPN) | Entomopathogenic nematodes are parasitic roundworms that infect and kill pests by releasing bacteria from their gut. Entomopathogenic nematodes are a form of biocontrol agents used in agriculture. |
| Vesicular-arbuscular mycorrhiza (VAM) | VAM fungi are mycorrhizal species of fungus. They live in the roots of different higher-order plants. They develop a symbiotic relationship with the plants in the roots of these plants. |
| Fungal biocontrol agents | Fungal biocontrol agents are the beneficial fungi that control plant pests and diseases. They are an alternative to chemical pesticides. They infect and kill the pests or compete with pathogenic fungi for nutrients and space. |
| Biofertilizers | Biofertilizers contain beneficial microorganisms that enhance soil fertility and promote plant growth. |
| Biopesticides | Biopesticides are natural/bio-based compounds used to manage agricultural pests using specific biological effects. |
| Predators | Predators in agriculture are the organisms that feed on pests and help control pest damage to the crops. Some common predator species used in agriculture include ladybugs, lacewings, and predatory mites. |
| Biocontrol agents | Biocontrol agents are living organisms used to control pests and diseases in agriculture. They are alternatives to chemical pesticides and are known for their lesser impact on the environment and human health. |
| Organic Fertilizers | Organic fertilizer is composed of animal or vegetable matter used alone or in combination with one or more non-synthetically derived elements or compounds used for soil fertility and plant growth. |
| Protein hydrolysates (PHs) | Protein hydrolysate-based biostimulants contain free amino acids, oligopeptides, and polypeptides produced by enzymatic or chemical hydrolysis of proteins, primarily from vegetal or animal sources. |
| Biostimulants/Plant Growth Regulators (PGR) | Biostimulants/Plant Growth Regulators (PGR) are substances derived from natural resources to enhance plant growth and health by stimulating plant processes (metabolism). |
| Soil Amendments | Soil Amendments are substances applied to soil that improve soil health, such as soil fertility and soil structure. |
| Seaweed Extract | Seaweed extracts are rich in micro and macronutrients, proteins, polysaccharides, polyphenols, phytohormones, and osmolytes. These substances boost seed germination and crop establishment, total plant growth and productivity. |
| Compounds related to biocontrol and/or promoting growth (CRBPG) | Compounds related to biocontrol or promoting growth (CRBPG) are the ability of a bacteria to produce compounds for phytopathogen biocontrol and plant growth promotion. |
| Symbiotic Nitrogen-Fixing Bacteria | Symbiotic nitrogen-fixing bacteria such as Rhizobium obtain food and shelter from the host, and in return, they help by providing fixed nitrogen to the plants. |
| Nitrogen Fixation | Nitrogen fixation is a chemical process in soil which converts molecular nitrogen into ammonia or related nitrogenous compounds. |
| ARS (Agricultural Research Service) | ARS is the U.S. Department of Agriculture's chief scientific in-house research agency. It aims to find solutions to agricultural problems faced by the farmers in the country. |
| Phytosanitary Regulations | Phytosanitary regulations imposed by the respective government bodies check or prohibit the importation and marketing of certain insects, plant species, or products of these plants to prevent the introduction or spread of new plant pests or pathogens. |
| Ectomycorrhizae (ECM) | Ectomycorrhiza (ECM) is a symbiotic interaction of fungi with the feeder roots of higher plants in which both the plant and the fungi benefit through the association for survival. |


Research Methodology
Mordor Intelligence follows a four-step methodology in all our reports.
- Step-1: Identify Key Variables: In order to build a robust forecasting methodology, the variables and factors identified in Step-1 are tested against available historical market numbers. Through an iterative process, the variables required for market forecast are set and the model is built on the basis of these variables.
- Step-2: Build a Market Model: Market-size estimations for the forecast years are in nominal terms. Inflation is not a part of the pricing, and the average selling price (ASP) is kept constant throughout the forecast period.
- Step-3: Validate and Finalize: In this important step, all market numbers, variables and analyst calls are validated through an extensive network of primary research experts from the market studied. The respondents are selected across levels and functions to generate a holistic picture of the market studied.
- Step-4: Research Outputs: Syndicated Reports, Custom Consulting Assignments, Databases & Subscription Platforms.


