Market Overview
| Study Period | 2021 - 2031 |
|---|---|
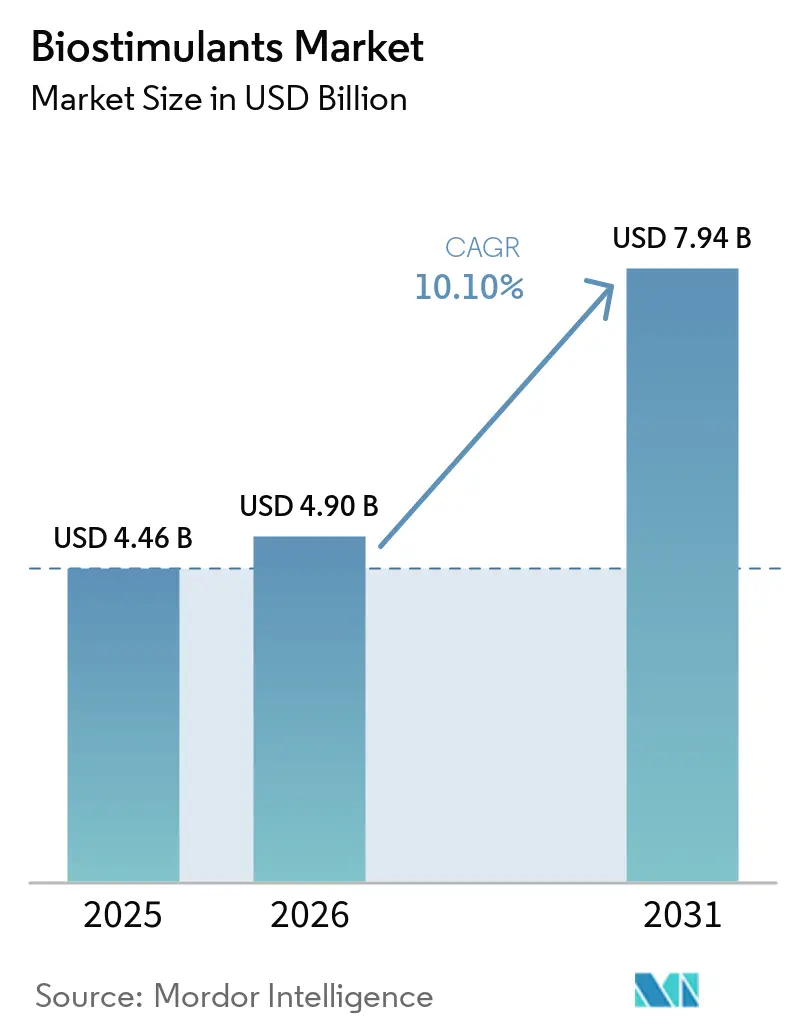
| Market Size (2026) | USD 4.90 Billion |
| Market Size (2031) | USD 7.94 Billion |
| Growth Rate (2026 - 2031) | 10.10% CAGR |
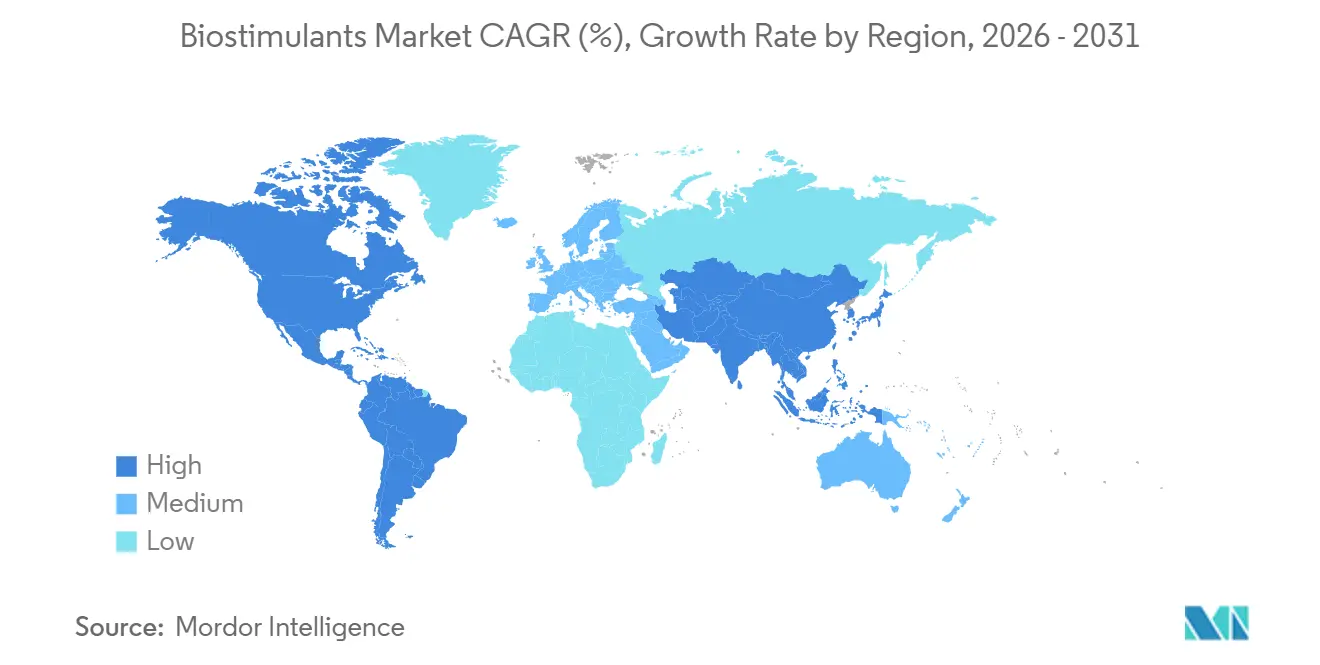
| Fastest Growing Market | North America |
| Largest Market | Europe |
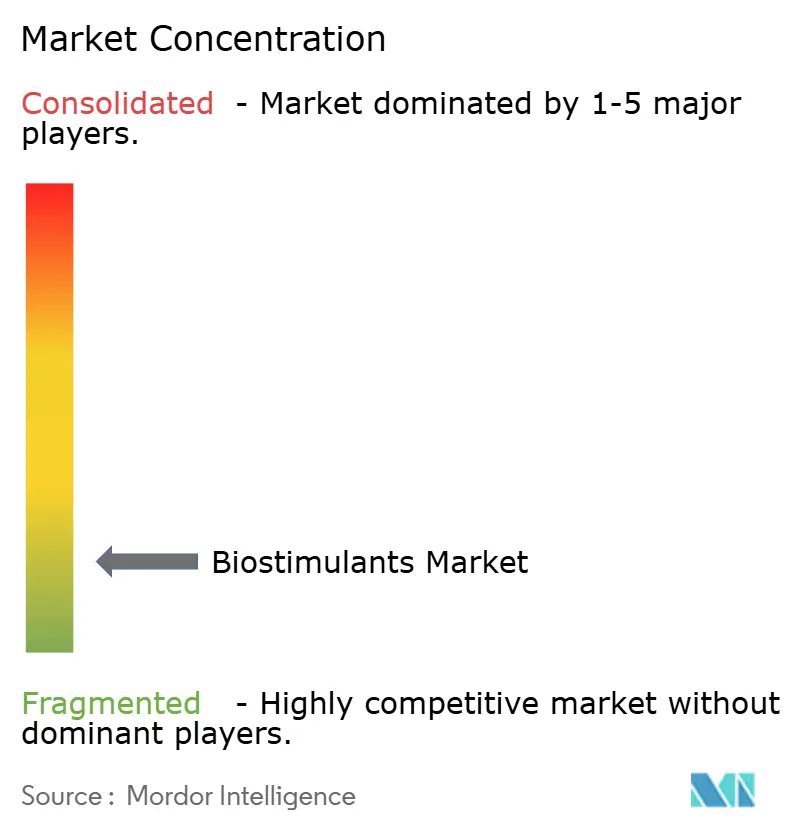
| Market Concentration | Low |
Major Players *Disclaimer: Major Players sorted in no particular order Image © Mordor Intelligence. Reuse requires attribution under CC BY 4.0. | |
Biostimulants Market Analysis by Mordor Intelligence
The biostimulants market size is projected to grow from USD 4.46 billion in 2025 to USD 4.90 billion in 2026 and reach USD 7.94 billion by 2031, registering a CAGR of 10.1% during 2026-2031. This growth trajectory reflects a shift in farm input strategies, with growers incorporating biostimulants as a standard component of crop management programs rather than limiting their use to field trials. The demand for biostimulants is outpacing that of conventional fertilizers as growers seek improved nutrient efficiency, enhanced tolerance to heat and water stress, and reduced exposure to fluctuations in fertilizer prices. Regulatory recognition in Europe has provided the biostimulants market with a clearer product identity. Additionally, production investments by major input suppliers are increasing the importance of scale, regulatory compliance, and integrated distribution in market competition. Feedstock concentration in seaweed extracts and limited microbial approval pathways in Europe are creating tighter supply conditions in certain segments of the market, favoring companies with secure sourcing and compliance capabilities. Furthermore, the biostimulants market is benefiting from climate-smart farming initiatives and soil-carbon programs, linking adoption not only to farm productivity but also to sustainability-driven revenue opportunities in key agricultural regions.
Key Report Takeaways
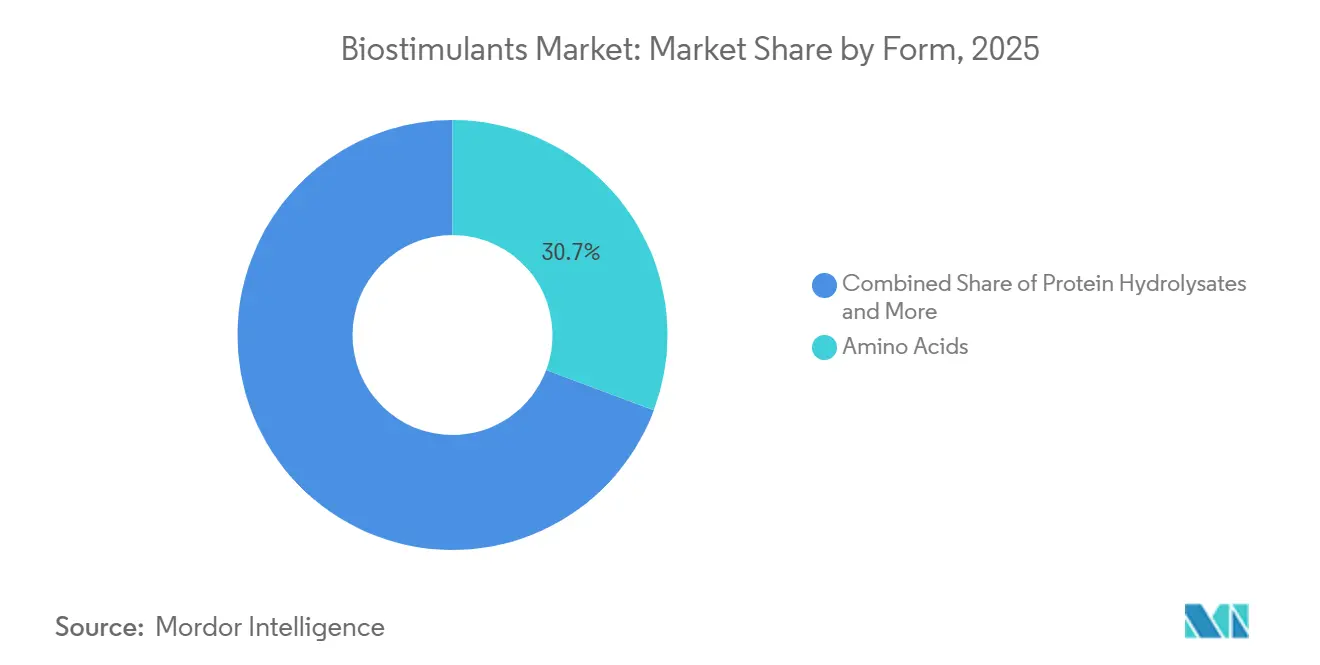
- By form, amino acids accounted for the largest 30.7% of revenue share in 2025, while humic acid is set to expand at the fastest 12.6% CAGR from 2026 to 2031.
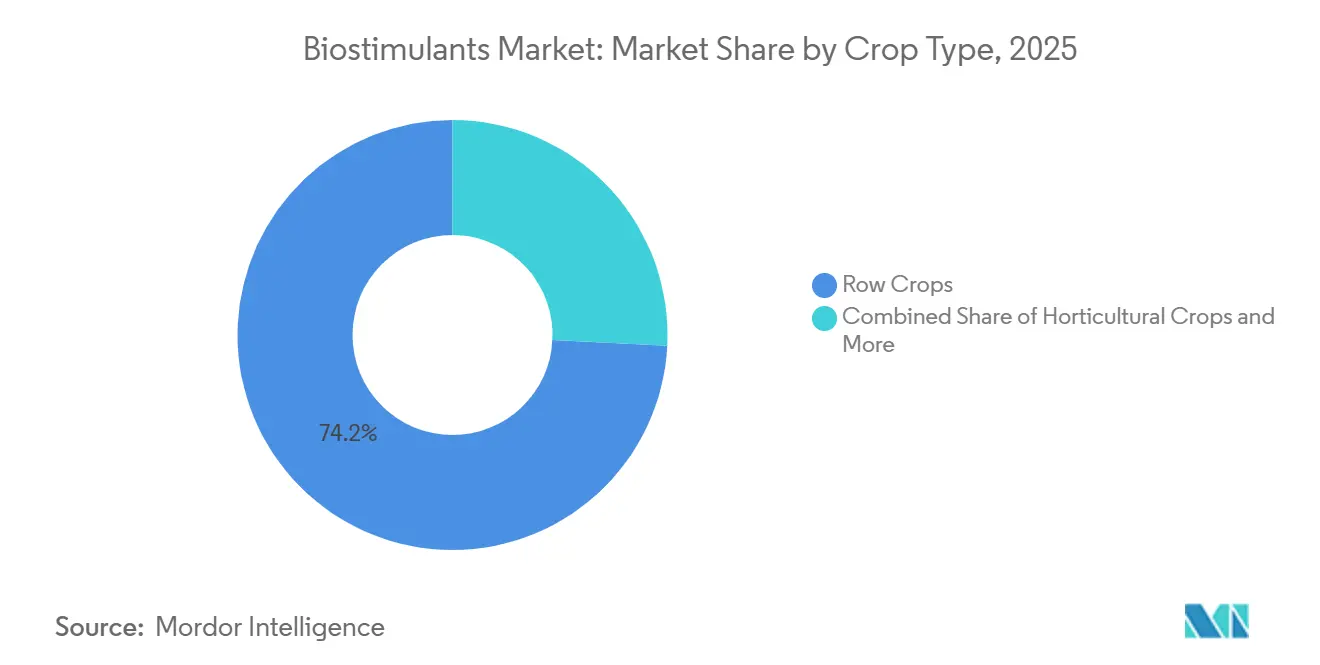
- By crop type, the biostimulants market share for the row crops segment accounted for the largest 74.2% in 2025, while the biostimulants market size for the horticultural crops segment is projected to grow at the fastest 10.9% CAGR from 2026 to 2031.
- By geography, Europe held the largest 38.3% of revenue share in 2025, while North America is poised to grow at the fastest 12.7% CAGR from 2026 to 2031.
Note: Market size and forecast figures in this report are generated using Mordor Intelligence’s proprietary estimation framework, updated with the latest available data and insights as of 2026.
Global Biostimulants Market Trends and Insights
Drivers Impact Analysis*
| Driver | (~) % Impact on CAGR Forecast | Geographic Relevance | Impact Timeline |
|---|---|---|---|
| Sustainable crop-input adoption | +2.0% | Global, led by North America and Europe | Medium term (2-4 years) |
| Organic acreage and residue-sensitive value chains | +1.5% | Europe, South America, and Asia-Pacific | Medium term (2-4 years) |
| Regulatory recognition and product-legitimacy gains | +1.2% | Europe, North America, and India | Medium term (2-4 years) |
| Abiotic-stress and yield-stability proof points | +1.0% | Global, with highest urgency in the Middle East and North Africa and South Asia | Medium term (2-4 years) |
| Carbon and nature-credit monetization pathways | +0.8% | North America and Europe | Long term (≥ 4 years) |
| Seed and fertilizer-program integration | +0.7% | North America, Europe, and Asia-Pacific | Short term (≤ 2 years) |
| Source: Mordor Intelligence | |||
Sustainable Crop-Input Adoption
The adoption of sustainable crop inputs remains a key driver of demand in the biostimulants market, as it aligns with both current farm economics and agronomic requirements. Fertilizer price volatility following the COVID-19 pandemic has influenced growers to reassess input decisions. Many farms are now using biostimulants to enhance nutrient efficiency rather than as replacements for standard fertilizer programs. This shift is significant as it integrates biostimulants into core crop budgets, often resulting in repeat usage after initial trial cycles. A 2025 study by researchers from the University of Córdoba, Spain, demonstrated that amino acid biostimulants combined with slow-release urea increased grain protein content by up to 4.2% compared to untreated controls under semi-arid conditions.
Organic Acreage and Residue-Sensitive Value Chains
Organic acreage and residue-sensitive value chains are expanding the customer base of the biostimulants market beyond traditional crop systems. Retailer sourcing requirements are driving additional demand, as residue-free procurement standards often encourage growers to adopt biological solutions, even in the absence of formal regulatory mandates. According to the Economic Research Service of the United States Department of Agriculture, organic food sales reached USD 65.4 billion in 2024, indicating strong downstream demand[1]Source: United States Department of Agriculture Economic Research Service, “Organic Agriculture,” ERS USDA, ers.usda.gov. This is significant for the biostimulants market, as its adoption is no longer confined to a small organic segment. Row-crop growers and high-value horticultural producers are increasingly responding to similar buyer pressures from food and export markets.
Regulatory Recognition and Product-Legitimacy Gains
Regulatory recognition has provided the biostimulants market with a level of product legitimacy that was previously lacking. Updated guidance from the European Commission has clarified labeling requirements and criteria for biological-origin products, which is particularly significant for amino acid products aiming to enter organic systems. Similarly, India is progressing in this direction through amendments to the Fertilizer Control Order. Such recognition typically enhances grower trust, which often precedes increased penetration rates on a larger scale. As more countries establish dedicated regulatory pathways, the biostimulants market becomes easier to communicate to distributors, agronomists, and growers, thereby shortening the sales cycle and facilitating broader portfolio expansion.
Abiotic-Stress and Yield-Stability Proof Points
Abiotic stress factors are driving growth in the biostimulants market as growers seek solutions to maintain yield stability under conditions such as heat, salinity, drought, and soil degradation. Researchers from the University of Debrecen, Hungary, published in Chemical and Biological Technologies in Agriculture in 2025, demonstrated that humic acid applications increased total root length by 55%, root surface area by 30%, and lateral root formation by 85% in maize under optimal treatment conditions. Additionally, a 2025 study conducted by researchers from the Agricultural University of Plovdiv, Bulgaria, and Hochschule Geisenheim University, Germany, found that Ascophyllum nodosum extract enhanced pepper yields by 28% to 46% and eggplant yields by 81% to 108% in open-field trials. These results are bolstering confidence in achieving measurable agronomic benefits, particularly in horticultural and export-oriented crop systems.
Restraints Impact Analysis*
| Restraint | (~) % Impact on CAGR Forecast | Geographic Relevance | Impact Timeline |
|---|---|---|---|
| Fragmented global definitions and claim rules | -1.0% | Outside Europe, especially Africa, Southeast Asia, and South Asia | Long term (≥ 4 years) |
| Inconsistent field performance across conditions | -0.8% | Global, with highest exposure in Sub-Saharan Africa and South Asia | Medium term (2-4 years) |
| Tighter claim-enforcement and reclassification risk | -0.6% | Europe and North America | Medium term (2-4 years) |
| Seaweed feedstock concentration and harvest volatility | -0.5% | Global, with strongest effect on European and North American buyers | Medium term (2-4 years) |
| Source: Mordor Intelligence | |||
Fragmented Global Definitions and Claim Rules
Fragmented legal definitions continue to constrain the biostimulants market in many regions outside Europe. In several countries across Africa, Southeast Asia, and South Asia, these products are regulated under pesticide-style statutes. This results in extended data requirements and prolonged registration timelines, which many suppliers find challenging to manage. According to the European Biostimulants Industry Council (EBIC), current compliance rules, including positive-list restrictions and chemical safety requirements, pose significant challenges, particularly for smaller companies aiming to commercialize new microbial solutions. This issue is closely tied to claim-enforcement risks, as suppliers may invest in product development only to encounter varying claim standards or differing product classifications across jurisdictions. Until a broader international framework is established, the biostimulants market is projected to grow unevenly, with regulatory differences influencing competition nearly as much as agronomic performance.
Inconsistent Field Performance Across Conditions
Inconsistent field performance remains a restraint in the biostimulants market, as product efficacy varies significantly with temperature conditions, soil biology, and crop growth stages. Research published in the SABRAO Journal of Breeding and Genetics in 2025 highlighted that amino acid biostimulant treatments in Kazakhstan showed stronger agronomic responses during the 2023 growing season compared to the hotter 2024 season. This finding confirms that environmental variability directly impacts the consistency of field performance. Such variability poses challenges for grower confidence, as outcomes often differ across regions and seasons. Consequently, biostimulant suppliers need to conduct more localized validation trials, provide agronomic advisory support, and enhance distributor training to facilitate broader commercial adoption in price-sensitive agricultural markets.
*Our forecasts treat driver/restraint impacts as directional, not additive. The impact forecasts reflect baseline growth, mix effects, and variable interactions.
Segment Analysis
By Form: Amino Acids Lead, Humic Acid Builds Momentum Across Broadacre Programs
Amino acids held the largest 30.7% of revenue share in 2025. This dominance is attributed to their broad compatibility with fertigation systems, nutrient-efficiency programs, and stress-management applications across various crop categories. Amino acid formulations are widely used in cereals, vegetables, and horticultural crops due to their seamless integration into existing fertilizer schedules and crop-protection routines. The segment benefits from strong repeat-purchase behavior in commercial farming systems, where growers prioritize operational simplicity and measurable crop-quality improvements. Additionally, their stable shelf life, ease of handling, and increasing incorporation into biological input programs continue to drive adoption in large-scale agricultural production regions worldwide.
Humic acid is set to grow at the fastest 12.6% CAGR from 2026 to 2031. This growth is driven by rising concerns over soil degradation, nutrient-use efficiency, and drought-related crop stress in commercial agriculture. Humic acid formulations are increasingly adopted in corn, soybean, and cereal systems due to their ability to enhance nutrient availability and support root-zone activity under varying field conditions. Fulvic acid products are also gaining traction for their rapid plant interaction and chelation properties, while seaweed extracts remain significant for stress-management applications. Product innovation is increasingly focused on multi-active biological blends integrated into fertilizer and seed-treatment programs within mainstream agricultural production systems.


By Crop Type: Row Crops Hold Scale, Horticulture Delivers Faster Value Growth
The biostimulants market share for the row crops segment held the largest 74.2% in 2025. The extensive cultivation of crops such as corn, soybean, wheat, and rice continues to drive strong demand for biological products that enhance nutrient efficiency and manage stress. Biostimulants are increasingly incorporated into fertilizer-linked programs rather than being marketed solely as inputs for specialty crops. Large-scale commercial farming operations are adopting these products due to their ability to improve crop resilience and optimize nutrient use under changing environmental conditions. Adoption in row crops is further supported by robust agronomic advisory networks and expanded dealer distribution channels, which enhance product accessibility and promote recurring use across global agricultural production systems.
The biostimulants market size for the horticultural crops segment is forecasted to grow at the fastest 10.9% CAGR from 2026 to 2031. This growth is driven by the higher economic value of fruits, vegetables, and specialty crops, where even moderate improvements in yield and quality significantly impact farm profitability. Horticultural growers are increasingly using seaweed extracts, amino acids, and microbial formulations to enhance stress tolerance, improve fruit appearance, and extend shelf life. Export-oriented crop systems are also fostering greater biostimulant adoption, as residue management and crop quality consistency are critical purchasing factors. This trend is particularly evident in protected cultivation, vineyards, and specialty vegetable production systems across Europe, South America, and the Asia-Pacific regions.
Geography Analysis
Europe accounted for the largest 38.3% of the market share in 2025. The region maintains leadership because the European Union regulation, which established a formal legal framework for plant biostimulants, has improved product standardization and cross-border commercialization. Europe also benefits from strong organic farming adoption and greater regulatory support for sustainable agricultural inputs. Countries including Spain, France, Germany, and Italy continue driving demand because their cereal, horticultural, olive, and wine industries prioritize residue management and export quality standards. Advanced agronomic advisory networks and stronger biological input awareness further support commercial adoption across both broadacre and high-value agricultural production systems throughout the region.
The North America market size is projected to grow at the fastest 12.7% CAGR from 2026 to 2031. Growth is supported by precision agriculture expansion, climate-smart farming programs, and increasing interest in nutrient-efficiency products across large-scale farming operations. The United States and Canada continue to increase biological input integration into corn, soybean, vegetable, and specialty-crop systems. Strong dealer infrastructure and advanced farm-management practices are also accelerating the adoption of biostimulant formulations linked to fertilizer optimization and stress management. Commercial growers increasingly evaluate these products through measurable agronomic outcomes rather than experimental use, strengthening recurring demand across row-crop and horticultural production systems throughout the regional agricultural sector.
The Asia-Pacific region is strengthening its position through the expansion of sustainable agriculture initiatives and increased adoption of biological inputs. According to the Press Information Bureau, Government of India, 146 biostimulant products had been included under Schedule VI of the Fertilizer Control Order (FCO) by September 2025 to regulate product quality, efficacy, and commercialization standards[2]Source: Press Information Bureau, “146 Biostimulant Products Included Under Fertilizer Control Order,” Government of India, pib.gov.in. India and China are actively supporting biological and sustainable nutrient-management programs to reduce reliance on conventional agricultural inputs. South America remains significant due to its export-oriented production systems for soybeans, coffee, and fruits. Meanwhile, the Middle East and Africa are witnessing the gradual adoption of biological inputs, driven by challenges such as drought stress, salinity exposure, and soil-quality management priorities.

Competitive Landscape
The market is moderately fragmented, and competition is divided between diversified crop-input manufacturers and specialized biological-product suppliers. Key players such as Syngenta Crop Protection AG, BASF SE, UPL Limited, FMC Corporation, and Bayer AG compete alongside specialized companies like BioAtlantis Ltd. and Rovensa Next S.L. Large multinational suppliers leverage extensive distribution networks and regulatory resources, while specialized companies focus on crop-specific biological solutions and localized agronomic support within diverse agricultural production systems.
Competitive strategies increasingly focus on production capacity expansion, biological portfolio integration, and technology partnerships. Companies are enhancing their pipelines for microbial, amino acid, and seaweed-based products to improve stress management and nutrient efficiency in commercial agriculture. Strategic acquisitions and partnership agreements are accelerating as suppliers aim to gain quicker access to biological technologies and regional distribution networks. Product development is shifting toward integrated biological platforms rather than standalone formulations, reflecting the growing demand for combined crop nutrition and resilience solutions. Additionally, manufacturers are investing more in agronomic field validation and regulatory compliance to strengthen their commercial positioning across various agricultural markets and crop-production systems globally.
The competitive environment is increasingly shifting toward integrated biological production platforms supported by large-scale manufacturing capacity and regional supply-chain control. For instance, Syngenta AG inaugurated a 22,000-square-meter biologicals facility in Orangeburg, South Carolina, in June 2025, with an annual production capacity of 16,000 metric tons of biostimulants[3]Source: Syngenta, “Syngenta to Become Global Leader in Biologicals; Expanding Nature Inspired Solutions for Farmers,” Syngenta, syngenta.com. Companies are increasingly integrating biological products with broader crop-input systems that address nutrient efficiency, stress management, and sustainability goals. Suppliers with strong regulatory expertise, advanced formulation capabilities, and localized agronomic support are enhancing their competitive positioning as the adoption of biological agriculture expands across global commercial farming operations.
Biostimulants Industry Leaders
UPL Limited
Syngenta Crop Protection AG (Syngenta Group)
FMC Corporation
BASF SE
Bayer AG
- *Disclaimer: Major Players sorted in no particular order

Recent Industry Developments
- March 2026: BASF SE has finalized the acquisition of AgBiTech, a company specializing in biological crop protection with a significant presence in Brazil. This acquisition enhances BASF's biologicals portfolio and expands its manufacturing capabilities in South America, a region experiencing growing adoption of biostimulant inputs in the soybean, coffee, and sugarcane supply chains.
- June 2025: Syngenta Crop Protection AG inaugurated a 22,000-square-meter biologicals manufacturing facility in Orangeburg, South Carolina, with an annual production capacity of 16,000 metric tons of biostimulants. This development positioned Syngenta among the largest captive biostimulant producers in North America and enhanced its existing operations in Brazil, Italy, India, and Norway.
- February 2025: Syngenta Crop Protection AG and Ceres Biotics have announced a global strategic partnership to launch VIXERAN, a biostimulant derived from the endophytic bacterium Azotobacter salinestris strain CECT9690.


Global Biostimulants Market Report Scope
Biostimulants are natural or biologically derived substances and microorganisms that promote plant growth, improve nutrient efficiency, enhance stress tolerance, and boost crop quality. They are utilized in agriculture to strengthen plant resilience against abiotic stresses such as drought, salinity, and heat, while contributing to sustainable crop productivity.
The biostimulants market report is segmented by form into amino acids, fulvic acid, humic acid, protein hydrolysates, seaweed extracts, and other biostimulants, by crop type into cash crops, horticultural crops, and row crops, and by geography into North America, South America, Europe, Asia-Pacific, the Middle East, and Africa. The market forecasts are provided in terms of value in USD and volume in metric tons.
By Form
| Amino Acids |
| Fulvic Acid |
| Humic Acid |
| Protein Hydrolysates |
| Seaweed Extracts |
| Other Biostimulants |
By Crop Type
| Row Crops |
| Horticultural Crops |
| Cash Crops |
By Geography
| North America | United States |
| Canada | |
| Mexico | |
| Rest of North America | |
| South America | Brazil |
| Argentina | |
| Rest of South America | |
| Europe | Germany |
| France | |
| Italy | |
| Spain | |
| United Kingdom | |
| Russia | |
| Netherlands | |
| Rest of Europe | |
| Asia-Pacific | China |
| India | |
| Japan | |
| Australia | |
| Indonesia | |
| Thailand | |
| Vietnam | |
| Philippines | |
| Rest of Asia-Pacific | |
| Middle East | Saudi Arabia |
| Iran | |
| Turkey | |
| Rest of Middle East | |
| Africa | South Africa |
| Egypt | |
| Nigeria | |
| Rest of Africa |
| By Form | Amino Acids | |
| Fulvic Acid | ||
| Humic Acid | ||
| Protein Hydrolysates | ||
| Seaweed Extracts | ||
| Other Biostimulants | ||
| By Crop Type | Row Crops | |
| Horticultural Crops | ||
| Cash Crops | ||
| By Geography | North America | United States |
| Canada | ||
| Mexico | ||
| Rest of North America | ||
| South America | Brazil | |
| Argentina | ||
| Rest of South America | ||
| Europe | Germany | |
| France | ||
| Italy | ||
| Spain | ||
| United Kingdom | ||
| Russia | ||
| Netherlands | ||
| Rest of Europe | ||
| Asia-Pacific | China | |
| India | ||
| Japan | ||
| Australia | ||
| Indonesia | ||
| Thailand | ||
| Vietnam | ||
| Philippines | ||
| Rest of Asia-Pacific | ||
| Middle East | Saudi Arabia | |
| Iran | ||
| Turkey | ||
| Rest of Middle East | ||
| Africa | South Africa | |
| Egypt | ||
| Nigeria | ||
| Rest of Africa | ||


Market Definition
- AVERAGE DOSAGE RATE - The average application rate is the average volume of biostimulants applied per hectare of farmland in the respective region/country.
- CROP TYPE - Crop type includes Row crops (Cereals, Pulses, Oilseeds), Horticultural Crops (Fruits and vegetables) and Cash Crops (Plantation Crops, Fibre Crops and Other Industrial Crops)
- FUNCTION - The Crop Protection function of agirucultural biological include products that prevent or control various biotic and abiotic stress.
- TYPE - Biostimulants boost crop growth and yield by preventing or controlling various abiotic stresses.
| Keyword | Definition |
|---|---|
| Cash Crops | Cash crops are non-consumable crops sold as a whole or part of the crop to manufacture end-products to make a profit. |
| Integrated Pest Management (IPM) | IPM is an environment-friendly and sustainable approach to control pests in various crops. It involves a combination of methods, including biological controls, cultural practices, and selective use of pesticides. |
| Bacterial biocontrol agents | Bacteria used to control pests and diseases in crops. They work by producing toxins harmful to the target pests or competing with them for nutrients and space in the growing environment. Some examples of commonly used bacterial biocontrol agents include Bacillus thuringiensis (Bt), Pseudomonas fluorescens, and Streptomyces spp. |
| Plant Protection Product (PPP) | A plant protection product is a formulation applied to crops to protect from pests, such as weeds, diseases, or insects. They contain one or more active substances with other co-formulants such as solvents, carriers, inert material, wetting agents or adjuvants formulated to give optimum product efficacy. |
| Pathogen | A pathogen is an organism causing disease to its host, with the severity of the disease symptoms. |
| Parasitoids | Parasitoids are insects that lay their eggs on or within the host insect, with their larvae feeding on the host insect. In agriculture, parasitoids can be used as a form of biological pest control, as they help to control pest damage to crops and decrease the need for chemical pesticides. |
| Entomopathogenic Nematodes (EPN) | Entomopathogenic nematodes are parasitic roundworms that infect and kill pests by releasing bacteria from their gut. Entomopathogenic nematodes are a form of biocontrol agents used in agriculture. |
| Vesicular-arbuscular mycorrhiza (VAM) | VAM fungi are mycorrhizal species of fungus. They live in the roots of different higher-order plants. They develop a symbiotic relationship with the plants in the roots of these plants. |
| Fungal biocontrol agents | Fungal biocontrol agents are the beneficial fungi that control plant pests and diseases. They are an alternative to chemical pesticides. They infect and kill the pests or compete with pathogenic fungi for nutrients and space. |
| Biofertilizers | Biofertilizers contain beneficial microorganisms that enhance soil fertility and promote plant growth. |
| Biopesticides | Biopesticides are natural/bio-based compounds used to manage agricultural pests using specific biological effects. |
| Predators | Predators in agriculture are the organisms that feed on pests and help control pest damage to the crops. Some common predator species used in agriculture include ladybugs, lacewings, and predatory mites. |
| Biocontrol agents | Biocontrol agents are living organisms used to control pests and diseases in agriculture. They are alternatives to chemical pesticides and are known for their lesser impact on the environment and human health. |
| Organic Fertilizers | Organic fertilizer is composed of animal or vegetable matter used alone or in combination with one or more non-synthetically derived elements or compounds used for soil fertility and plant growth. |
| Protein hydrolysates (PHs) | Protein hydrolysate-based biostimulants contain free amino acids, oligopeptides, and polypeptides produced by enzymatic or chemical hydrolysis of proteins, primarily from vegetal or animal sources. |
| Biostimulants/Plant Growth Regulators (PGR) | Biostimulants/Plant Growth Regulators (PGR) are substances derived from natural resources to enhance plant growth and health by stimulating plant processes (metabolism). |
| Soil Amendments | Soil Amendments are substances applied to soil that improve soil health, such as soil fertility and soil structure. |
| Seaweed Extract | Seaweed extracts are rich in micro and macronutrients, proteins, polysaccharides, polyphenols, phytohormones, and osmolytes. These substances boost seed germination and crop establishment, total plant growth and productivity. |
| Compounds related to biocontrol and/or promoting growth (CRBPG) | Compounds related to biocontrol or promoting growth (CRBPG) are the ability of a bacteria to produce compounds for phytopathogen biocontrol and plant growth promotion. |
| Symbiotic Nitrogen-Fixing Bacteria | Symbiotic nitrogen-fixing bacteria such as Rhizobium obtain food and shelter from the host, and in return, they help by providing fixed nitrogen to the plants. |
| Nitrogen Fixation | Nitrogen fixation is a chemical process in soil which converts molecular nitrogen into ammonia or related nitrogenous compounds. |
| ARS (Agricultural Research Service) | ARS is the U.S. Department of Agriculture's chief scientific in-house research agency. It aims to find solutions to agricultural problems faced by the farmers in the country. |
| Phytosanitary Regulations | Phytosanitary regulations imposed by the respective government bodies check or prohibit the importation and marketing of certain insects, plant species, or products of these plants to prevent the introduction or spread of new plant pests or pathogens. |
| Ectomycorrhizae (ECM) | Ectomycorrhiza (ECM) is a symbiotic interaction of fungi with the feeder roots of higher plants in which both the plant and the fungi benefit through the association for survival. |


Research Methodology
Mordor Intelligence follows a four-step methodology in all our reports.
- Step-1: Identify Key Variables: In order to build a robust forecasting methodology, the variables and factors identified in Step-1 are tested against available historical market numbers. Through an iterative process, the variables required for market forecast are set and the model is built on the basis of these variables.
- Step-2: Build a Market Model: Market-size estimations for the forecast years are in nominal terms. Inflation is not a part of the pricing, and the average selling price (ASP) is kept constant throughout the forecast period.
- Step-3: Validate and Finalize: In this important step, all market numbers, variables and analyst calls are validated through an extensive network of primary research experts from the market studied. The respondents are selected across levels and functions to generate a holistic picture of the market studied.
- Step-4: Research Outputs: Syndicated Reports, Custom Consulting Assignments, Databases & Subscription Platforms.


