Market Overview
| Study Period | 2018 - 2031 |
|---|---|
| Market Size (2026) | USD 7.46 Billion |
| Market Size (2031) | USD 12.65 Billion |
| Growth Rate (2026 - 2031) | 11.15% CAGR |
| Fastest Growing Market | North America |
| Largest Market | North America |
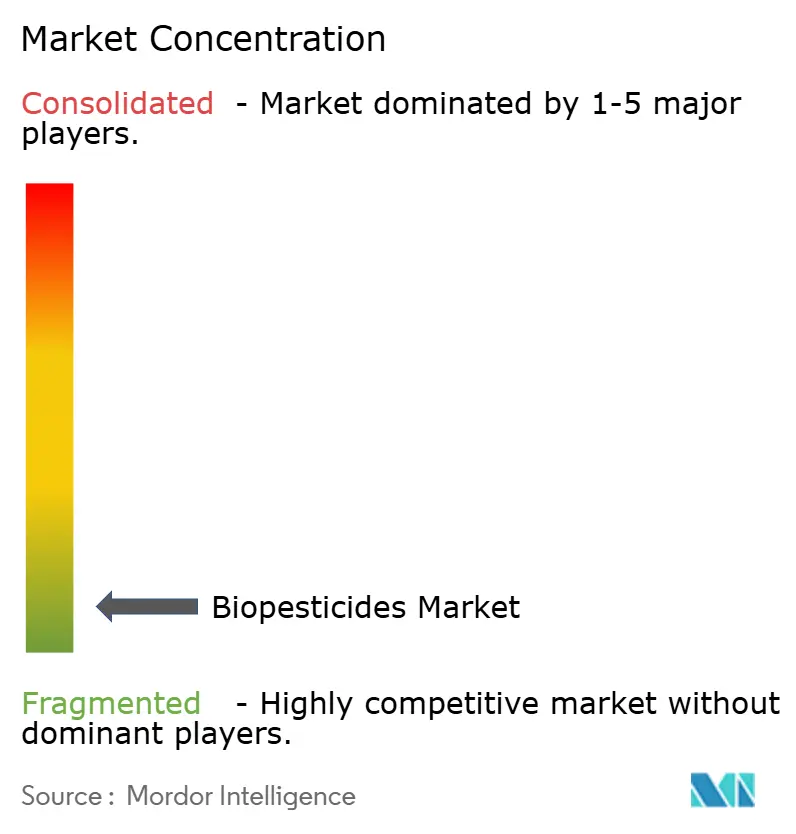
| Market Concentration | Low |
Major Players *Disclaimer: Major Players sorted in no particular order Image © Mordor Intelligence. Reuse requires attribution under CC BY 4.0. | |
Biopesticides Market Analysis by Mordor Intelligence
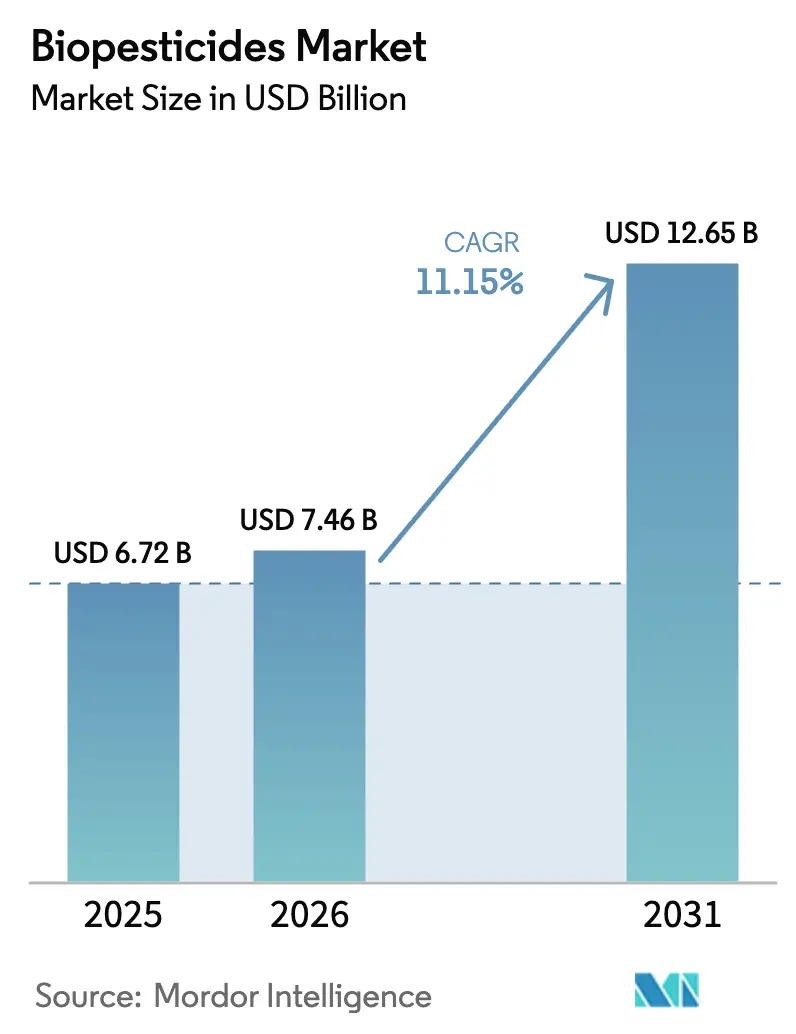
The biopesticides market size is projected to grow from USD 6.72 billion in 2025 to USD 7.46 billion in 2026 and is forecast to reach USD 12.65 billion by 2031 at 11.15% CAGR over 2026-2031. Adoption in the biopesticides market is increasing as regulators impose restrictions on synthetic chemicals, organic farmland continues to grow, and contract fermentation platforms reduce production costs. North America leads in demand, supported by the United States Department of Agriculture's climate-smart funding initiatives and the Environmental Protection Agency's expedited approval processes. Row-crop growers are substituting biofungicides for triazoles that are facing resistance, while European neonicotinoid bans are shifting acreage toward bioinsecticides. Rising venture investment within the biopesticides market in artificial-intelligence-guided microbial discovery is compressing development timelines, and multinational agrochemical companies are acquiring biological portfolios to hedge against synthetic deregistrations. However, feedstock price volatility and shelf-life constraints continue to temper the near-term growth trajectory of the Biopesticides market.
Key Report Takeaways
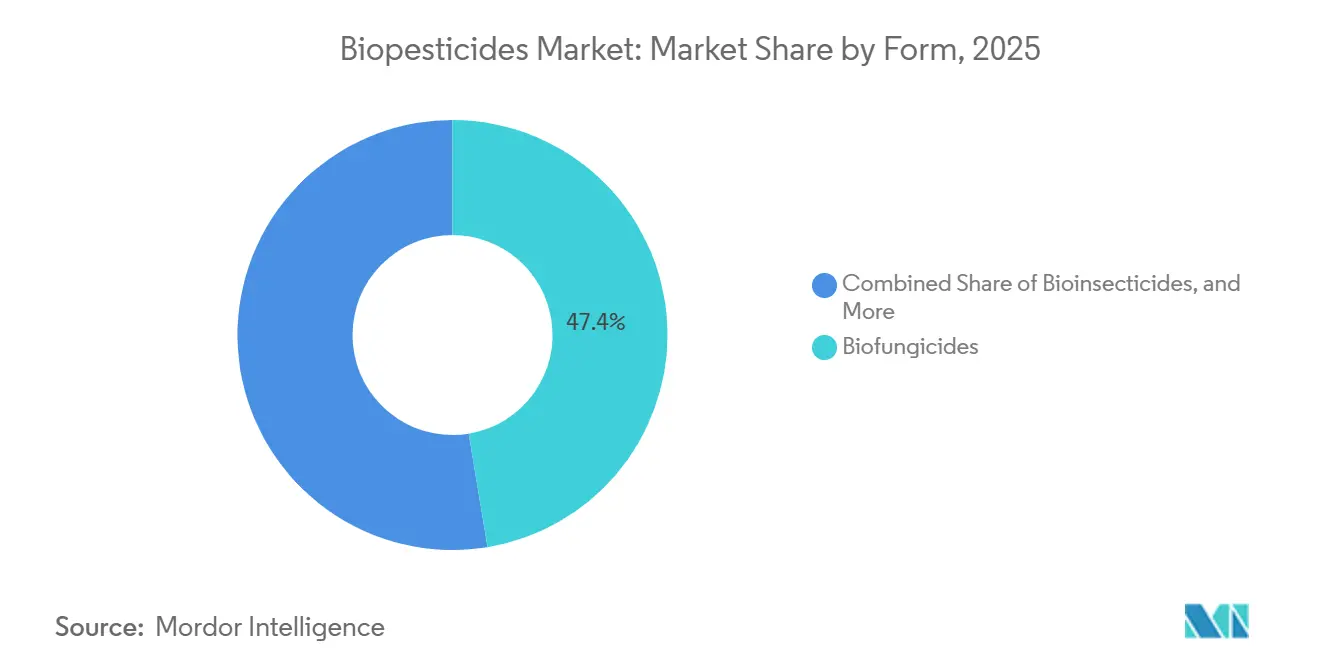
- By form, biofungicides led with 47.4% of the biopesticides market share in 2025, while bioinsecticides are forecast to expand at a 12.3% CAGR through 2031.
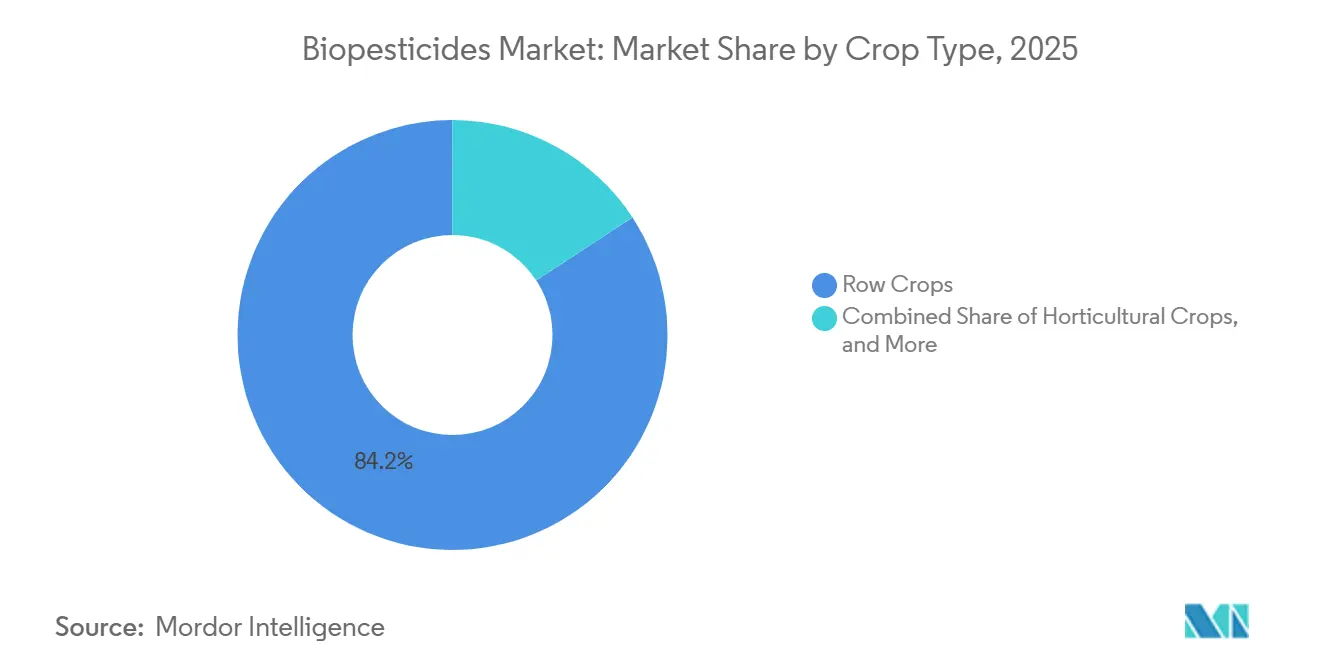
- By crop type, row crops held 84.2% of the biopesticides market size in 2025 and are advancing at an 11.2% CAGR through 2031.
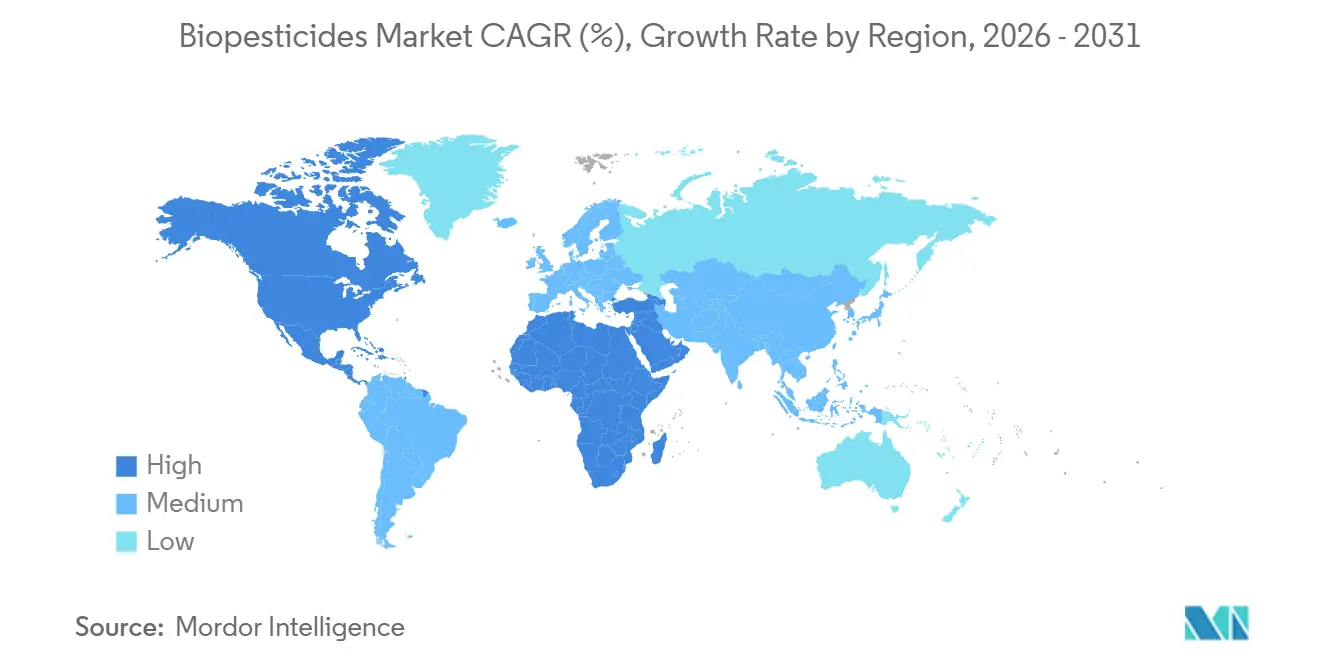
- By geography, North America accounted for 40.0% of revenue in 2025 and is projected to grow at a 12.5% CAGR through 2031.
- Market concentration is low, with the top five companies, Corteva Agriscience, Marrone Bio Innovations, Inc. (Bioceres Crop Solutions Corp.), Gujarat State Fertilizers and Chemicals Ltd. (GSFC), Valent BioSciences LLC (Sumitomo Chemical Company, Limited), and T. Stanes and Company Limited, collectively holding a smaller portion of the market share in 2025.
Note: Market size and forecast figures in this report are generated using Mordor Intelligence’s proprietary estimation framework, updated with the latest available data and insights as of 2026.
Global Biopesticides Market Trends and Insights
Drivers Impact Analysis*
| Driver | (~) % Impact on CAGR Forecast | Geographic Relevance | Impact Timeline |
|---|---|---|---|
| Stricter Global Curbs on Synthetic Pesticides | +2.3% | Europe, and North America | Medium term (2-4 years) |
| Expansion of Organic Farming Acreage | +2.0% | Europe, North America, India, and China | Long term (≥ 4 years) |
| Rising Resistance to Conventional Chemistries | +1.8% | Asia-Pacific cotton and vegetable systems | Short term (≤ 2 years) |
| Government Biopesticide Incentives and Fast-Track Approvals | +1.6% | North America, European Union, China, India, and Brazil | Medium term (2-4 years) |
| Fermentation-as-a-service Platforms Cut Scale-Up Capital Expenditure | +1.4% | North America, Europe, and emerging Asia-Pacific | Medium term (2-4 years) |
| Artificial Intelligence Guided Microbial Discovery Accelerates Product Pipeline | +1.2% | North America, Europe, and select Asia-Pacific hubs | Long term (≥ 4 years) |
| Source: Mordor Intelligence | |||
Stricter Global Curbs on Synthetic Pesticides
Regulators in Europe and North America banned multiple synthetic actives during 2024-2025, forcing growers to seek biological substitutes. Chlorpyrifos and chlorpyrifos-methyl withdrawals removed organophosphate mainstays from key fruit and cereal programs, while France prohibited glyphosate use in public areas[1]Source: European Commission, “Farm to Fork Strategy,” europa.eu. The United States Environmental Protection Agency increased annual biopesticide registrations by 35% in 2025 under an expedited pathway that waives residue tolerances for low-risk microbes[2]Source: United States Environmental Protection Agency, “Biopesticide Registration,” epa.gov. These actions compress the addressable market for synthetics expansion in the biopesticides market, redirect corporate research budgets to biologicals, and catalyze mergers as agrochemical majors scramble to replenish crop-protection pipelines. Cumulatively, policy momentum is tilting procurement toward microbial and botanical solutions across row crops and horticulture, giving the biopesticides market structural foundation.
Expansion of Organic Farming Acreage
Global organic farmland increased to 96.4 million hectares in 2024, reflecting a 12% growth since 2022[3]Source: Research Institute of Organic Agriculture, “World of Organic Agriculture 2024,” fibl.org. This growth highlights the rising global emphasis on sustainable agricultural practices. India allocated INR 4,400 crore (USD 530 million) to convert 1 million hectares to natural farming by 2026, incorporating biopesticide usage into agricultural extension programs to promote eco-friendly farming methods. Brazil’s ABC Plus low-interest credit line provided USD 1 billion to coffee and sugarcane producers adopting sustainable inputs, supporting the transition to environmentally responsible production. In Australia, the growth of organic grain production has increased the demand for biofungicides that prevent residues, which could compromise organic certification and compliance with organic standards. Organic standards strictly prohibit synthetic pesticides, creating a dedicated demand base that shields the biopesticides market from commodity price fluctuations and supports consistent growth in offtake, further reinforcing the market's stability and predictability.
Rising Resistance to Conventional Chemistries
Pyrethroid resistance in diamondback moths has increased across Southeast Asia, leading to the widespread adoption of Bacillus thuringiensis sprays in vegetable cultivation [4]Source: Food and Agriculture Organization, “Pesticide Resistance and Biopesticides,” fao.org. This shift underscores the growing challenge of managing resistance in key agricultural pests, as traditional chemical controls lose their effectiveness. In North America, Fusarium head blight strains in wheat are exhibiting reduced sensitivity to triazoles, resulting in a 40% decline in control efficacy in 2025 compared to 2020 levels. This decline has significant implications for wheat production, as Fusarium head blight remains a major threat to crop yields and quality. Biological actives, with their unique toxins and metabolites, circumvent established resistance mechanisms, making them essential components in integrated resistance-management strategies. These solutions not only address resistance challenges but also offer sustainable options for long-term pest and disease control. Farmers, increasingly concerned about yield losses, now view biopesticides as effective risk-mitigation tools rather than niche organic products, thereby expanding the addressable acreage for the biopesticides market.
Artificial Intelligence Guided Microbial Discovery Accelerates Product Pipeline
Machine-learning algorithms analyze thousands of isolates, predict pesticidal metabolite clusters, and prioritize candidates for greenhouse screening. These algorithms significantly enhance the efficiency of identifying potential biopesticides by streamlining the selection process. Ginkgo Bioworks identified three insecticidal strains in less than 4 years, a timeline previously required to confirm a single trait. This achievement highlights the potential of advanced computational tools in accelerating discovery timelines. In 2023, Corteva Agriscience has allocated USD 150 million to automate fermentation and metabolite profiling at its Iowa facility. This investment underscores the growing emphasis on automation to enhance research and development capabilities. Shortened discovery cycles enable more frequent product launches across the biopesticides market, supporting double-digit growth in the biopesticides market while ensuring portfolios remain aligned with evolving resistance patterns.
Restraints Impact Analysis*
| Restraint | (~) % Impact on CAGR Forecast | Geographic Relevance | Impact Timeline |
|---|---|---|---|
| Higher Cost Versus Synthetic Pesticides | −1.8% | Global, and price-sensitive smallholder markets | Short term (≤ 2 years) |
| Shorter Shelf Life and Cold-Chain Dependence | −1.3% | South America, Africa, and Southeast Asia | Medium term (2-4 years) |
| Feedstock Price Volatility for Microbial Production | −1.1% | North America and Europe | Short term (≤ 2 years) |
| Lack of Uniform Field Performance Key Performance Indicators | −0.9% | Global, and especially emerging markets | Long term (≥ 4 years) |
| Source: Mordor Intelligence | |||
Higher Cost Versus Synthetic Pesticides
The cost of Bacillus thuringiensis programs averages USD 18–25 per hectare, which is up to 50% higher than pyrethroid regimens. This upfront cost poses a significant challenge for many smallholders, as they often lack the financial capacity to absorb such premiums. Manufacturing expenses within the biopesticides market are elevated due to batch variability and stringent quality control requirements, which ensure product consistency and efficacy. Additionally, a shorter shelf life requires producers to maintain higher working capital to maintain inventory levels. In North America, Integrated Pest Management (IPM) savings help offset these premiums for corporate users by reducing overall pest control costs. However, in regions like Africa and South Asia, subsidy gaps hinder adoption, as smallholders in these areas are more price-sensitive and lack access to financial support.
Lack of Uniform Field Performance Key Performance Indicators
A 2024 United States Department of Agriculture survey revealed that 38% of corn and soybean growers identified unpredictable biopesticide performance as the primary barrier to adoption[5]Source: United States Department of Agriculture Agricultural Research Service, “Biopesticide Adoption Survey,” ars.usda.gov. The lack of detailed guidance on spray timing and adjuvant compatibility on product labels contributes to inconsistent results across varying soil types and climates. Furthermore, growers face challenges in determining optimal conditions for biopesticide application, thereby increasing variability in outcomes. Additionally, the absence of standardized efficacy protocols from regulatory bodies allows manufacturers to selectively present data, undermining agronomic trust. This lack of uniformity in performance metrics makes it difficult for growers to effectively compare products. Until industry-wide benchmarks are established, large-acreage operators are likely to remain cautious in adopting biologicals, limiting the penetration of the biopesticides market.
*Our forecasts treat driver/restraint impacts as directional, not additive. The impact forecasts reflect baseline growth, mix effects, and variable interactions.
Segment Analysis
By Form: Biofungicides Dominate, Bioinsecticides Accelerate
Biofungicides captured 47.4% of the biopesticides market in 2025, led by Trichoderma harzianum and Bacillus subtilis solutions that outperformed triazoles against Fusarium head blight and Rhizoctonia root rot in corn and soybean systems. The biopesticides market for biofungicides is projected to expand steadily as row-crop acres integrate microbial seed treatments, supported by crop-protection majors bundling biologicals with fungicide tank-mix partners. Price premiums persist in the biopesticides market, but yield preservation justifies expenditure for large enterprises pursuing export-grade quality.
Bioinsecticides are the fastest-growing category, with a 12.3% compound annual growth rate through 2031, propelled by European neonicotinoid bans and pyrethroid resistance in Asia-Pacific. Bacillus thuringiensis var. kurstaki remains ubiquitous, yet research alliances are commercializing RNA-interference formulations that deliver species-specific control without non-target toxicity. As registrations proliferate, distributors expect the bioinsecticide share of the biopesticides market to widen, particularly in cotton and high-value vegetables, where residue-free traits command premiums.


By Crop Type: Row Crops Anchor Growth and Emerges Fastest
Row crops accounted for 84.2% of the biopesticides market in 2025 demand and are projected to grow at a 11.2% CAGR through 2026-2031. United States corn acreage exceeded 90 million in 2025, with a significant portion of the crop treated biologically for corn rootworm and European corn borer suppression. Brazilian and Argentine soybean rust pressure drove the adoption of Trichoderma-based seed treatments, cementing row crops as the revenue backbone of the Biopesticides market. Governments subsidize biological inputs, reinforcing growth in the biopesticides market adoption momentum and widening grower familiarity with microbial solutions.
Horticultural crops, although smaller in area, have the highest per-hectare application intensity and rank among the fastest-growing crops for biologicals. Tomato and strawberry producers in California and Spain integrate multiple sprays per season to comply with stringent maximum residue limits. Municipal bans on public-space herbicides in France amplified demand for Pseudomonas-based weed controls in parks and sidewalks. As consumer demand for organic fruits and vegetables accelerates, horticulture’s contribution to the biopesticides market size is projected to edge upward, bolstered by premium pricing that offsets higher input costs.
Geography Analysis
North America commanded 40.0% of the biopesticides market share in 2025, aided by the United States Department of Agriculture's climate-smart initiative and the Environmental Protection Agency's fast-track registration pathway that slashed microbial approval times to 18 months. Canada’s Pest Management Regulatory Agency cleared four new biopesticide actives in 2025, including Metarhizium anisopliae for prairie grasshoppers. Mexico’s organic avocado and berry exporters increased biofungicide usage to satisfy United States certification requirements, highlighting cross-border regulatory alignment. Advanced cold-chain logistics, precision agriculture adoption, and federal subsidies equip the region to sustain growth in the biopesticides market through 2031.
Europe's Farm to Fork Strategy mandates a 50% reduction in synthetic pesticide use. In France, the glyphosate ban in public areas in 2023 has driven increased municipal adoption of Pseudomonas fluorescens bioherbicides. Similarly, Germany approved six new microbial seed treatments for wheat and barley, set to be available in 2025. In Spain, organic olive farming has incorporated Bacillus thuringiensis for moth control, promoting the use of biological solutions in perennial crops. Meanwhile, the United Kingdom implemented a risk-based approval model post-Brexit in 2023, prioritizing low-toxicity active ingredients and reducing registration lead times by 30%. These regulatory developments support consistent growth in the biopesticides market across Europe, despite challenges posed by fluctuations in feedstock prices.
Asia-Pacific's biopesticides sales are driven by China's mandate to reduce chemical pesticide use by 2025 and India's subsidies under the National Mission on Natural Farming. Japan has expedited the approval of four microbial actives, including RNA interference solutions targeting the rice stem borer, highlighting potential synergies with precision agriculture. In Southeast Asia, growers face challenges due to infrastructure gaps, with spoilage rates exceeding in areas lacking robust cold-chain systems, limiting short-term market penetration. However, the expansion of cotton, rice, and vegetable cultivation under pressure from resistance, coupled with rising disposable incomes for residue-free produce, positions the Asia-Pacific region as a key growth area for the biopesticides market.

Competitive Landscape
Global revenue concentration remained low with the top five companies, Corteva Agriscience, Marrone Bio Innovations, Inc. (Bioceres Crop Solutions Corp.), Gujarat State Fertilizers and Chemicals Ltd. (GSFC), Valent BioSciences LLC (Sumitomo Chemical Company, Limited), and T. Stanes and Company Limited, collectively holding a smaller portion of the market share in 2025. Corteva Agriscience’s January 2023 buyout of Stoller Group integrated biostimulants and microbial pesticides into a unified biologicals platform aligned with its seed and chemistry franchises.
Innovation niches remain open across the biopesticides industry. From 2024-2025, Koppert Biological Systems invested USD 54 million in a Dutch fermentation site to scale beneficial nematodes and microbial fungicides for greenhouse horticulture. Andermatt Group tailored Metarhizium formulations for alpine grasslands, demonstrating the potential for regional specialization. Contract capacity from Ginkgo Bioworks levels the playing field by allowing start-ups to scale without plant investments, intensifying price competition across the biopesticides market.
Strategic alliances focus on enhancing local manufacturing efficiency and accelerating regulatory approvals. Certis Biologicals utilized Mitsui's distribution network in Southeast Asia to address increased demand for rice and horticulture products driven by pyrethroid resistance. These alliances also aim to strengthen supply chain resilience and foster knowledge sharing between partners, enabling better adaptation to market dynamics. As product portfolios expand and regulatory frameworks become more standardized across the biopesticides industry, brand differentiation will depend on factors such as strain exclusivity, formulation stability, and digital agronomy services that improve application timing, collectively influencing competition within the biopesticides market.
Biopesticides Industry Leaders
Corteva Agriscience
Marrone Bio Innovations, Inc. (Bioceres Crop Solutions Corp.)
Gujarat State Fertilizers and Chemicals Ltd. (GSFC)
Valent BioSciences LLC (Sumitomo Chemical Company, Limited)
T. Stanes and Company Limited
- *Disclaimer: Major Players sorted in no particular order

Recent Industry Developments
- December 2025: Kureha Corporation has obtained advanced biopesticide and microbial interaction technology from a United States-based organization to create sustainable, high-value solutions for agricultural disease control. This technology addresses challenging pathogens, such as Fusarium and nematodes, by leveraging microorganisms to provide environmentally friendly alternatives to traditional pesticides.
- November 2025: Syngenta and the French biotechnology company Amoéba SA have entered into a Memorandum of Understanding (MoU) to jointly develop and commercialize amoeba-based biocontrol solutions for cereals in Europe and the United Kingdom. This collaboration centers on a biofungicide derived from the lysate of the amoeba Willaertia magna C2c Maky, which activates natural plant defense mechanisms.
- September 2025: BioWorks has entered the European market, offering a portfolio of biopesticides and biostimulants focused on sustainable crop protection. This initiative aims to provide European growers with biological solutions for disease and pest management.
- July 2025: UPL Corp Australia introduced Thiopron, a biofungicide for grapevines, at WineTech 2025. The product is designed to address fungal diseases such as powdery mildew and serves as a sustainable alternative to traditional fungicides, aligning with global and European trends in biological crop protection.


Global Biopesticides Market Report Scope
Biopesticides are pest management agents derived from natural sources, including microorganisms such as bacteria, fungi, and viruses. Unlike synthetic chemicals, they are typically biodegradable, target-specific, and pose minimal risks to non-target organisms and humans. These characteristics make biopesticides integral to sustainable agriculture and integrated pest management (IPM) practices. The Biopesticides Market Report is Segmented by Form (Biofungicides, Bioherbicides, Bioinsecticides, and More), by Crop Type (Cash Crops, Horticultural Crops, and Row Crops), and by Geography (North America, Europe, Asia-Pacific, South America, the Middle East, and Africa). The Market Forecasts are Provided in Terms of Value (USD) and Volume (Metric Tons).
By Form
| Biofungicides |
| Bioherbicides |
| Bioinsecticides |
| Other Biopesticides |
By Crop Type
| Cash Crops |
| Horticultural Crops |
| Row Crops |
By Geography
| North America | Canada |
| Mexico | |
| United States | |
| Rest of North America | |
| Europe | France |
| Germany | |
| Italy | |
| Netherlands | |
| Russia | |
| Spain | |
| United Kingdom | |
| Rest of Europe | |
| Asia-Pacific | Australia |
| China | |
| India | |
| Indonesia | |
| Japan | |
| Philippines | |
| Thailand | |
| Vietnam | |
| Rest of Asia-Pacific | |
| South America | Argentina |
| Brazil | |
| Rest of South America | |
| Middle East | Iran |
| Turkey | |
| Saudi Arabia | |
| Rest of Middle East | |
| Africa | Egypt |
| Nigeria | |
| South Africa | |
| Rest of Africa |
| By Form | Biofungicides | |
| Bioherbicides | ||
| Bioinsecticides | ||
| Other Biopesticides | ||
| By Crop Type | Cash Crops | |
| Horticultural Crops | ||
| Row Crops | ||
| By Geography | North America | Canada |
| Mexico | ||
| United States | ||
| Rest of North America | ||
| Europe | France | |
| Germany | ||
| Italy | ||
| Netherlands | ||
| Russia | ||
| Spain | ||
| United Kingdom | ||
| Rest of Europe | ||
| Asia-Pacific | Australia | |
| China | ||
| India | ||
| Indonesia | ||
| Japan | ||
| Philippines | ||
| Thailand | ||
| Vietnam | ||
| Rest of Asia-Pacific | ||
| South America | Argentina | |
| Brazil | ||
| Rest of South America | ||
| Middle East | Iran | |
| Turkey | ||
| Saudi Arabia | ||
| Rest of Middle East | ||
| Africa | Egypt | |
| Nigeria | ||
| South Africa | ||
| Rest of Africa | ||


Market Definition
- AVERAGE DOSAGE RATE - The average application rate is the average volume of biopesticides applied per hectare of farmland in the respective region/country.
- CROP TYPE - Crop type includes Row crops (Cereals, Pulses, Oilseeds), Horticultural Crops (Fruits and vegetables) and Cash Crops (Plantation Crops, Fibre Crops and Other Industrial Crops)
- FUNCTION - The Crop Protection function of agirucultural biological include products that prevent or control various biotic and abiotic stress.
- TYPE - Biopesticides prevent or control various pests, including insects, diseases, and weeds, from causing crop damage and yield loss.
| Keyword | Definition |
|---|---|
| Cash Crops | Cash crops are non-consumable crops sold as a whole or part of the crop to manufacture end-products to make a profit. |
| Integrated Pest Management (IPM) | IPM is an environment-friendly and sustainable approach to control pests in various crops. It involves a combination of methods, including biological controls, cultural practices, and selective use of pesticides. |
| Bacterial biocontrol agents | Bacteria used to control pests and diseases in crops. They work by producing toxins harmful to the target pests or competing with them for nutrients and space in the growing environment. Some examples of commonly used bacterial biocontrol agents include Bacillus thuringiensis (Bt), Pseudomonas fluorescens, and Streptomyces spp. |
| Plant Protection Product (PPP) | A plant protection product is a formulation applied to crops to protect from pests, such as weeds, diseases, or insects. They contain one or more active substances with other co-formulants such as solvents, carriers, inert material, wetting agents or adjuvants formulated to give optimum product efficacy. |
| Pathogen | A pathogen is an organism causing disease to its host, with the severity of the disease symptoms. |
| Parasitoids | Parasitoids are insects that lay their eggs on or within the host insect, with their larvae feeding on the host insect. In agriculture, parasitoids can be used as a form of biological pest control, as they help to control pest damage to crops and decrease the need for chemical pesticides. |
| Entomopathogenic Nematodes (EPN) | Entomopathogenic nematodes are parasitic roundworms that infect and kill pests by releasing bacteria from their gut. Entomopathogenic nematodes are a form of biocontrol agents used in agriculture. |
| Vesicular-arbuscular mycorrhiza (VAM) | VAM fungi are mycorrhizal species of fungus. They live in the roots of different higher-order plants. They develop a symbiotic relationship with the plants in the roots of these plants. |
| Fungal biocontrol agents | Fungal biocontrol agents are the beneficial fungi that control plant pests and diseases. They are an alternative to chemical pesticides. They infect and kill the pests or compete with pathogenic fungi for nutrients and space. |
| Biofertilizers | Biofertilizers contain beneficial microorganisms that enhance soil fertility and promote plant growth. |
| Biopesticides | Biopesticides are natural/bio-based compounds used to manage agricultural pests using specific biological effects. |
| Predators | Predators in agriculture are the organisms that feed on pests and help control pest damage to the crops. Some common predator species used in agriculture include ladybugs, lacewings, and predatory mites. |
| Biocontrol agents | Biocontrol agents are living organisms used to control pests and diseases in agriculture. They are alternatives to chemical pesticides and are known for their lesser impact on the environment and human health. |
| Organic Fertilizers | Organic fertilizer is composed of animal or vegetable matter used alone or in combination with one or more non-synthetically derived elements or compounds used for soil fertility and plant growth. |
| Protein hydrolysates (PHs) | Protein hydrolysate-based biostimulants contain free amino acids, oligopeptides, and polypeptides produced by enzymatic or chemical hydrolysis of proteins, primarily from vegetal or animal sources. |
| Biostimulants/Plant Growth Regulators (PGR) | Biostimulants/Plant Growth Regulators (PGR) are substances derived from natural resources to enhance plant growth and health by stimulating plant processes (metabolism). |
| Soil Amendments | Soil Amendments are substances applied to soil that improve soil health, such as soil fertility and soil structure. |
| Seaweed Extract | Seaweed extracts are rich in micro and macronutrients, proteins, polysaccharides, polyphenols, phytohormones, and osmolytes. These substances boost seed germination and crop establishment, total plant growth and productivity. |
| Compounds related to biocontrol and/or promoting growth (CRBPG) | Compounds related to biocontrol or promoting growth (CRBPG) are the ability of a bacteria to produce compounds for phytopathogen biocontrol and plant growth promotion. |
| Symbiotic Nitrogen-Fixing Bacteria | Symbiotic nitrogen-fixing bacteria such as Rhizobium obtain food and shelter from the host, and in return, they help by providing fixed nitrogen to the plants. |
| Nitrogen Fixation | Nitrogen fixation is a chemical process in soil which converts molecular nitrogen into ammonia or related nitrogenous compounds. |
| ARS (Agricultural Research Service) | ARS is the U.S. Department of Agriculture's chief scientific in-house research agency. It aims to find solutions to agricultural problems faced by the farmers in the country. |
| Phytosanitary Regulations | Phytosanitary regulations imposed by the respective government bodies check or prohibit the importation and marketing of certain insects, plant species, or products of these plants to prevent the introduction or spread of new plant pests or pathogens. |
| Ectomycorrhizae (ECM) | Ectomycorrhiza (ECM) is a symbiotic interaction of fungi with the feeder roots of higher plants in which both the plant and the fungi benefit through the association for survival. |


Research Methodology
Mordor Intelligence follows a four-step methodology in all our reports.
- Step-1: Identify Key Variables: In order to build a robust forecasting methodology, the variables and factors identified in Step-1 are tested against available historical market numbers. Through an iterative process, the variables required for market forecast are set and the model is built on the basis of these variables.
- Step-2: Build a Market Model: Market-size estimations for the forecast years are in nominal terms. Inflation is not a part of the pricing, and the average selling price (ASP) is kept constant throughout the forecast period.
- Step-3: Validate and Finalize: In this important step, all market numbers, variables and analyst calls are validated through an extensive network of primary research experts from the market studied. The respondents are selected across levels and functions to generate a holistic picture of the market studied.
- Step-4: Research Outputs: Syndicated Reports, Custom Consulting Assignments, Databases & Subscription Platforms.


