Bike And Scooter Rental Market Size and Share
Market Overview
| Study Period | 2019 - 2030 |
|---|---|
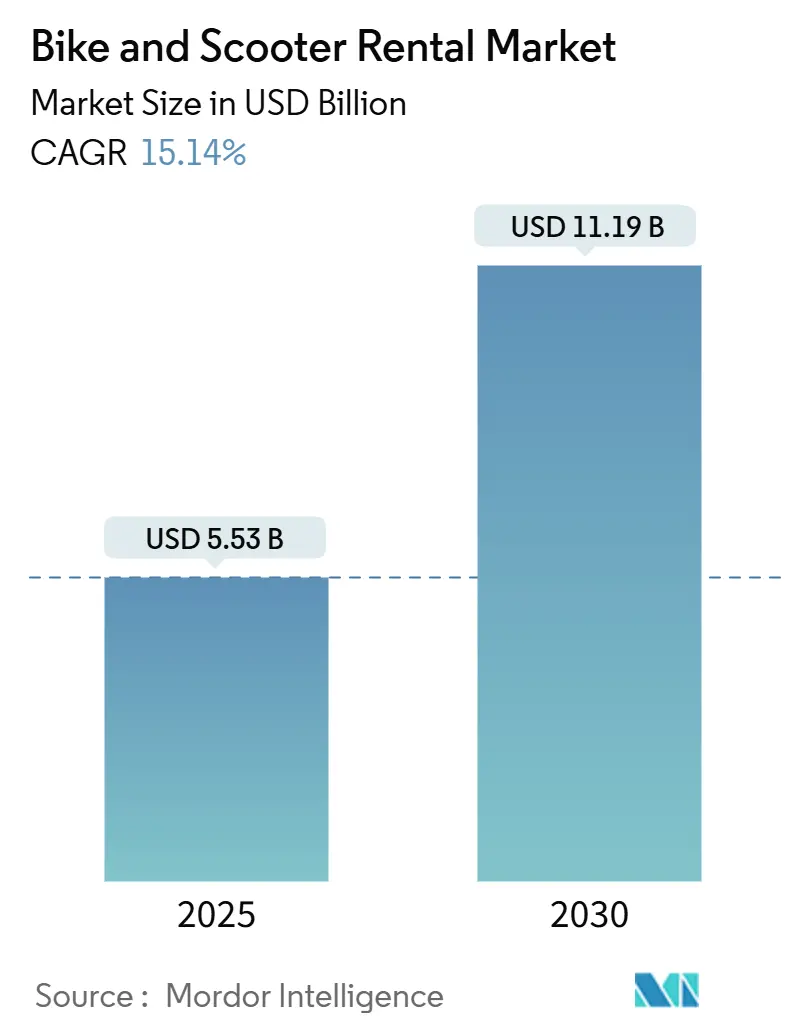
| Market Size (2025) | USD 5.53 Billion |
| Market Size (2030) | USD 11.19 Billion |
| Growth Rate (2025 - 2030) | 15.14% CAGR |
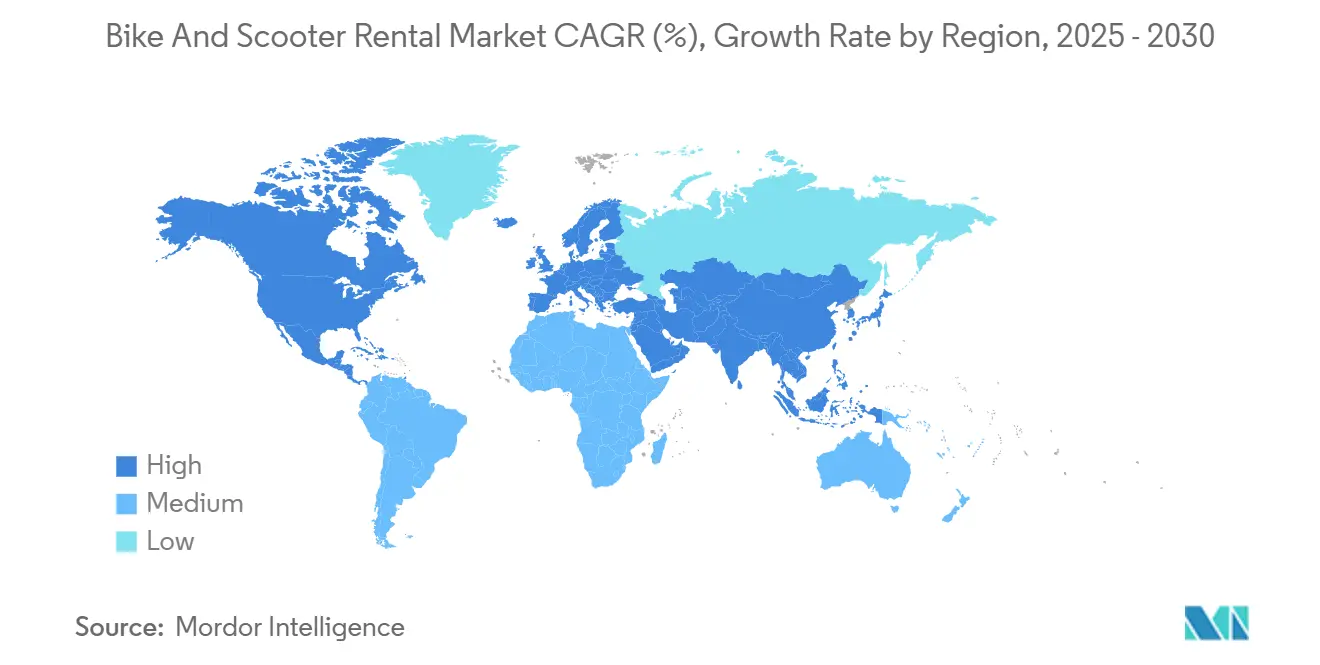
| Fastest Growing Market | Asia Pacific |
| Largest Market | Asia Pacific |
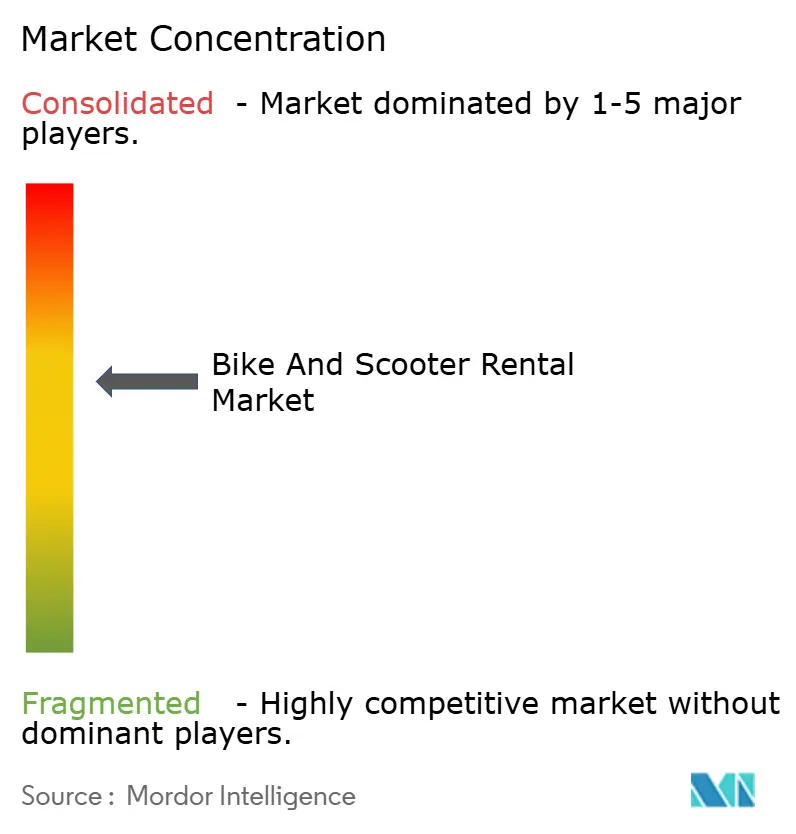
| Market Concentration | Medium |
Major Players
*Disclaimer: Major Players sorted in no particular order Image © Mordor Intelligence. Reuse requires attribution under CC BY 4.0. |
|
Bike And Scooter Rental Market Analysis by Mordor Intelligence
The bike and scooter rental market size is valued at USD 5.53 billion in 2025 and is set to reach USD 11.19 billion by 2030, advancing at a 15.14% CAGR during the forecast period. Momentum comes from converging forces: urban congestion mitigation, government infrastructure spending, AI-enabled fleet optimization, and corporate mobility programs that create stable, high-frequency demand. Scooters dominate fleets because of lower unit costs, but e-bikes are gaining share thanks to the longer range and cargo capacity favored by delivery workers. Operators are rapidly moving to subscription and long-term rental models to secure predictable cash flows, while investors reward those showing structural profitability. Persistent challenges permit caps, vandalism costs, and battery supply shifts to temper absolute growth yet reinforce consolidation, rewarding companies with scale and data-driven operations.
Key Report Takeaways
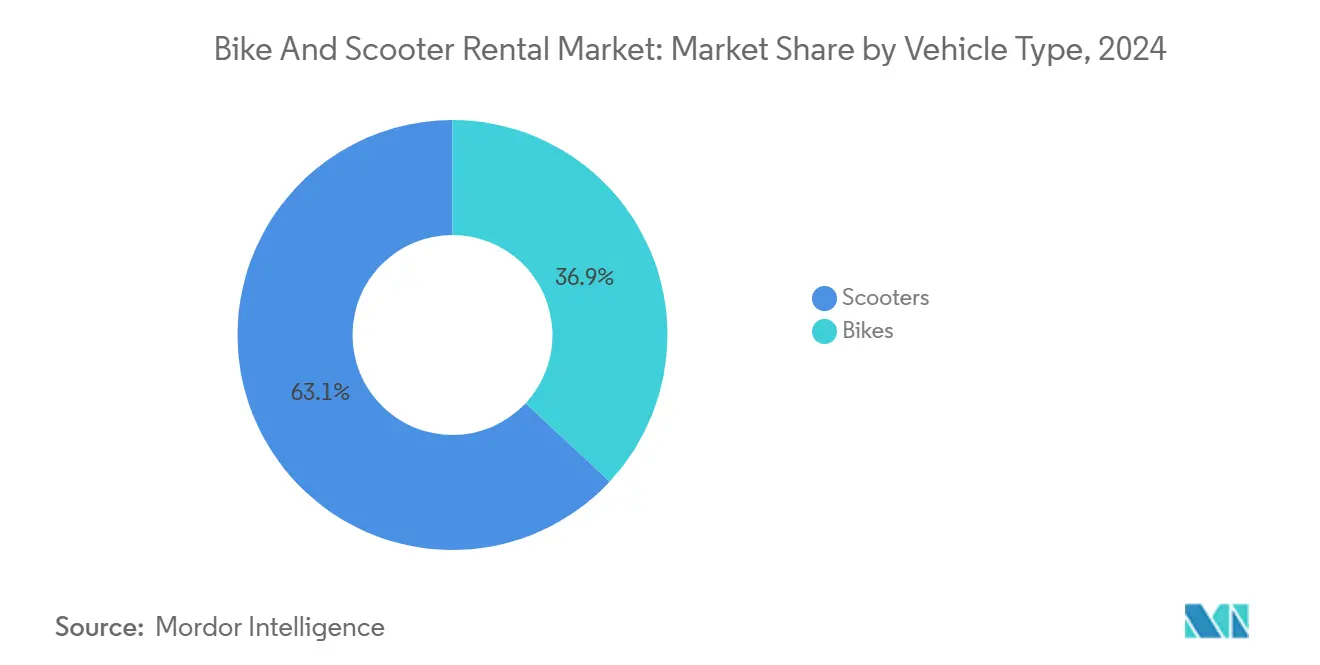
- By vehicle type, scooters held 63.07% of the bike and scooter rental market share in 2024, and are projected to post the fastest 19.82% CAGR through 2030.
- By service type, pay-as-you-go commanded 71.12% of the bike and scooter rental market in 2024; subscription models are forecast to expand at 22.38% CAGR to 2030.
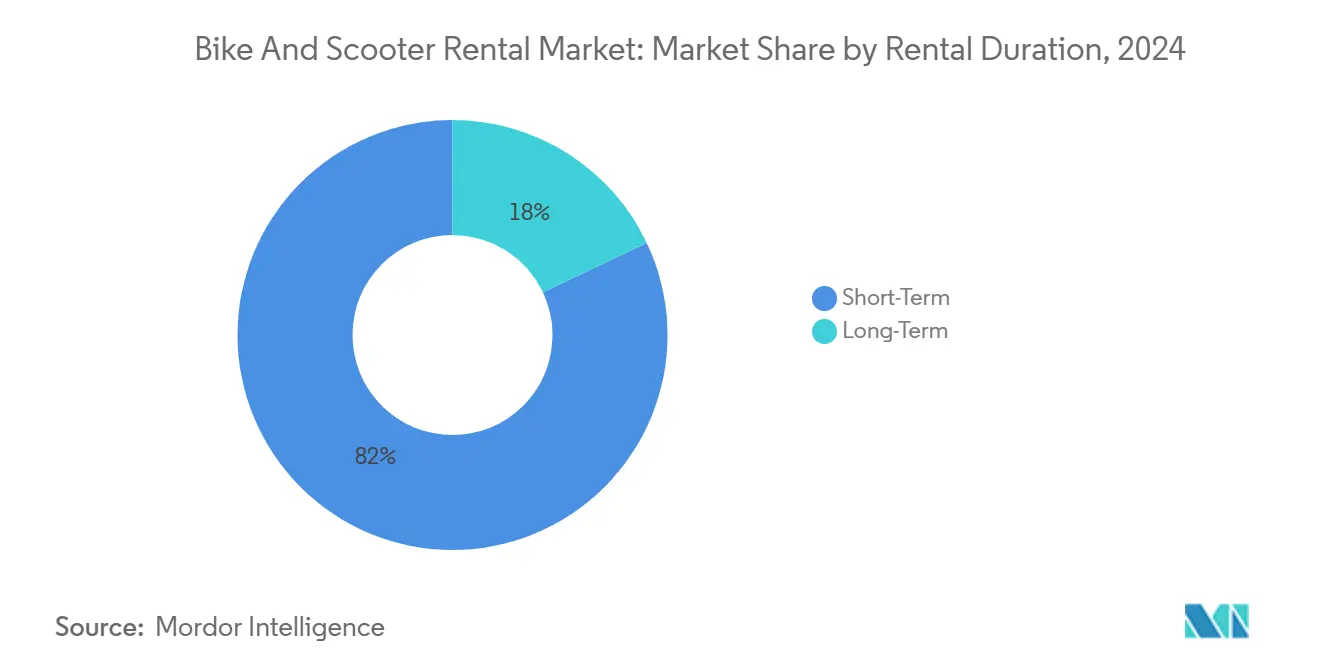
- By rental duration, short-term options accounted for 82.04% share of the bike and scooter rental market size in 2024, while long-term rentals should progress at an 18.27% CAGR through 2030.
- By end user, daily commuters led with 45.96% share of the bike and scooter rental market in 2024; delivery personnel represent the fastest-growing user pool at a 23.62% CAGR through 2030.
- By geography, Asia-Pacific captured 37.98% of the bike and scooter rental market in 2024 and is expected to grow at an 18.91% CAGR to 2030.
Global Bike And Scooter Rental Market Trends and Insights
Drivers Impact Analysis*
| Driver | (~) % Impact on CAGR Forecast | Geographic Relevance | Impact Timeline |
|---|---|---|---|
| Rapid Urban Congestion Mitigation Needs | +3.2% | Global, concentrated in Asia-Pacific megacities | Medium term (2-4 years) |
| Government Micro-Mobility Incentives and Bike-Lane Build-Out | +2.8% | North America and Europe, expanding to Asia-Pacific | Long term (≥ 4 years) |
| Sustainability-Driven Consumer Preference Shift | +2.1% | Global, led by Europe and North America | Long term (≥ 4 years) |
| AI-Powered Demand Prediction Improving Fleet ROI | +1.9% | Global, early adoption in developed markets | Short term (≤ 2 years) |
| Public-Transit App Integration Expanding Addressable Ridership | +1.6% | Europe and North America, pilot programs in Asia-Pacific | Medium term (2-4 years) |
| Corporate Mobility Stipends For Employees | +1.4% | North America and Europe, emerging in Asia-Pacific urban centers | Medium term (2-4 years) |
| Source: Mordor Intelligence | |||
Rapid Urban Congestion Mitigation Needs
Traffic congestion costs global economies billions annually, with Asian megacities experiencing the most severe impacts as vehicle ownership outpaces infrastructure development. Shared micromobility offers cities a scalable solution that requires minimal infrastructure investment compared to subway expansion or road widening projects. Integrating micromobility with existing transit networks creates a multiplier effect, where each shared vehicle can replace up to 9 private car trips daily during peak hours. This congestion relief becomes particularly valuable as cities implement low-emission zones and congestion pricing schemes that make car ownership increasingly expensive. The trend accelerates as urban planners recognize that dedicating road space to bike lanes generates higher passenger throughput per square meter than traditional vehicle lanes.
Government Micro-Mobility Incentives and Bike-Lane Build-Out
Government infrastructure investments reached unprecedented levels in 2024, with California allocating USD 930 million[1]Edward Barrera, "California Investing Nearly $1 Billion in Bicycle and Pedestrian Infrastructure Over Next Four Years," Caltrans, dot.ca.gov for bike and pedestrian infrastructure while British Columbia committed CAD 24 million (USD 18 million) to active transport grants. The U.S. Department of Transportation's ATIIP program distributed USD 44.5 million specifically for micromobility infrastructure, signaling federal recognition of shared mobility's role in transportation decarbonization[2]"INVESTING IN AMERICA: Biden-Harris Administration Announces Nearly $45 Million in Grant Awards for Connected, Active Transportation Infrastructure Projects," Federal Highway Administration, highways.dot.gov. Finland's introduction of comprehensive micromobility licensing legislation 2024 demonstrates how regulatory frameworks evolve from restrictive to facilitative, creating standardized operating environments that reduce operator compliance costs. These investments generate network effects where bike lane density correlates directly with ridership adoption rates. Cities with over 200 kilometers of protected bike infrastructure typically see 3x higher per-capita micromobility usage than those with fragmented networks. The regulatory influence extends beyond infrastructure, as ISO 4210 bicycle safety standards and emerging e-scooter certification requirements create barriers to entry that favor established operators with compliance capabilities.
Sustainability-Driven Consumer Preference Shift
Corporate sustainability mandates increasingly include employee commuting emissions in Scope 3 carbon accounting, driving demand for micromobility as a measurable decarbonization tool. Lime's commitment to 100% renewable energy for the United Kingdom operations reflects broader industry recognition that operational sustainability creates competitive differentiation[3]"Powering Lime UK with 100% green energy," octopus.energy. Consumer preference data indicates that most urban millennials consider environmental impact when choosing transportation options, with shared micromobility offering the lowest per-mile carbon footprint among motorized alternatives. The sustainability narrative gains credibility as operators extend vehicle lifecycles through refurbishment programs, with Voi reporting extended asset lifespans that improve both environmental and financial metrics. This trend intersects with corporate mobility programs, where companies like those partnering with HumanForest and Donkey Republic offer employee bike subscriptions as both wellness and sustainability benefits. The circular economy approach becomes particularly relevant as battery recycling infrastructure matures, addressing end-of-life concerns that previously limited sustainability claims.
AI-Powered Demand Prediction Improving Fleet ROI
Predictive analytics has transformed micromobility economics by optimizing vehicle distribution and reducing operational inefficiencies that previously made the business model unsustainable. Advanced fleet management systems now incorporate weather data, event schedules, and historical usage patterns to position vehicles where demand will emerge, reducing the costly manual rebalancing that plagued early operators. IoT integration enables predictive maintenance that prevents expensive breakdowns and extends asset lifecycles, while CAN bus technology provides real-time vehicle health monitoring that optimizes repair scheduling. The technology stack creates competitive moats, as operators with superior algorithms can achieve higher utilization rates and lower operational costs than competitors relying on reactive management.
Restraints Impact Analysis*
| Restraint | (~) % Impact on CAGR Forecast | Geographic Relevance | Impact Timeline |
|---|---|---|---|
| Tight City Caps and Permit Limitations | -2.4% | Europe and North America, selective Asia-Pacific markets | Medium term (2-4 years) |
| High Vandalism, Theft and Maintenance Costs | -1.8% | Global, acute in high-density urban areas | Short term (≤ 2 years) |
| Battery-Cell Supply Volatility | -1.3% | Global, concentrated impact on e-scooter operators | Medium term (2-4 years) |
| Rising Accident-Related Liability Litigation | -1.1% | North America and Europe, emerging in Asia-Pacific | Long term (≥ 4 years) |
| Source: Mordor Intelligence | |||
Tight City Caps and Permit Limitations
Municipal permit restrictions have emerged as the primary constraint on market expansion, with cities implementing fleet caps that limit operator growth potential and create artificial scarcity. Paris's decision to ban free-floating e-scooters in 2024 exemplifies how regulatory backlash can eliminate entire market segments overnight. Madrid's selective licensing of only three operators (Dott, Lime, TIER) demonstrates how permit systems favor established players over new entrants. The regulatory influence varies significantly by jurisdiction, with some cities requiring operators to meet specific performance metrics (utilization rates, safety records, parking compliance) to maintain permits. In contrast, others impose arbitrary caps without performance linkage. These restrictions particularly impact smaller operators who cannot achieve economies of scale within constrained fleet sizes, accelerating market consolidation as only well-capitalized players can sustain operations under restrictive permit regimes.
High Vandalism, Theft and Maintenance Costs
Vandalism and theft rates have increased year-over-year as shared micromobility vehicles become more prevalent in urban environments, with replacement costs averaging USD 400-600 per e-scooter and USD 800-1,200 per e-bike. Insurance providers like Laka have expanded coverage for micromobility fleets, indicating industry recognition of these risks as material operational expenses. Maintenance costs compound the challenge, as shared vehicles experience 10x higher wear rates than privately owned equivalents due to continuous usage and exposure to weather conditions. The geographic concentration of these issues in high-density urban areas creates operational complexity, as operators must balance vehicle availability in high-demand locations against elevated loss rates. Purpose-built hardware with integrated anti-theft features and improved durability represents a strategic response. However, it requires significant upfront investment that many operators cannot afford during the current profitability transition.
*Our forecasts treat driver/restraint impacts as directional, not additive. The impact forecasts reflect baseline growth, mix effects, and variable interactions.
Segment Analysis
By Vehicle Type: E-bikes Drive Premium Segment Growth
Scooters hold a 63.07% share of the bike and scooter rental market in 2024, registering the highest growth momentum at 19.82% CAGR through 2030. This growth differential reflects e-bikes' superior utility for longer trips and cargo capacity, making them particularly attractive for delivery applications and suburban commuting. Scooters benefit from lower unit costs and higher turnover rates, explaining their continued dominance in short-trip urban markets where convenience trumps range considerations. The vehicle type segmentation increasingly reflects use case specialization rather than simple preference, with operators deploying mixed fleets to capture diverse demand patterns.
Regulatory frameworks significantly influence vehicle type adoption, as e-bike regulations typically align with bicycle infrastructure, while e-scooter legalization remains inconsistent across jurisdictions. Battery technology improvements favor e-bikes, as their larger form factor accommodates higher-capacity cells that deliver 40-60 kilometers of range compared to e-scooters' typical 25-30 kilometers of capacity. This range advantage becomes decisive for operators targeting suburban markets and longer-distance commuting applications where scooters cannot compete effectively.


By Service Type: Subscription Models Target Corporate Clients
Pay-as-you-go services held a 71.12% share of the bike and scooter rental market in 2024, while subscription-based models expanded faster with a 22.38% CAGR through 2030, underscoring operators’ shift toward predictable revenues and more substantial customer lifetime value. Corporate mobility programs drive subscription adoption, with companies like those partnering with JobRad and RidePanda offering employee bike benefits that guarantee utilization and reduce customer acquisition costs.
The evolution of the service model mirrors broader software industry trends toward recurring revenue, as operators recognize that subscription customers generate higher lifetime value than casual pay-per-ride users. Unagi's subscription model demonstrates how premium positioning can command higher monthly fees by bundling insurance, maintenance, and premium vehicle access. Pay-as-you-go remains dominant due to tourist and occasional user segments that resist monthly commitments. However, dynamic pricing algorithms increasingly optimize per-ride rates to maximize revenue from infrequent users. The segmentation creates natural customer progression paths, where satisfied pay-per-ride users convert to subscriptions as usage frequency increases.
By Rental Duration: Long-term Rentals Capture Delivery Demand
Short-term rentals hold an 82.04% share of the bike and scooter rental market in 2024, while long-term options expand at 18.27% CAGR through 2030, supported by rising demand from delivery personnel seeking reliable vehicle access for steady income generation. Weekly and monthly rentals typically command 40-60% discounts compared to equivalent daily rates, making them attractive for delivery workers whose earnings depend on vehicle availability.
The duration segmentation reflects fundamental differences in user economics and trip patterns. Short-term rentals serve spontaneous mobility needs and tourism applications where flexibility justifies premium per-hour pricing. Long-term options cater to users with predictable transportation requirements who can commit to extended periods in exchange for cost savings. Operators increasingly offer hybrid models that combine subscription access with usage-based billing, allowing frequent users to secure vehicle availability while paying only for actual riding time. This approach addresses the challenge of seasonal demand variation, where short-term usage peaks during summer months while long-term rentals provide revenue stability during low-season periods.
By End User: Delivery Personnel Drive Fastest Growth
Daily commuters held a 45.96% share of the bike and scooter rental market in 2024, underscoring the segment’s maturity and widespread urban adoption. Delivery personnel surged at a 23.62% CAGR through 2030, evolving from a niche user base into a central revenue driver fueled by gig economy growth. Students and tourists comprise smaller but stable segments that provide geographic diversity and seasonal balance to operator revenue streams. The end user segmentation increasingly influences vehicle specifications and service design, as delivery applications require features different from those of recreational or commuting use cases.
Professional delivery usage generates significantly higher utilization rates, with delivery personnel typically logging 6-8 hours daily compared to commuters' 30-60 minute average trips. This intensive usage pattern creates both opportunities and challenges: higher revenue per vehicle but accelerated wear rates and maintenance requirements. India's delivery surge, where scooter sales increased dramatically to support food delivery expansion, demonstrates how professional applications can drive entire market segments. Tourist segments provide geographic expansion opportunities, as vacation destinations often have lower regulatory barriers and seasonal demand patterns that complement urban commuter markets. The segmentation drives product differentiation, with cargo-equipped e-bikes targeting delivery users while lightweight scooters serve tourist and student segments.
Geography Analysis
Asia-Pacific dominates with a 37.98% of the bike and scooter rental market share in 2024. It leads growth at an 18.91% CAGR through 2030, driven by China's stabilized bike-sharing ecosystem and India's delivery-driven demand surge. China's market maturation, with Hellobike, Meituan, and Didi establishing sustainable operations, provides a template for other Asian markets seeking to avoid the boom-bust cycles that characterized earlier expansion phases. India represents the region's highest growth potential, as urban density, limited parking infrastructure, and the expanding gig economy create ideal conditions for shared micromobility adoption. The regulatory environment varies significantly across Asia, with Singapore and Japan implementing supportive frameworks while other markets maintain restrictive approaches that limit operator expansion.
Europe exhibits strong growth momentum despite regulatory fragmentation, with the TIER-Dott merger creating a regional champion capable of navigating complex multi-jurisdictional compliance requirements. The European market benefits from extensive cycling infrastructure and supportive government policies, though city-specific regulations create operational complexity that favors larger operators with compliance capabilities. North America shows steady expansion led by major metropolitan areas, though regulatory uncertainty around e-scooter legalization constrains growth compared to more permissive jurisdictions. The geographic segmentation reflects infrastructure readiness, regulatory environment, and cultural acceptance of shared mobility concepts.
The Middle East and Africa represent emerging opportunities with limited current penetration but significant growth potential as urbanization accelerates and governments seek sustainable transportation solutions. Dubai's progressive micromobility regulations demonstrate how forward-thinking policy frameworks can attract operator investment and accelerate market development. Latin America shows mixed development, with Brazil and Argentina leading adoption while other markets remain constrained by regulatory uncertainty and economic volatility. The geographic expansion pattern typically follows urban density and disposable income levels, with operators prioritizing markets that can support sustainable unit economics from launch rather than pursuing growth-at-any-cost strategies that characterized earlier market development phases.

Competitive Landscape
The bike and scooter rental market has dramatically consolidated, transforming from a fragmented landscape with dozens of operators to a concentrated structure dominated by well-capitalized players capable of achieving sustainable unit economics.
Technology differentiation increasingly determines competitive success, as operators leverage AI-powered demand prediction, IoT fleet management, and predictive maintenance to optimize utilization rates and reduce operational costs. White-space opportunities exist in corporate mobility services, long-term rental models, and delivery-focused applications where traditional operators have limited penetration.
Emerging disruptors focus on vertical integration strategies, exemplified by Yulu's partnership with Bajaj for purpose-built vehicles and battery-swapping infrastructure that creates operational advantages over generic hardware deployments. The competitive dynamics favor operators with strong balance sheets and proven unit economics, as regulatory bodies increasingly require financial stability and operational performance metrics for permit renewal. Market leaders must navigate complex multi-jurisdictional compliance requirements while maintaining service quality and fleet availability, creating barriers to entry that protect established positions but limit innovation from smaller players.
Bike And Scooter Rental Industry Leaders
-
Dott
-
Lime (Neutron Holdings, Inc. )
-
Bird Rides, Inc
-
Lyft, Inc.
-
Voi Technology AB
- *Disclaimer: Major Players sorted in no particular order

Recent Industry Developments
- March 2025: Laka acquired Luko's e-scooter insurance business from Allianz Direct in France, adding approximately 20,000 customers and expanding its European micromobility insurance footprint. This acquisition strengthens Laka's position as a specialized insurance provider for shared mobility operators and reflects growing recognition of insurance as a critical operational component for sustainable micromobility business models.
- March 2024: TIER Mobility completed its merger with Dott, creating Europe's largest micromobility operator, serving 427 cities with a combined revenue of EUR 250 million. Henri Moissinac assumed CEO leadership of the merged entity, which now operates over 110,000 vehicles across 12 countries. This demonstrates how consolidation creates regional champions capable of achieving economies of scale.


Global Bike And Scooter Rental Market Report Scope
| Bikes |
| Scooters |
| Pay-as-you-Go |
| Subscription-Based |
| Short-Term (Hourly, Daily) |
| Long-Term (Weekly, Monthly) |
| Tourists |
| Daily Commuters |
| Students |
| Delivery Personnel |
| North America | United States |
| Canada | |
| Rest of North America | |
| South America | Brazil |
| Argentina | |
| Rest of South America | |
| Europe | United Kingdom |
| Germany | |
| Spain | |
| Italy | |
| France | |
| Russia | |
| Rest of Europe | |
| Asia-Pacific | India |
| China | |
| Japan | |
| South Korea | |
| Rest of Asia-Pacific | |
| Middle East and Africa | United Arab Emirates |
| Saudi Arabia | |
| Turkey | |
| Egypt | |
| South Africa | |
| Rest of Middle East and Africa |
| By Vehicle Type | Bikes | |
| Scooters | ||
| By Service Type | Pay-as-you-Go | |
| Subscription-Based | ||
| By Rental Duration | Short-Term (Hourly, Daily) | |
| Long-Term (Weekly, Monthly) | ||
| By End User | Tourists | |
| Daily Commuters | ||
| Students | ||
| Delivery Personnel | ||
| By Region | North America | United States |
| Canada | ||
| Rest of North America | ||
| South America | Brazil | |
| Argentina | ||
| Rest of South America | ||
| Europe | United Kingdom | |
| Germany | ||
| Spain | ||
| Italy | ||
| France | ||
| Russia | ||
| Rest of Europe | ||
| Asia-Pacific | India | |
| China | ||
| Japan | ||
| South Korea | ||
| Rest of Asia-Pacific | ||
| Middle East and Africa | United Arab Emirates | |
| Saudi Arabia | ||
| Turkey | ||
| Egypt | ||
| South Africa | ||
| Rest of Middle East and Africa | ||


Key Questions Answered in the Report
How big is the bike and scooter rental market in 2025?
The bike and scooter rental market size is USD 5.53 billion in 2025 and is projected to more than double by 2030.
What is the expected CAGR for shared micromobility to 2030?
The market is forecast to expand at a 15.14% CAGR through 2030.
Which region leads current revenue?
Asia-Pacific commands 37.98% of global revenue and shows the fastest 18.91% CAGR.
Which vehicle segment is growing fastest?
E-bikes are growing at 19.82% CAGR, driven by longer range and delivery use.
What business model trend is reshaping operator revenue?
Subscription plans are rising 22.38% CAGR, giving operators recurring cash flow and higher customer lifetime value.
What is a major barrier to expansion in mature cities?
Permit caps and fleet-size limits imposed by municipalities can restrict growth and favor large, well-funded incumbents.
Page last updated on:


