Behavior Analytics Market Size and Share
Market Overview
| Study Period | 2019 - 2030 |
|---|---|
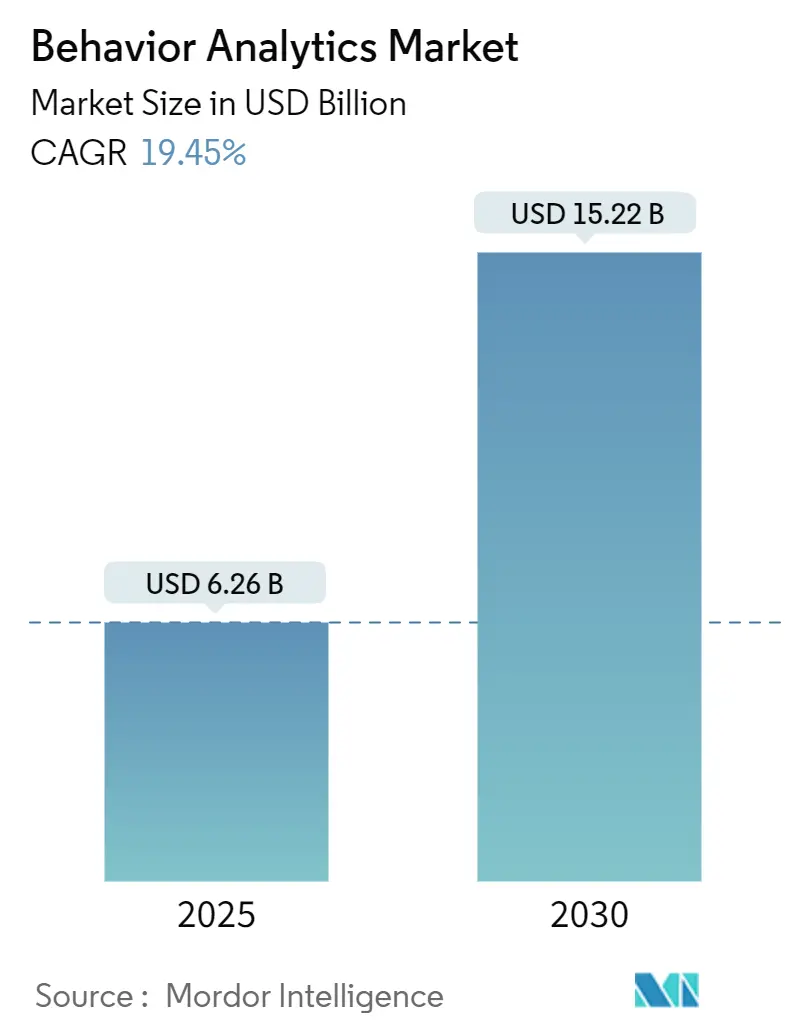
| Market Size (2025) | USD 6.26 Billion |
| Market Size (2030) | USD 15.22 Billion |
| Growth Rate (2025 - 2030) | 19.45% CAGR |
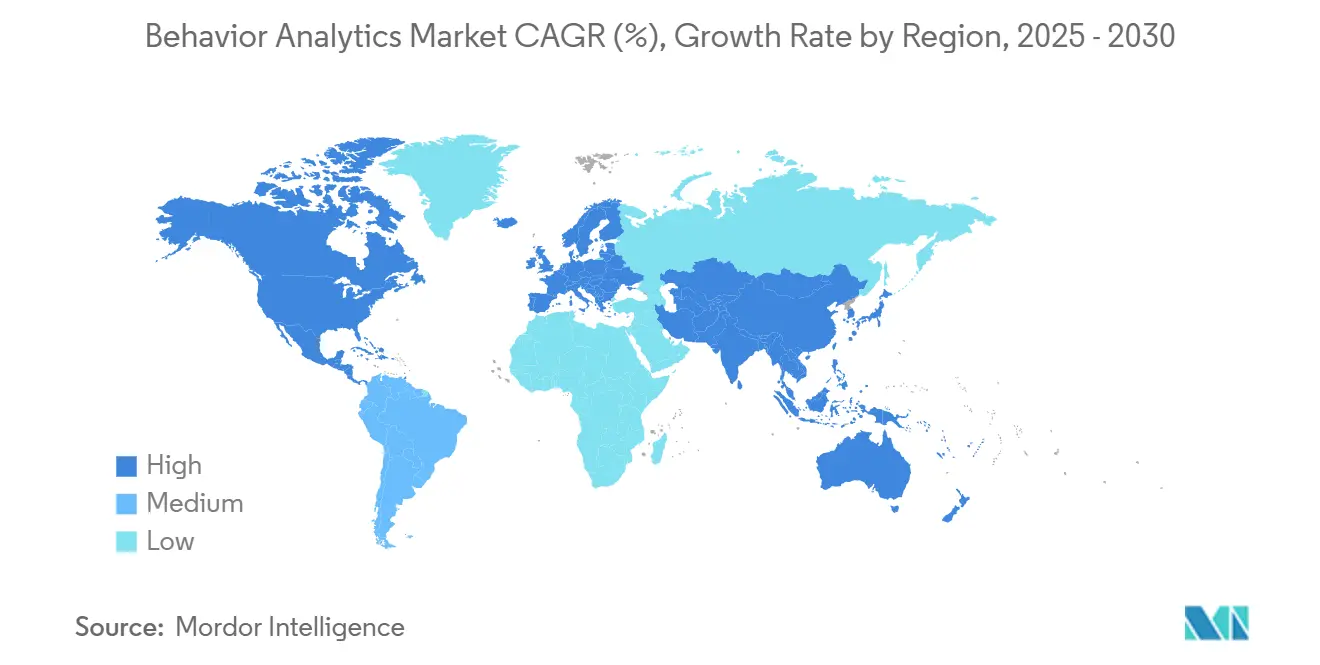
| Fastest Growing Market | Asia Pacific |
| Largest Market | North America |
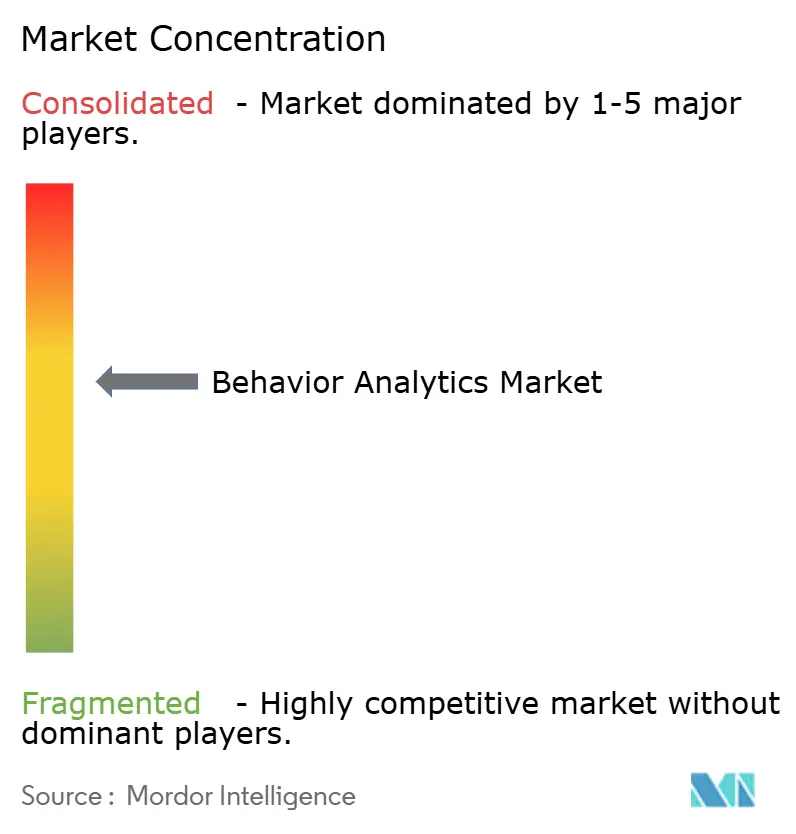
| Market Concentration | Medium |
Major Players *Disclaimer: Major Players sorted in no particular order Image © Mordor Intelligence. Reuse requires attribution under CC BY 4.0. | |
Behavior Analytics Market Analysis by Mordor Intelligence
The behavior analytics market size is estimated at USD 6.26 billion in 2025 and is forecast to reach USD 15.22 billion by 2030, translating into a 19.45% CAGR during the period. Demand accelerates as organizations shift from perimeter defenses to behavior-centric threat detection that stops insiders and advanced persistent attackers. Cloud migrations, zero-trust rollouts, and a wave of platform consolidation position behavior analytics as the analytical “brain” inside modern security operations centers. Vendors use AI to automate high-volume investigations, allowing security teams to tackle a 4.8 million-person skills shortage. Converged UEBA-SIEM-XDR stacks shorten detection cycles from days to minutes, helping enterprises comply with global privacy regulations while curbing average insider breach losses of USD 4.88 million.
Key Report Takeaways
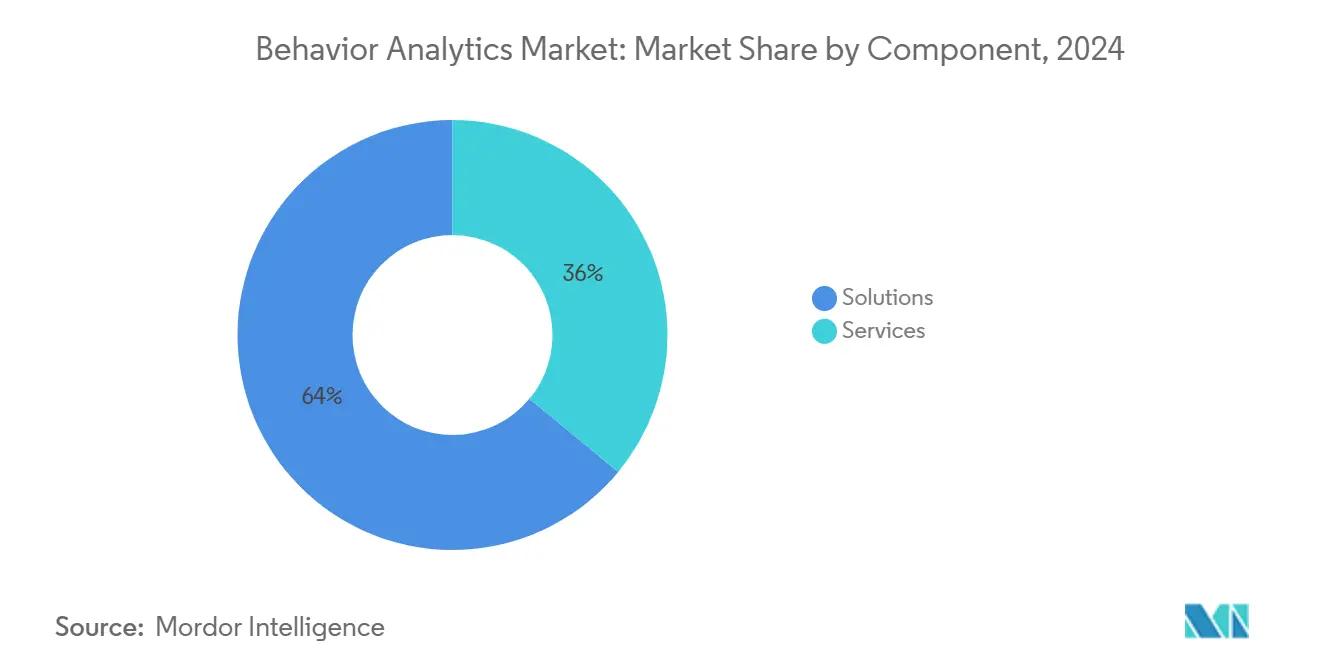
- By component, solutions held 64% of the behavior analytics market share in 2024, while services are projected to expand at a 22.4% CAGR to 2030.
- By user focus, employee-centric analytics captured a 58% share in 2024; customer-centric use cases are expanding fastest at a 20.8% CAGR to 2030.
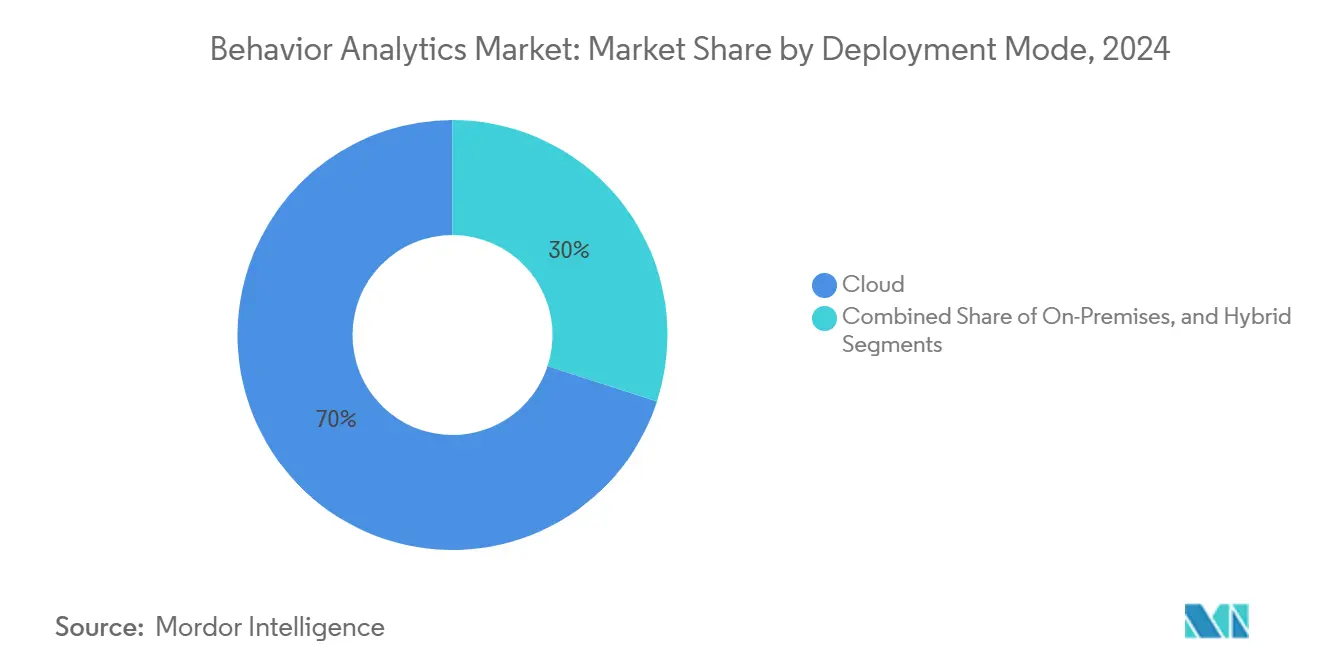
- By deployment mode, cloud delivery accounted for 70% of the 2024 base, whereas hybrid models are set to grow at a 24% CAGR on data-sovereignty demands.
- By organization size, large enterprises controlled 68% revenue in 2024, yet SMEs are projected to rise at a 21.8% CAGR as SaaS pricing falls.
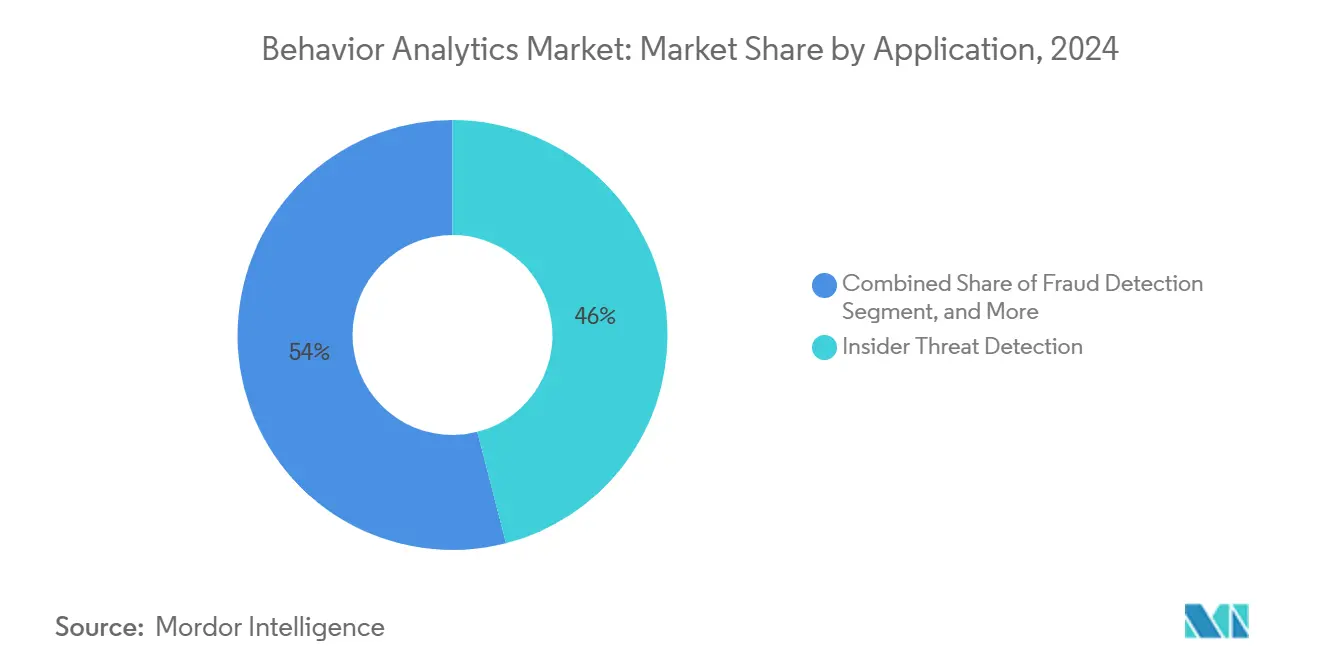
- By application, insider threat detection represented 46% of the behavior analytics market size in 2024; threat hunting and response is poised for a 24.5% CAGR to 2030.
- By industry vertical, BFSI led with 29% revenue in 2024; healthcare is tracking the quickest climb at a 20.1% CAGR through 2030.
- By geography, North America dominated with a 40% share in 2024, while the Asia Pacific is forecast to register a 19.8% CAGR to 2030.
Global Behavior Analytics Market Trends and Insights
Drivers Impact Analysis*
| Driver | (~) % Impact on CAGR Forecast | Geographic Relevance | Impact Timeline |
|---|---|---|---|
| Expanding cloud adoption across enterprises | +3.2% | Global, early gains in North America and Europe | Medium term (2-4 years) |
| Rising frequency and cost of insider threats | +2.8% | Global, acute in BFSI and healthcare | Short term (≤ 2 years) |
| Strict global data-privacy regulations | +1.5% | North America, EU core, expanding to APAC | Long term (≥ 4 years) |
| UEBA-SIEM-XDR convergence | +1.2% | Global, led by mature markets | Medium term (2-4 years) |
| Shift to identity-first zero trust | +0.8% | North America and Europe, spill-over to APAC | Long term (≥ 4 years) |
| Digital-twin behavioral simulation | +0.6% | Advanced R&D markets | Long term (≥ 4 years) |
| Source: Mordor Intelligence | |||
Expanding Cloud Adoption Across Enterprises
Faster cloud migration pushes enterprises to deploy behavior analytics that ingest API, workload, and microservice telemetry at petabyte scale, something on-premises tools cannot manage. Real-time correlation across multi-cloud footprints creates unified baselines, enabling detection of anomalies that span hybrid estates. Cloud UEBA engines process nearly 300 times more events than legacy systems while compressing rollout cycles from months to weeks. DevSecOps teams now embed analytics into CI/CD pipelines, surfacing risky code behaviors before production release. As a result, more than 70% of large North American enterprises run some form of cloud-native UEBA.
Rising Frequency and Cost of Insider Threats
Insiders drive 60% of modern breaches, each costing USD 4.88 million on average, which propels continuous monitoring beyond access controls. Defense and justice agencies already operate dedicated insider-threat programs that couple user-activity monitoring with psycholinguistics to flag disgruntled employees weeks ahead of an incident.[1]U.S. Department of Justice, “Insider Threat Monitoring and Analytics,” justice.gov Hospitals face HIPAA fines near USD 10.93 million per event, spurring patient-privacy analytics that track illegitimate record views. AI-powered language models enrich behavior scores with sentiment changes, giving financial institutions early warning of rogue trading or data-exfiltration attempts.
Strict Global Data-Privacy Regulations (GDPR, CCPA, etc.)
Regulators require that organizations both watch user actions and shield identities, forcing privacy-first UEBA designs that rely on anonymization, federated learning, and differential-privacy techniques. Split architectures process EU data inside the bloc while syncing global threat intelligence. Healthcare providers audit electronic health record access to avoid violations, whereas banks overlay anti-money-laundering rules on customer behavior without exposing personal data.
Convergence of UEBA with SIEM and XDR Platforms
Unified platforms drop alert fatigue by merging user context with network, endpoint, and application telemetry. When Palo Alto Networks folded QRadar SaaS into Cortex XSIAM, customers saw false positives fall from 99.5% to under 5%. Microsoft’s unified security operations stack links identity anomalies to malware traces, cutting median response times by 270 times. For resource-strained firms, integrated consoles remove the need for specialized UEBA skills.
Restraints Impact Analysis*
| Restraint | (~) % Impact on CAGR Forecast | Geographic Relevance | Impact Timeline |
|---|---|---|---|
| Skilled-talent shortage | −2.1% | Global, most acute in emerging markets | Short term (≤ 2 years) |
| High legacy-system integration costs | −1.4% | Global, especially mid-market firms | Medium term (2-4 years) |
| Model drift causing false positives | −1.0% | Global, stronger in cloud-native setups | Medium term (2-4 years) |
| Data-sovereignty barriers | −0.7% | EU and APAC core, expanding globally | Long term (≥ 4 years) |
| Source: Mordor Intelligence | |||
Shortage of Skilled Behavior-Analytics Professionals
A 4.8 million-person cybersecurity workforce gap leaves few experts able to tune ML models or interpret complex behavior patterns.[2]ISC2, “The State of the Cybersecurity Workforce,” isc2.org Managed-security providers step in, driving the services segment’s 22.4% CAGR. Cisco estimates AI automation can shoulder 96% of routine analytic tasks, freeing scarce talent for high-value threat-hunting. Skills shortages hit mid-sized enterprises hardest, making turnkey cloud offerings attractive.
High Integration and Deployment Costs for Legacy Systems
Enterprises with mainframes, proprietary databases, and custom apps face integration expenses that exceed USD 2 million when embedding full-scope behavior analytics. Each additional log source multiplies complexity as formats differ across decades-old technologies. Budget pressures often postpone projects at mid-market firms, while cloud-native rivals integrate faster through standardized APIs. Government agencies with classified systems remain tied to on-premises deployments, elongating payback periods.
*Our forecasts treat driver/restraint impacts as directional, not additive. The impact forecasts reflect baseline growth, mix effects, and variable interactions.
Segment Analysis
By Component: Solutions Sustain Leadership While Services Accelerate
Solutions generated 64% of 2024 revenue as organizations chose turnkey platforms that bundle analytics engines, dashboards, and connectors. Enterprises value rapid value realization without piecing together disparate tools. Services, however, are projected to expand at a 22.4% CAGR as talent gaps push firms to outsource 24/7 monitoring. Securonix’s GenAI agents now automate triage and enrichment, letting service providers scale clients without linear staff growth. This dynamic ensures solutions continue to anchor spending, while services gain share among mid-market adopters seeking expertise.
Spending patterns indicate that full-stack offerings remain favored by regulated sectors requiring certified workflows. Yet subscription pricing and AI automation draw cost-conscious buyers toward service bundles. By 2030, the behavior analytics market size attributable to managed services could near one-third of global revenue, assuming provider SLAs keep pace with evolving insider-threat tactics.


By User Focus: Employee Monitoring Dominates yet Customer Analytics Gains Steam
Employee-centric deployments controlled 58% of 2024 outlays, reflecting mounting insider losses across BFSI and healthcare. Defense agencies monitor privileged users through psycholinguistic engines that flag sentiment shifts. Banks watch privileged access to trading platforms to curb rogue trades. Meanwhile, customer-centric analytics is climbing at a 20.8% CAGR on surging e-commerce fraud and account takeovers. Retailers apply identity behavior profiling to separate genuine shoppers from bots during peak shopping events.
Rising digital commerce and open-banking APIs enlarge the customer risk surface, amplifying demand for continuous behavioral scoring. Convergence trends show vendors merging employee and customer visibility, promising unified threat detection across internal and external interactions. This blended approach will keep the behavior analytics market vibrant across both monitoring categories.
By Deployment Mode: Cloud Rules but Hybrid Flourishes
Cloud delivery accounted for 70% of 2024 implementations, favored for elastic scale and rapid provisioning. Enterprises embed cloud UEBA within DevSecOps pipelines, gaining real-time anomaly alerts during development and production. Hybrid architectures are forecast to outpace all modes at 24% CAGR because data-sovereignty statutes force sensitive logs to stay on-premises while anonymized data feeds cloud engines. Financial institutions in multi-jurisdictional markets typify this split model.
On-premises deployments persist inside governments and critical infrastructure operators that cannot export classified data. Vendors, therefore, ship unified management layers that orchestrate models across cloud and edge nodes. This flexibility safeguards share for each mode while underpinning overall behavior analytics market expansion.

By Organization Size: Large Enterprises Lead, SMEs Democratize Analytics
Large enterprises generated 68% of 2024 spend owing to deep budgets and complex zero-trust rollouts. They layer behavior analytics across thousands of entities to meet strict audit mandates. SMEs, however, are growing at a 21.8% CAGR as SaaS license tiers and managed offerings lower entry barriers. Providers market fixed-price bundles that deliver enterprise-grade analytics without dedicated SOC staffing.
Cloud subscriptions and AI assistants simplify adoption for mid-market buyers who previously lacked in-house data-science capacity. Consequently, SMEs are forecast to account for a rising portion of the incremental behavior analytics market size by the decade’s close.
By Application: Insider Threat Detection Remains Core while Threat Hunting Surges
Insider threat detection held 46% of application revenue in 2024, driven by privileged-user misuse and compliance fines. UEBA scores integrate with identity-and-access-management systems, enforcing continuous authentication. Threat hunting and response is projected to advance fastest at 24.5% CAGR as converged XDR stacks use behavioral baselines to surface unknown attacker dwell time.
Fraud detection strengthens in BFSI and retail, leveraging transaction analytics for instant decisioning. Diversifying use cases underline the behavior analytics market evolution from niche insider-threat tooling to a multipurpose security pillar.
By Industry Vertical: BFSI Tops Revenue, Healthcare Rises Fastest
BFSI produced 29% of 2024 turnover, anchored by anti-money-laundering and payment-fraud mandates. Banks like JPMorgan process millions of transactions in real time using AI behavior models that cut fraud losses. Healthcare is set for a 20.1% CAGR as telehealth accelerates, increasing PHI exposure and HIPAA penalty risk. Tech and telecom firms employ analytics to guard intellectual property, while e-commerce deploys behavioral scoring against synthetic identities.
Government and defense focus heavily on internal threats, elevating demand for accredited platforms. Diverse regulatory pressures ensure steady vertical penetration across the behavior analytics market.
Geography Analysis
North America delivered 40% of 2024 revenue on early zero-trust uptake and large cyber budgets above USD 200 billion annually. Major vendors base R&D hubs in the region, compressing product cycles and spurring adoption. Financial and healthcare entities deploy behavior-centric controls to satisfy SOX, HIPAA, and other mandates. Large banks report fraud detection cycles that are 300 times quicker once behavior analytics is embedded.
Asia-Pacific is the fastest-growing theatre, projected at 19.8% CAGR to 2030. Rapid digitalization, cloud-first mandates, and government cybersecurity frameworks fuel uptake. Countries like China and India sponsor behavior monitoring for critical infrastructure, while ASEAN fintech growth extends requirements to digital banks. Cyber-insurance expansion across APAC underscores analytics as a prerequisite for underwriting.[3]Gallagher Re, “Protecting the Digital Revolution,” ajg.com
Europe’s growth stays steady under the GDPR umbrella, balancing monitoring needs with privacy safeguards. Latin American organizations endure 40% more attacks than the global mean, escalating urgency for analytics-driven defense. The Middle East and Africa represent emerging frontiers where digital initiatives spur demand, though skills shortages and budget constraints encourage managed-service adoption.

Competitive Landscape
The behavior analytics market shows moderate consolidation. Cisco’s USD 28 billion purchase of Splunk closes the gap between XDR and SIEM, creating full-stack visibility. The Exabeam-LogRhythm merger forms a unified AI-driven platform ready for quarterly product releases that enhance automation.
Palo Alto Networks’ absorption of QRadar SaaS customers into Cortex XSIAM signals a shift to integrated ecosystems. Leaders differentiate through embedded AI, digital-twin simulations, and privacy-preserving analytics.
Challenger vendors carve niches in healthcare privacy and insider psycholinguistics. Cloud-native entrants win mid-market share via rapid onboarding and subscription pricing. Competitive intensity hinges on the breadth of integrations, with customers favoring one console over multiple point tools. This trend shapes roadmaps as vendors race to add automation, threat-intelligence feeds, and compliance reporting within a single pane of glass.
Behavior Analytics Industry Leaders
Splunk LLC
Securonix
Varonis Systems, Inc.
Rapid7, Inc.
Exabeam LLC
- *Disclaimer: Major Players sorted in no particular order

Recent Industry Developments
- June 2025: Securonix unveiled GenAI SOC agents that automate Level 1-3 workflows, easing the cybersecurity labor crunch.
- August 2024: Experian acquired NeuroID to enhance its fraud risk suite with behavioral analytics, offering insights into digital signals across account openings, logins, and transactions.
- August 2024: Splunk launched Asset and Risk Intelligence for unified visibility across hybrid estates.
- July 2024: Exabeam and LogRhythm have merged to deliver an AI-driven platform with advanced Security Information and Event Management (SIEM) and User and Entity Behavior Analytics (UEBA) solutions.


Global Behavior Analytics Market Report Scope
| Solutions | |
| Services | Professional Services |
| Managed Services |
| Customer-Centric |
| Employee-Centric |
| On-Premises |
| Cloud |
| Hybrid |
| Large Eneterprises |
| Small and Medium Enterprises (SMEs) |
| Insider Threat Detection |
| Fraud Detection |
| Identity and Access Management |
| Threat Hunting and Response |
| Other Applications |
| BFSI |
| IT and Telecom |
| Retail and e-Commerce |
| Healthcare |
| Government and Defense |
| Other Industry Verticals |
| North America | United States | |
| Canada | ||
| Mexico | ||
| South America | Brazil | |
| Argentina | ||
| Rest of South America | ||
| Europe | Germany | |
| United Kingdom | ||
| France | ||
| Italy | ||
| Spain | ||
| Rest of Europe | ||
| Asia-Pacific | China | |
| Japan | ||
| India | ||
| South Korea | ||
| ASEAN | ||
| Rest of Asia-Pacific | ||
| Middle East and Africa | Middle East | Saudi Arabia |
| United Arab Emirates | ||
| Turkey | ||
| Rest of Middle East | ||
| Africa | South Africa | |
| Nigeria | ||
| Rest of Africa | ||
| By Component | Solutions | ||
| Services | Professional Services | ||
| Managed Services | |||
| By User Focus | Customer-Centric | ||
| Employee-Centric | |||
| By Deployment Mode | On-Premises | ||
| Cloud | |||
| Hybrid | |||
| By Organization Size | Large Eneterprises | ||
| Small and Medium Enterprises (SMEs) | |||
| By Application | Insider Threat Detection | ||
| Fraud Detection | |||
| Identity and Access Management | |||
| Threat Hunting and Response | |||
| Other Applications | |||
| By Industry Vertical | BFSI | ||
| IT and Telecom | |||
| Retail and e-Commerce | |||
| Healthcare | |||
| Government and Defense | |||
| Other Industry Verticals | |||
| By Geography | North America | United States | |
| Canada | |||
| Mexico | |||
| South America | Brazil | ||
| Argentina | |||
| Rest of South America | |||
| Europe | Germany | ||
| United Kingdom | |||
| France | |||
| Italy | |||
| Spain | |||
| Rest of Europe | |||
| Asia-Pacific | China | ||
| Japan | |||
| India | |||
| South Korea | |||
| ASEAN | |||
| Rest of Asia-Pacific | |||
| Middle East and Africa | Middle East | Saudi Arabia | |
| United Arab Emirates | |||
| Turkey | |||
| Rest of Middle East | |||
| Africa | South Africa | ||
| Nigeria | |||
| Rest of Africa | |||


Key Questions Answered in the Report
What is the current behavior analytics market size and its growth outlook?
The behavior analytics market size is estimated at USD 6.26 billion in 2025 and is projected to reach USD 15.22 billion by 2030, reflecting a 19.45% CAGR.
Which region is forecast to grow fastest for behavior analytics?
Asia-Pacific is projected to post a 19.8% CAGR through 2030, fueled by rapid digitalization and cloud-first policies.
What component segment holds the biggest share of spending?
Solutions accounted for 64% of 2024 revenue, reflecting preference for turnkey platforms.
Why are managed services growing quickly?
A global shortage of 4.8 million cybersecurity professionals pushes firms to outsource analytics, driving a 22.4% CAGR in managed services.
Which industry vertical spends the most on behavior analytics?
Banking, financial services, and insurance generated 29% of 2024 global revenue due to stringent compliance mandates.
What is the primary use case for behavior analytics tools?
Insider threat detection leads with 46% share, as enterprises seek to curb costly internal breaches.
Page last updated on:


