Augmented Intelligence Market Size and Share
Market Overview
| Study Period | 2019 - 2030 |
|---|---|
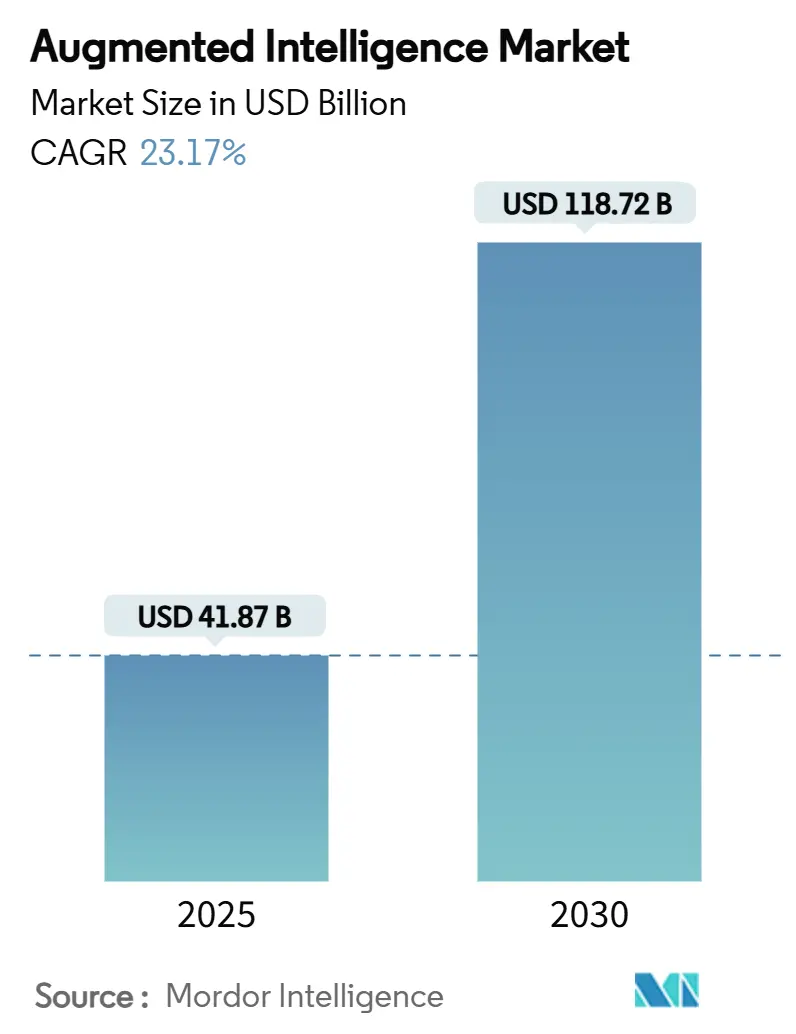
| Market Size (2025) | USD 41.87 Billion |
| Market Size (2030) | USD 118.72 Billion |
| Growth Rate (2025 - 2030) | 23.17% CAGR |
| Fastest Growing Market | Asia Pacific |
| Largest Market | North America |
| Market Concentration | Medium |
Major Players *Disclaimer: Major Players sorted in no particular order Image © Mordor Intelligence. Reuse requires attribution under CC BY 4.0. | |
Augmented Intelligence Market Analysis by Mordor Intelligence
The augmented intelligence market size stands at USD 41.87 billion in 2025 and is forecast to expand to USD 118.72 billion by 2030 at a 23.17% CAGR, underscoring the structural pivot from task-level automation to human-AI collaboration models. Current expansion is fueled by hyperscale cloud investments that have taken enterprise adoption beyond proofs of concept, as evidenced by Microsoft’s AI revenue run-rate topping USD 13 billion in Q2 FY25, a 175% jump over the prior year.[1]Microsoft Corporation, “FY 2025 Q2 Earnings Call,” microsoft.comHybrid deployment configurations are now the fastest-growing architecture, signaling that chief information officers are striving to balance latency, sovereignty, and cost. Service-led revenue is outpacing software licences because most customers require help to integrate large language models with legacy data estates. Asia-Pacific’s rapid uptake, at a 25.40% CAGR, shows that mobile-first ecosystems and manufacturing digitalization can offset infrastructure gaps. Meanwhile, rising electricity use by AI-oriented data centers, projected to reach as much as 12% of United States generation by 2028, adds a sustainability lens to strategic planning.
Key Report Takeaways
- By deployment mode, the augmented intelligence market for hybrid is projected to grow at a 25.85% CAGR between 2025 to 2030.
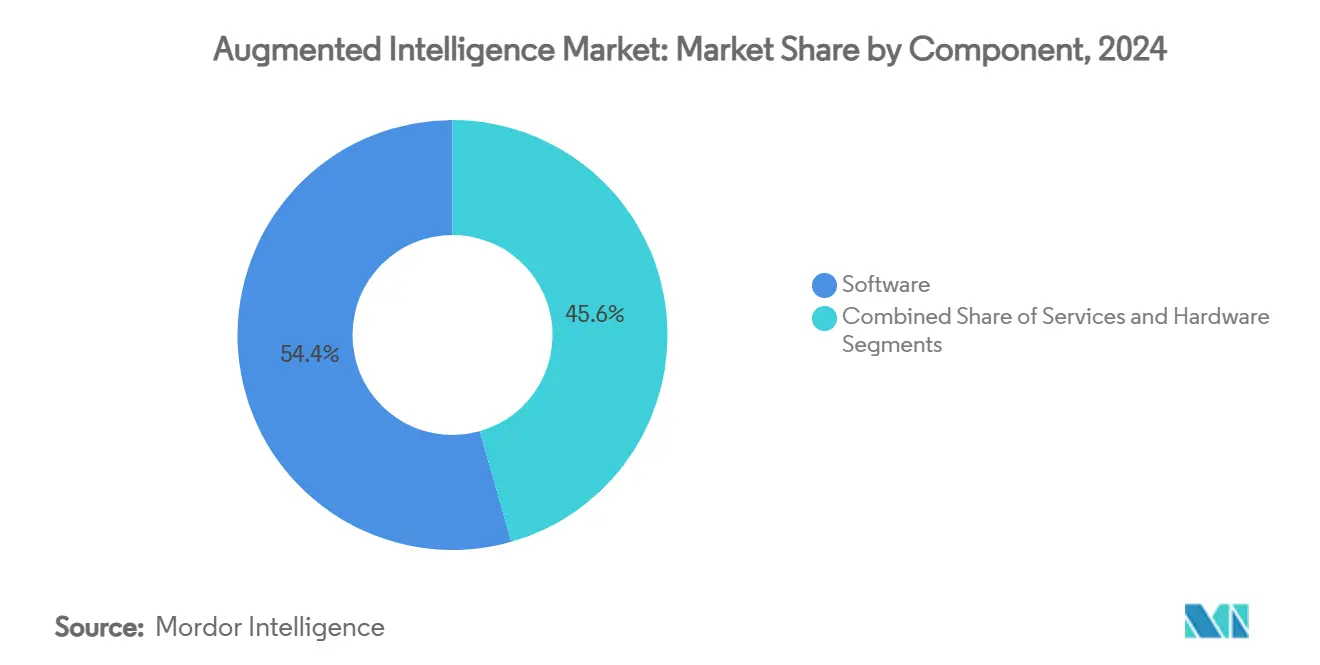
- By component, software captured a 54.40% share of the augmented intelligence market in 2024.
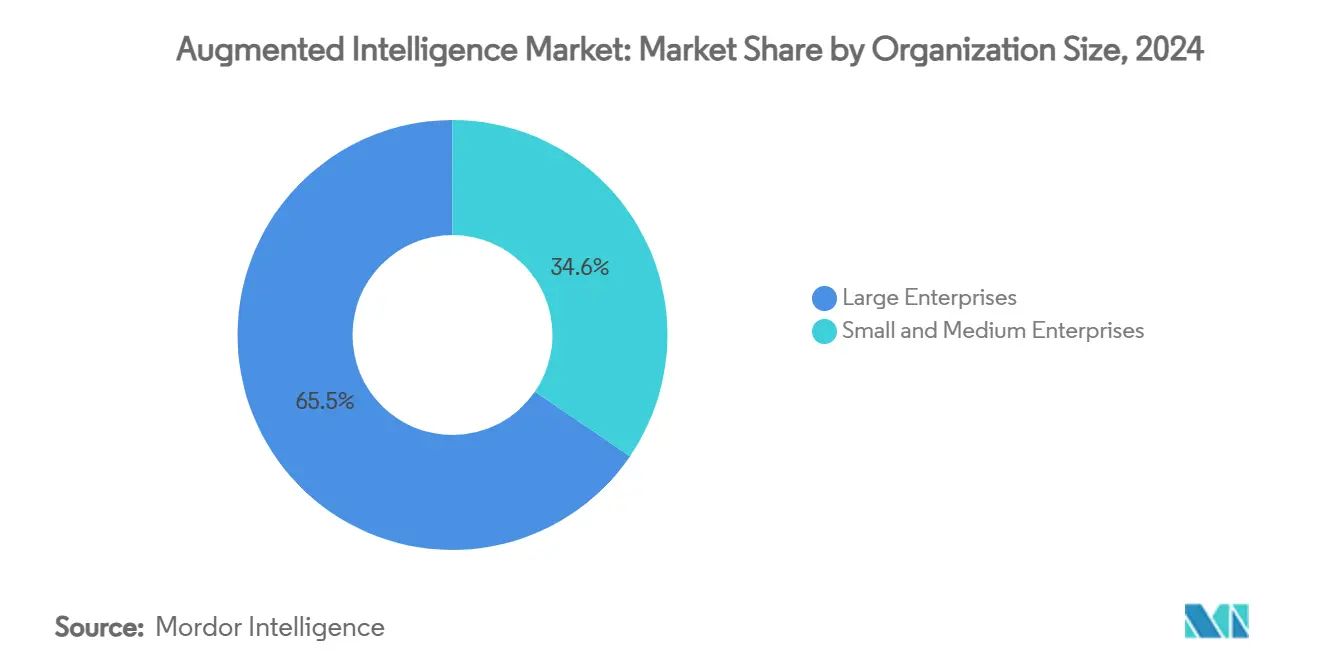
- By organization size, the augmented intelligence market for small and medium enterprises is projected to grow at a 26.40% CAGR between 2025 to 2030.
- By vertical, BFSI captured an 18.45% share of the augmented intelligence market in 2024.
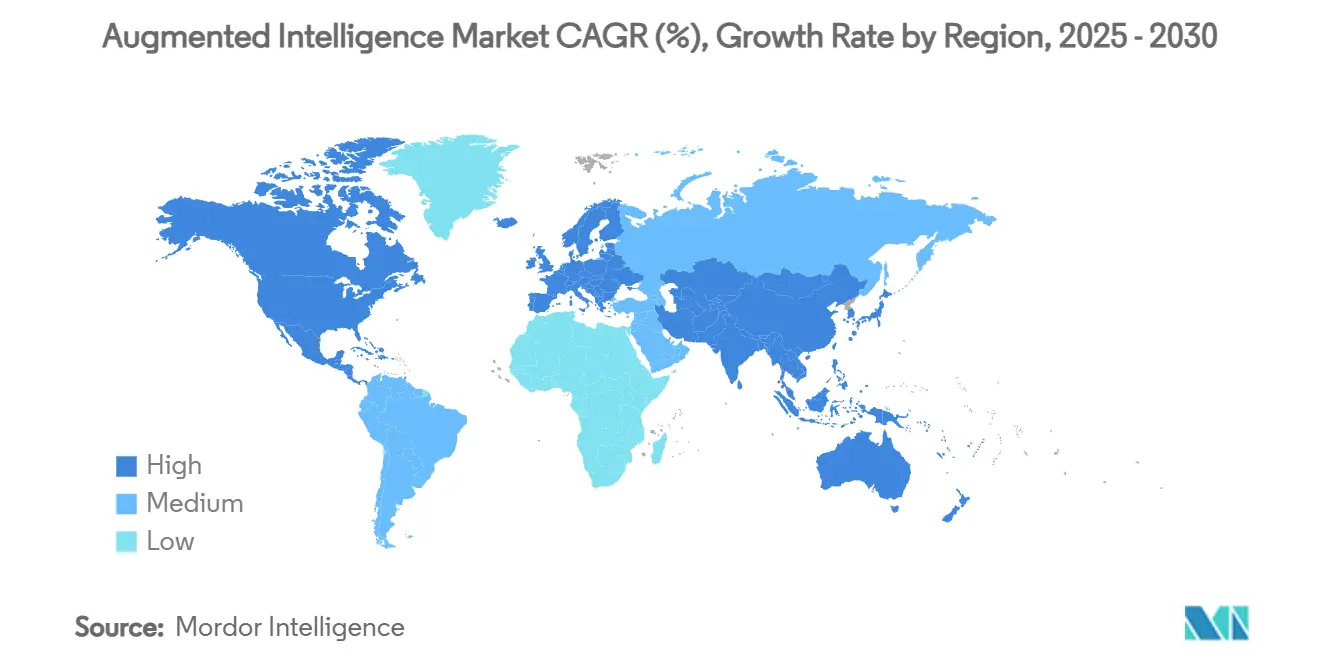
- By geography, the augmented intelligence market in Asia-Pacific is projected to grow at a 25.40% CAGR between 2025 to 2030.
Global Augmented Intelligence Market Trends and Insights
Drivers Impact Analysis*
| Driver | (~) % Impact on CAGR Forecast | Geographic Relevance | Impact Timeline |
|---|---|---|---|
| Cloud-based AI platform proliferation | +4.2% | Global, with North America and EU leading | Medium term (2-4 years) |
| Surge in enterprise demand for data-driven decision making | +3.8% | Global, concentrated in developed markets | Short term (≤ 2 years) |
| Democratisation of AI via low-/no-code toolkits | +3.1% | Global, accelerated in APAC and emerging markets | Medium term (2-4 years) |
| Embedded AI copilots across productivity suites | +2.9% | North America and EU, expanding to APAC | Short term (≤ 2 years) |
| Multimodal foundation models enabling cross-domain insights | +2.7% | Global, led by technology hubs | Long term (≥ 4 years) |
| AI copilots for frontline/desk-less workforce | +2.1% | Global, with industrial regions prioritized | Medium term (2-4 years) |
| Source: Mordor Intelligence | |||
Cloud-based AI platform proliferation
Managed services from hyperscalers have dismantled capital barriers, letting firms of all sizes tap advanced GPUs, pre-trained models, and turnkey MLOps environments. Google Cloud’s Q3 2024 revenue of USD 11.4 billion, up 35%, illustrates the scale benefits of this delivery model. AWS posted 19% growth in Q2 2024 on similar momentum.[2]Amazon.com Inc., “Form 10-Q Q2 2024,” amazon.com Oracle’s footprint of 162 data-center sites, many built with NVIDIA GPU clusters, highlights the industry arms race. These developments collectively lower the cost of entry, broadening the addressable augmented intelligence market.
Surge in enterprise demand for data-driven decision making
Corporate boards now see augmented intelligence as a competitive necessity. The U.S. Census Bureau found AI usage rose to 5.45% of businesses by February 2024 and is on course for 6.5% by late 2024. IDC reports an average return of USD 3.5 per dollar spent on AI initiatives, with 92% of projects delivering production value within 12 months. Federal agencies reinforce momentum by requesting USD 1.9 billion for AI R&D in FY 2024. Management urgency is translating into budget reallocations and shorter deployment cycles, sustaining double-digit growth.
Democratisation of AI via low-/no-code toolkits
Platforms such as Microsoft Power Platform and UiPath Business Automation allow non-technical staff to build AI workflows. UiPath’s FY 2024 revenue reached USD 1.308 billion, rising 24% year on year. Only 8% of EU enterprises currently deploy AI, indicating vast headroom as simplified tooling spreads. For small companies, pay-as-you-go models remove the need for in-house data scientists, lifting the overall augmented intelligence market.
Embedded AI copilots across productivity suites
AI assistants are now integral to day-to-day software. Microsoft 365 Copilot is already in use at 70% of Fortune 500 firms. GitHub Copilot surpassed 1.8 million paid seats, proving developer comfort with AI-augmented coding. Salesforce’s Agentforce AI helped drive Q3 FY25 revenue to USD 9.44 billion. Deep integration raises switching costs and locks AI into daily workflows, securing long-term demand.
Restraints Impact Analysis*
| Restraint | (~) % Impact on CAGR Forecast | Geographic Relevance | Impact Timeline |
|---|---|---|---|
| Data-privacy and compliance complexity | -2.80% | Global, intensified in EU and regulated industries | Short term (≤ 2 years) |
| Acute shortage of AI/ML talent | -2.30% | Global, most severe in developed markets | Medium term (2-4 years) |
| Sustainability pressures from model energy use | -1.90% | Global, regulatory focus in EU and California | Long term (≥ 4 years) |
| Vendor lock-in to proprietary model ecosystems | -1.40% | Global, concentrated in enterprise segments | Medium term (2-4 years) |
| Source: Mordor Intelligence | |||
Data-privacy and compliance complexity
The EU AI Act, effective August 2024, mandates cybersecurity and incident reporting for high-risk systems. NIST’s January 2025 draft on dual-use foundation models extends oversight in the United States. These rules raise compliance costs, particularly for small firms, potentially slowing new entrants into the augmented intelligence industry.
Acute shortage of AI/ML talent
RAND projects sustained gaps in qualified professionals despite upskilling initiatives. IEEE’s 2024 survey shows developers, ethicists, and data analysts are simultaneously in short supply. Competitive salaries inflate project costs and lengthen time-to-value, tempering the augmented intelligence market’s growth trajectory.
*Our forecasts treat driver/restraint impacts as directional, not additive. The impact forecasts reflect baseline growth, mix effects, and variable interactions.
Segment Analysis
By Component: Software Dominance Drives Platform Consolidation
Software generated 54.40% of 2024 revenue, reflecting corporate preference for integrated suites—such as Microsoft’s Azure OpenAI and Adobe’s Firefly that streamline development cycles. At the same time, service engagements are growing 24.45% annually as companies seek guidance on data architecture and ethical governance. This dichotomy indicates that software licenses alone rarely deliver value; customers often require advisory support for change management and model monitoring.
Consulting-heavy implementation work fuels premium billing rates, underpinning the fastest segment CAGR. C3.ai’s shift toward consumption pricing exemplifies vendor adaptation to enterprise expectations for outcome-based models. Meanwhile, commoditization of hardware via cloud instances caps physical infrastructure revenue, encouraging suppliers to bundle silicon with higher-margin platforms.


By Technology: Machine Learning Foundations Enable Advanced Applications
Machine learning retained 29.53% of 2024 spending, providing the statistical backbone for more advanced disciplines. Natural language processing, projected to grow 25.25% annually, benefits from soaring adoption of conversational agents in customer service and document automation. Generative AI now drives incremental demand for GPUs, pushing NVIDIA’s FY25 sales to USD 130.5 billion, up 114% year on year.[3]NVIDIA Corporation, “FY 2025 10-K,” sec.gov The augmented intelligence market size linked to foundation models is therefore expanding in tandem with silicon advances.
Edge-ready CPUs such as Intel’s Core-Ultra, which integrate neural engines, illustrate hardware convergence trends. Cross-domain models like Google’s Gemini can process text, images, and code in one pipeline, enabling richer insights that propel long-term platform stickiness.
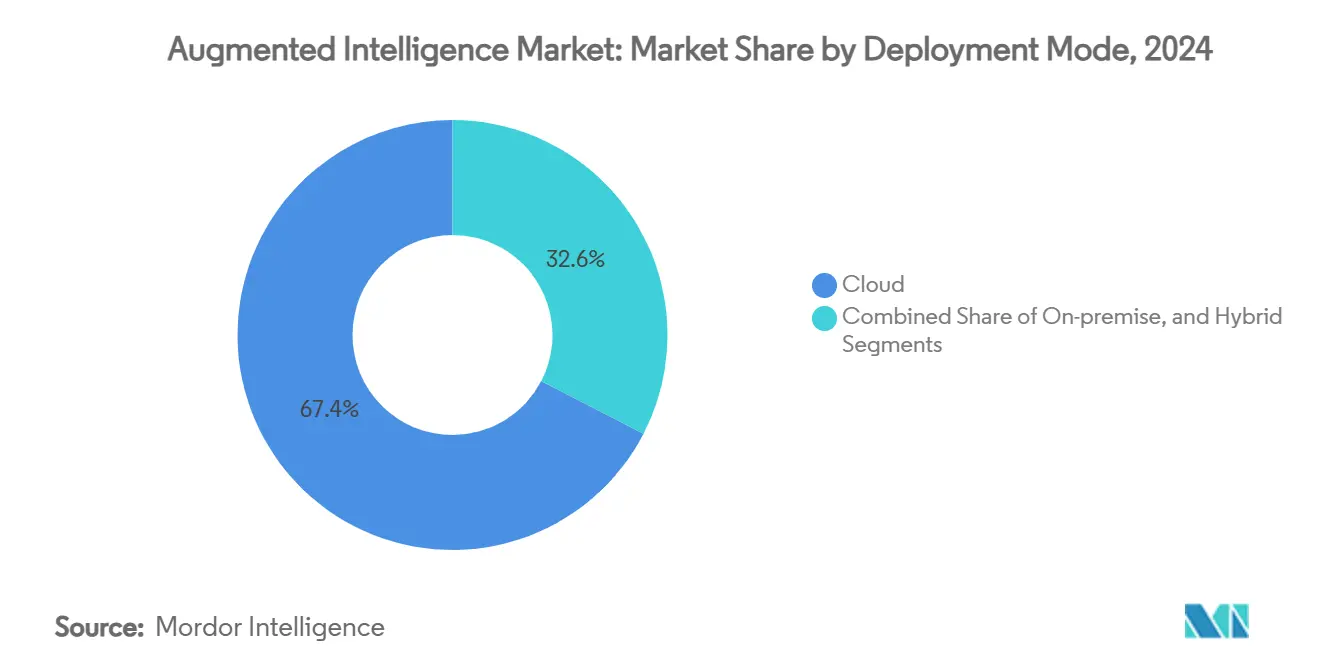
By Deployment Mode: Hybrid Architectures Balance Performance and Compliance
Cloud accounted for 67.41% of 2024 revenue, but hybrid setups are scaling fastest at 25.85% CAGR as firms split workloads across public clouds, private clusters, and on-site GPUs. Oracle’s multicloud pact with AWS typifies such interoperability. IDC expects 75% of enterprise AI jobs to run in hybrid form by 2028.
For regulated sectors, on-premise clusters persist, but edge nodes and data-sovereign regions inside global clouds mitigate compliance hurdles, broadening the augmented intelligence market. The hybrid trend dovetails with energy-efficiency mandates; dynamic workload orchestration lets firms route inference tasks to greener grids or lower-carbon data centers, addressing sustainability restraints outlined by ACEEE..
By Organization Size: SME Acceleration Signals Democratization
Large enterprises held 65.45% of 2024 expenditure owing to budget depth and in-house data teams. Yet SMEs are forecast to grow 26.40% annually, lifted by subscription pricing and low-code design. Salesforce Customer 360 bundles predictive insights with CRM, letting mid-tier firms deploy AI without owning infrastructure. The augmented intelligence market size for SMEs is therefore poised to outpace overall industry growth through 2030.
Regulatory bodies underscore the need for inclusive policies, and the Consumer Technology Association argues for uniform compliance frameworks to prevent smaller companies from falling behind. Venture capital channeled USD 21.3 billion into generative AI in 2023, much of it aimed at tools that lower technical barriers for start-ups, fuelling the segment’s momentum.
By End-user Industry: BFSI Leadership Faces Retail Disruption
BFSI contributed 18.45% of 2024 outlays, using AI for fraud analytics and credit scoring. Retail and e-commerce, however, will see the swiftest ascent at 26.45% CAGR as firms deploy recommendation engines and real-time inventory analytics. Healthcare is adopting clinical-decision models an MDPI study on AI in kidney care underscores accuracy gains in diagnosis. Government agencies worldwide are budgeting for AI to streamline citizen services, reinforcing public-sector demand.
Energy and Utilities sectors explore AI applications for grid management and renewable energy optimization, supported by Department of Energy initiatives promoting AI-accelerated power grid models, U.S. Department of Energy. Transportation and Logistics industries adopt AI for route optimization and autonomous vehicle development, though regulatory constraints limit deployment velocity.
Geography Analysis
North America controlled 41.48% of 2024 spending, anchored by the United States’ hyperscale cloud cluster and cumulative venture investment. Microsoft alone plans roughly USD 75 billion in capital outlays during 2025 to deepen AI capacity. Federal requests for USD 1.9 billion in AI R&D attest to policy commitment. Canada and Mexico enhance regional breadth through cross-border data corridors and fintech sandboxes.
Europe follows with steady, policy-backed adoption. The European Commission’s AI Continent Action Plan earmarks EUR 200 billion for infrastructure, setting the stage for catch-up growth. Only 8% of firms currently deploy AI, so lifting the average will materially enlarge the augmented intelligence market. The United Kingdom’s sector value exceeded USD 21 billion in 2024 and could top USD 1 trillion by 2035, despite post-Brexit regulatory divergence EUROPARL.
Asia-Pacific is the fastest mover at 25.40% CAGR. China’s AI push, Japan’s robotics leadership, and India’s low-cost coding talent create a diversified demand base. Generative AI could add EUR 100 billion to Central and Eastern European GDP each year over a decade, reflecting spill-over into adjacent regions. Australia, the Gulf and Africa round out the global picture with smart-city and resource-optimization pilots, although infrastructure limitations curb immediate revenue.

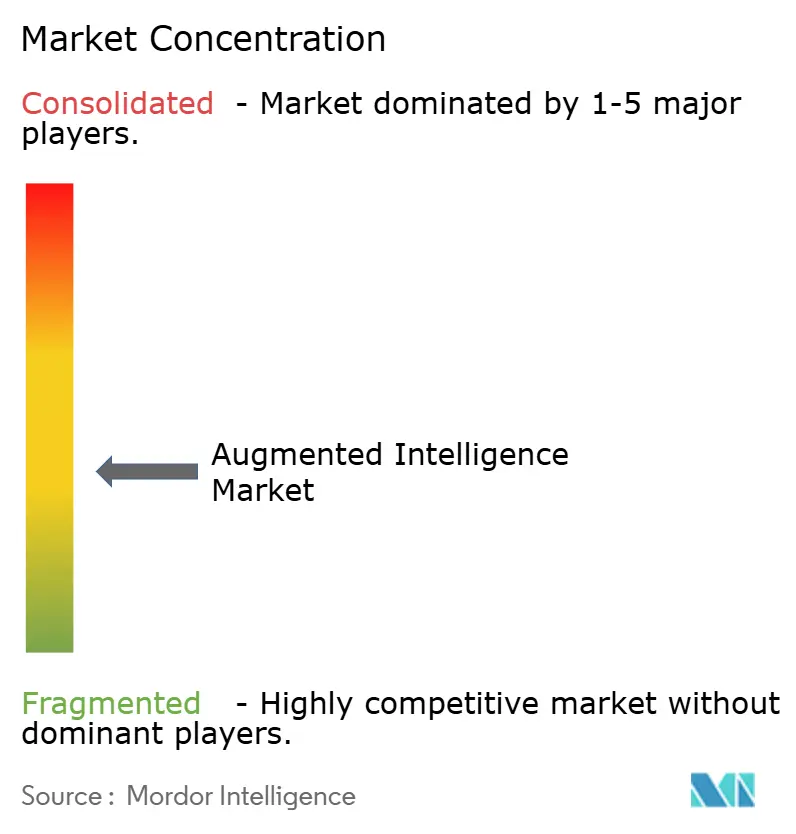
Competitive Landscape
Industry concentration is moderate. Roughly 5,500 AI start-ups have launched in the United States since 2013, but hyperscale clouds still shape platform standards. Microsoft’s USD 13.75 billion, Amazon’s USD 8 billion, and Google’s USD 2.55 billion stakes in foundation-model developers illustrate capital intensity.
RAND argues foundation models carry natural-monopoly traits because of sunk costs and data moats, although the current social cost remains low. Still, vertical specialists find room to differentiate. Palantir’s U.S. commercial revenue jumped 54% to USD 702 million in 2024 by focusing on analytics for defense and heavy industry.
Open-source stacks offer cost-effective entry points, but production-grade success still demands fine-tuning, safety tooling, and governance, disciplines that favor well-capitalized players. M&A is set to rise as incumbents scoop niche models to plug domain gaps, thereby consolidating the augmented intelligence market.
Augmented Intelligence Industry Leaders
International Business Machines Corporation
Microsoft Corporation
Alphabet Inc.
Amazon Web Services, Inc.
Salesforce, Inc.
- *Disclaimer: Major Players sorted in no particular order

Recent Industry Developments
- January 2025: The Federal Trade Commission detailed cloud–AI developer partnerships, highlighting mega-investments by Microsoft, Amazon, and Google.
- January 2025: NVIDIA posted USD 130.5 billion FY25 revenue, a 114% surge supported by datacenter.
- December 2024: Salesforce revenue hit USD 9.44 billion in Q3 FY25, fueled by Agentforce AI.
- December 2024: The U.S. Department of Homeland Security spotlighted risks from adversarial generative AI.
- October 2024: Alphabet’s Google Cloud revenue reached USD 11.4 billion, up 35% year on year.


Global Augmented Intelligence Market Report Scope
| Software |
| Services |
| Hardware |
| Machine Learning |
| Natural Language Processing |
| Computer Vision |
| Deep Learning |
| Generative AI |
| Cloud |
| On-premise |
| Hybrid |
| Large Enterprises |
| Small and Medium Enterprises |
| BFSI |
| Healthcare and Life Sciences |
| Retail and E-commerce |
| Manufacturing |
| Telecom and IT |
| Government and Defense |
| Energy and Utilities |
| Transportation and Logistics |
| North America | United States | |
| Canada | ||
| Mexico | ||
| South America | Brazil | |
| Argentina | ||
| Rest of South America | ||
| Europe | Germany | |
| United Kingdom | ||
| France | ||
| Italy | ||
| Spain | ||
| Russia | ||
| Rest of Europe | ||
| Asia-Pacific | China | |
| Japan | ||
| South Korea | ||
| India | ||
| Australia and New Zealand | ||
| Rest of Asia-Pacific | ||
| Middle East and Africa | Middle East | Saudi Arabia |
| United Arab Emirates | ||
| Turkey | ||
| Rest of Middle East | ||
| Africa | South Africa | |
| Rest of Africa | ||
| By Component | Software | ||
| Services | |||
| Hardware | |||
| By Technology | Machine Learning | ||
| Natural Language Processing | |||
| Computer Vision | |||
| Deep Learning | |||
| Generative AI | |||
| By Deployment Mode | Cloud | ||
| On-premise | |||
| Hybrid | |||
| By Organization Size | Large Enterprises | ||
| Small and Medium Enterprises | |||
| By End-user Industry | BFSI | ||
| Healthcare and Life Sciences | |||
| Retail and E-commerce | |||
| Manufacturing | |||
| Telecom and IT | |||
| Government and Defense | |||
| Energy and Utilities | |||
| Transportation and Logistics | |||
| By Geography | North America | United States | |
| Canada | |||
| Mexico | |||
| South America | Brazil | ||
| Argentina | |||
| Rest of South America | |||
| Europe | Germany | ||
| United Kingdom | |||
| France | |||
| Italy | |||
| Spain | |||
| Russia | |||
| Rest of Europe | |||
| Asia-Pacific | China | ||
| Japan | |||
| South Korea | |||
| India | |||
| Australia and New Zealand | |||
| Rest of Asia-Pacific | |||
| Middle East and Africa | Middle East | Saudi Arabia | |
| United Arab Emirates | |||
| Turkey | |||
| Rest of Middle East | |||
| Africa | South Africa | ||
| Rest of Africa | |||


Key Questions Answered in the Report
What is the global value of the augmented intelligence market in 2025?
The augmented intelligence market size equals USD 41.87 billion in 2025.
How fast will augmented intelligence spending grow by 2030?
Aggregate revenue is projected to increase at a 23.17% CAGR to reach USD 118.72 billion by 2030.
Which region is expanding the quickest?
Asia-Pacific leads with a forecast 25.40% CAGR through 2030, driven by manufacturing digitalization and mobile-first adoption.
Which deployment model shows the highest growth rate?
Hybrid architectures are projected to grow at 25.85% CAGR as firms balance latency, cost and data sovereignty.
How are SMEs influencing demand?
Small and medium enterprises are expected to post 26.40% annual growth thanks to low-code tools and subscription-based AI services.
Page last updated on:


