
Technology, Media and Telecom
5th MayPricing Strategy for Semiconductor Components
3 Min Read
The Augmented Reality and Mixed Reality Market Report is Segmented by Component (Hardware, Software, and Services), Device Type (Stand-Alone Head-Mounted Display [HMD], Tethered/Console-linked HMD, and More), End-User Industry (Gaming and Entertainment, Healthcare, Education and Training, Retail and E-Commerce, and More), Application (Remote Collaboration and Assistance, Design and Visualization, and More), and Geography.
Market Overview
| Study Period | 2019 - 2030 |
|---|---|
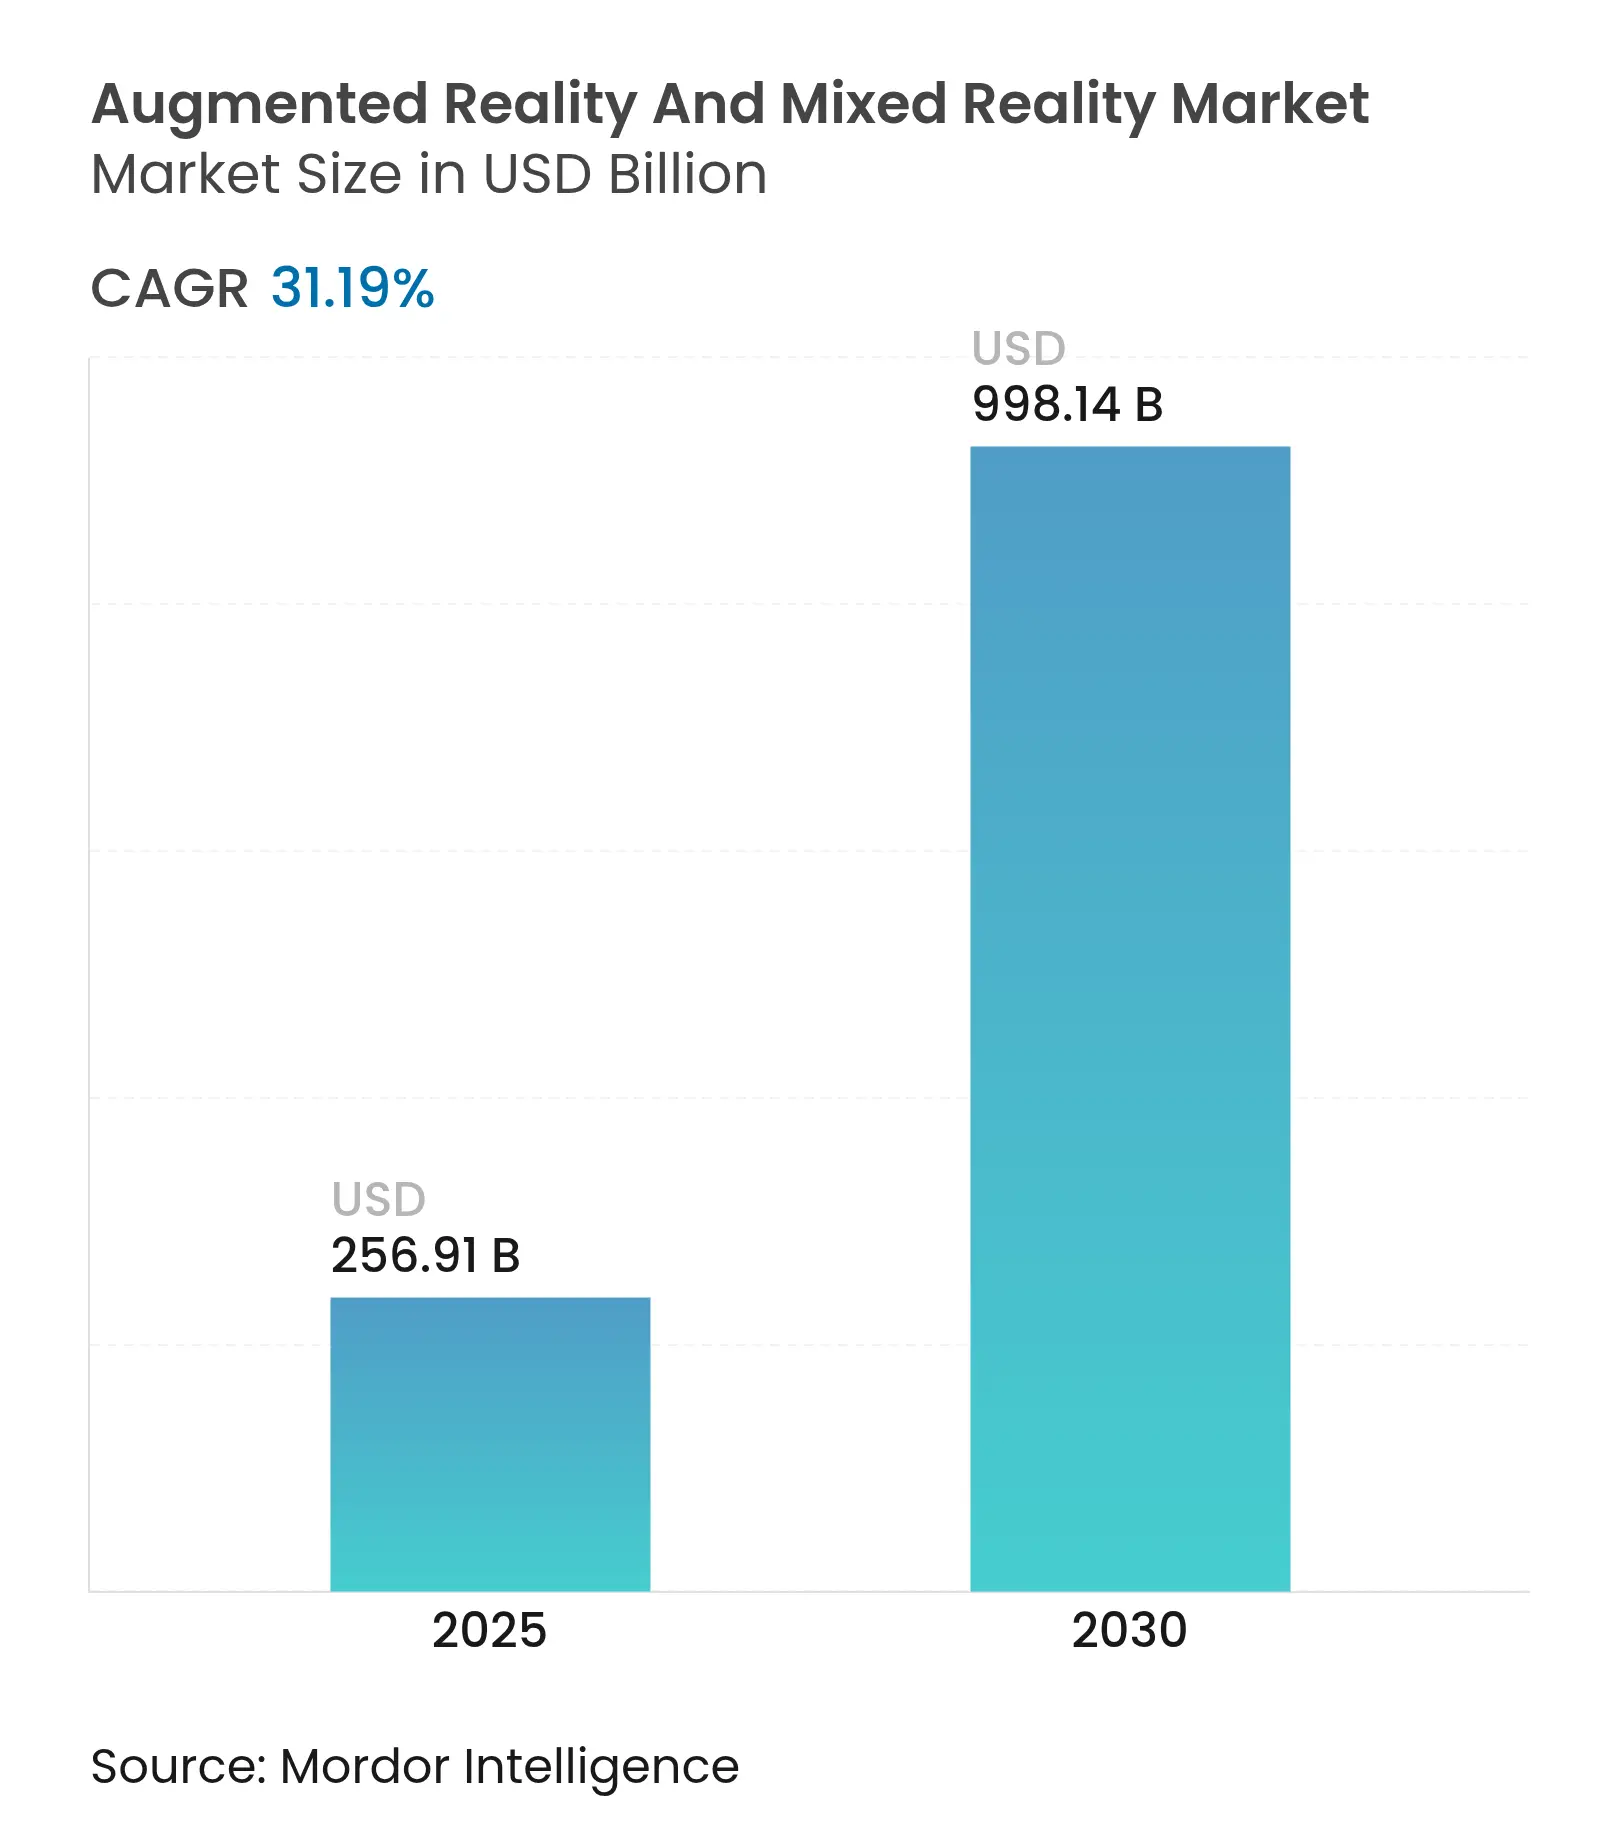
| Market Size (2025) | USD 256.91 Billion |
| Market Size (2030) | USD 998.14 Billion |
| Growth Rate (2025 - 2030) | 31.19 % CAGR |
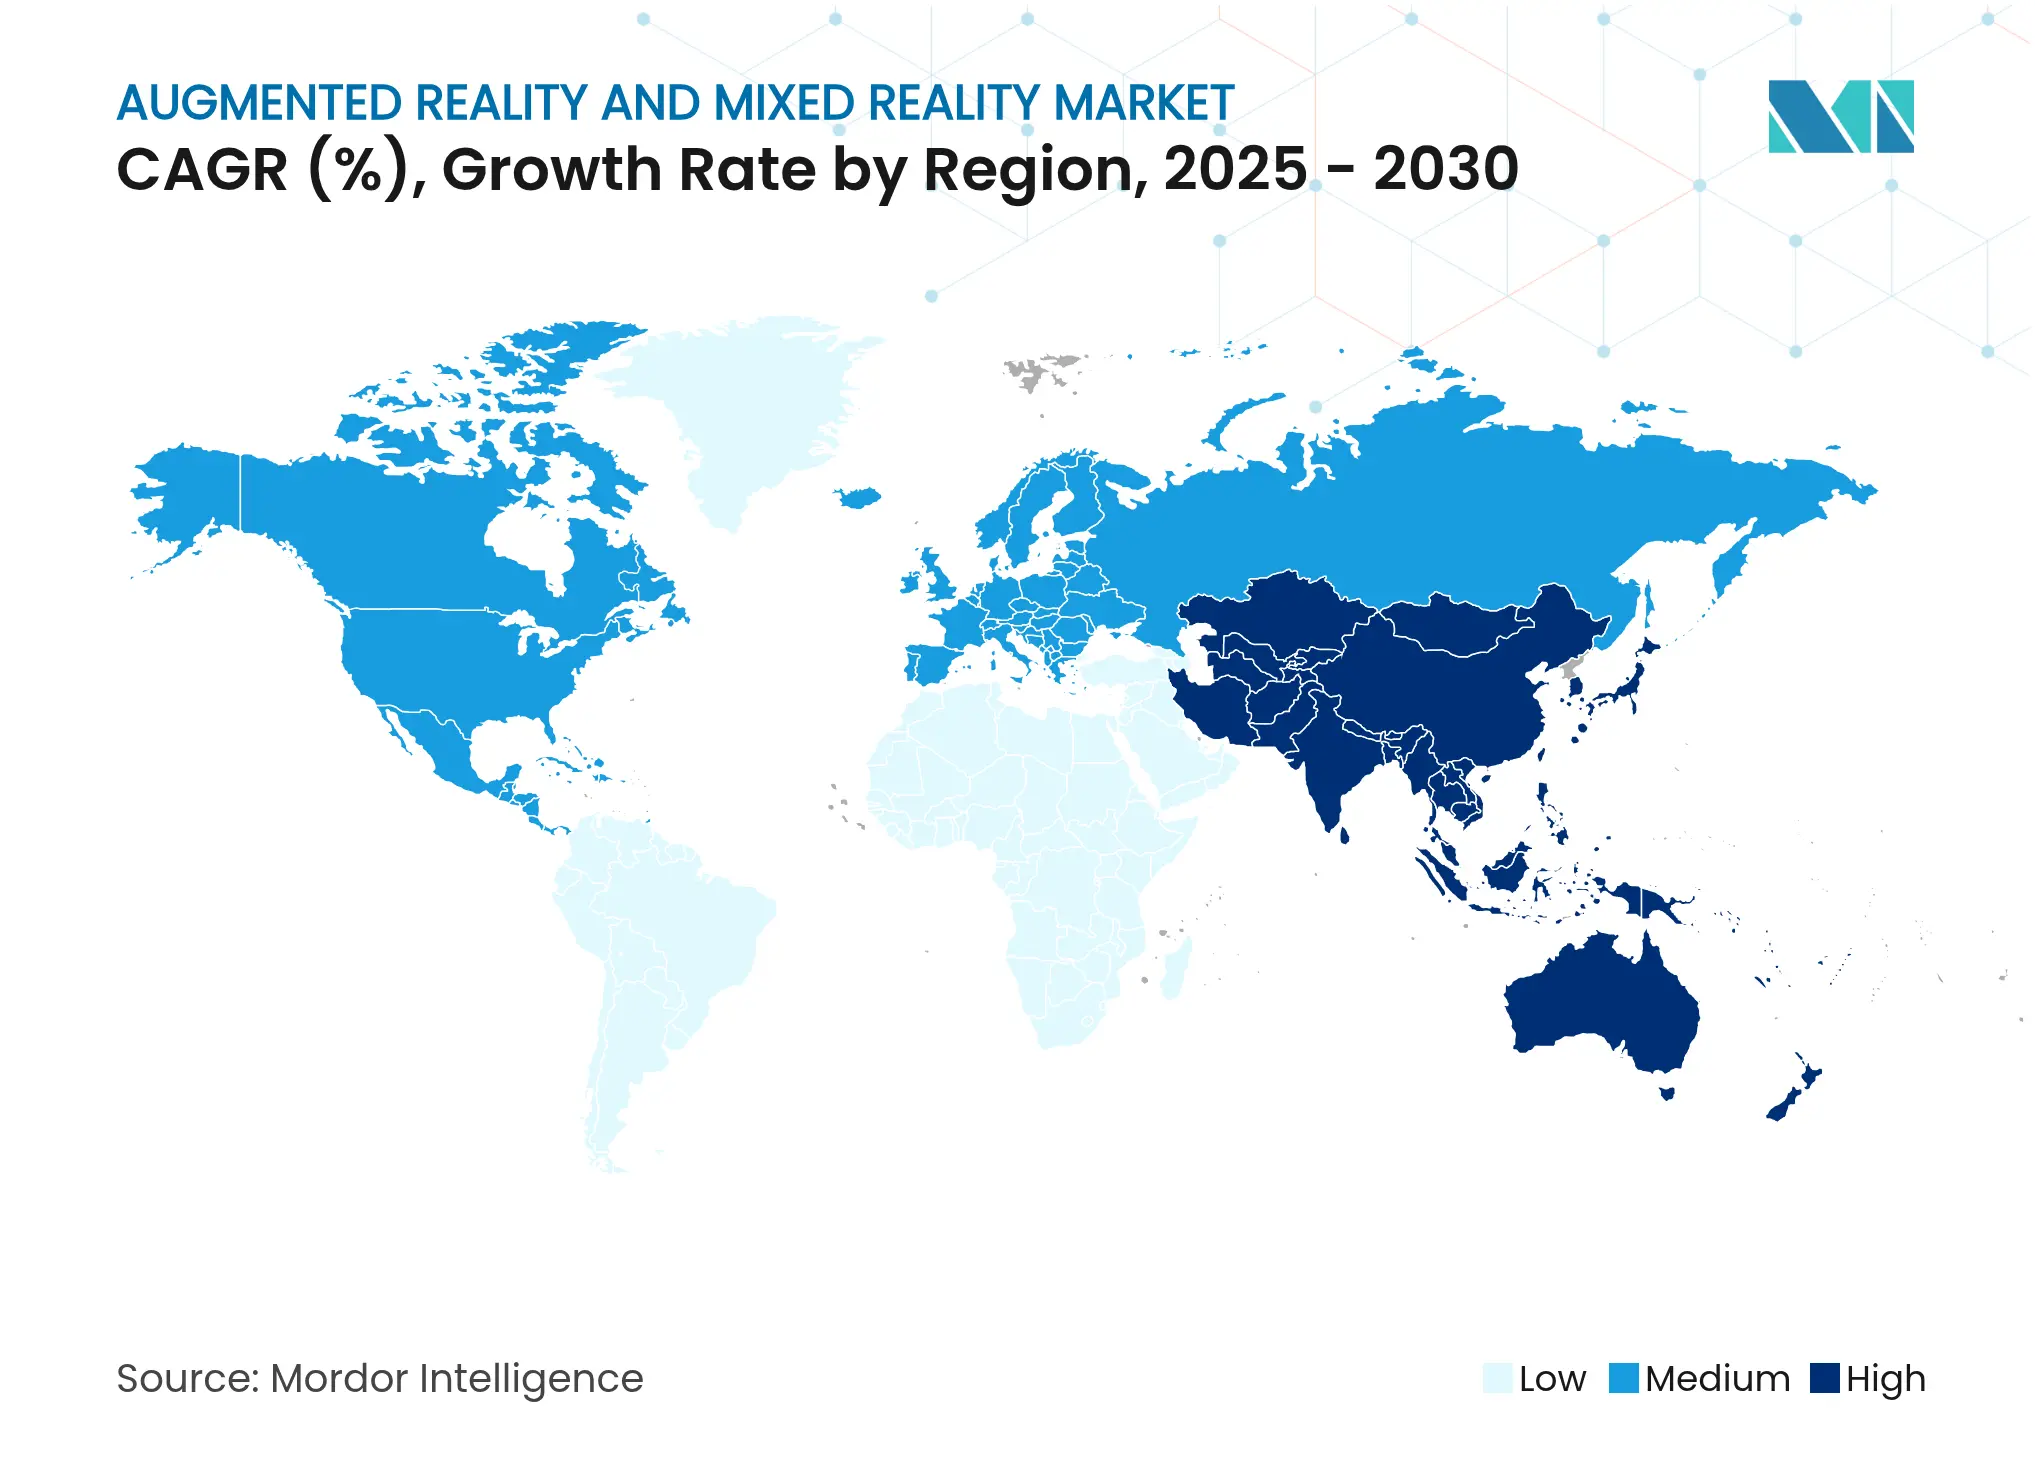
| Fastest Growing Market | Asia Pacific |
| Largest Market | North America |
| Market Concentration | Medium |
Major Players*Disclaimer: Major Players sorted in no particular order. Image © Mordor Intelligence. Reuse requires attribution under CC BY 4.0. |
Commercial deployment of 5G networks, sustained enterprise digital-transformation budgets, and rapid cost erosion in micro-OLED and waveguide displays are converting spatial-computing pilots into scaled roll-outs. Enterprises report measurable efficiency gains; for example, Mars Petcare cut coaching travel costs by 35% after pairing RealWear HMT-1 wearables with Microsoft Teams. Competitive momentum intensifies as Meta absorbs multi-year Reality Labs losses, Apple positions Vision Pro for premium spatial-computing, and a Samsung–Google–Qualcomm alliance races to a 2025 Android XR launch. The augmented reality and mixed reality market now sits at the intersection of hardware innovation, AI-assisted 3D content pipelines, and managed-services growth that encourages recurring-revenue models.
Key Report Takeaways
Note: Market size and forecast figures in this report are generated using Mordor Intelligence's proprietary estimation framework, updated with the latest available data and insights as of 2026.
Drivers Impact Analysis
| Driver | (~) % Impact on CAGR Forecast | Geographic Relevance | Impact Timeline | |||
|---|---|---|---|---|---|---|
5G and edge-enabled low-latency experiences 5G and edge-enabled low-latency experiences | +6.20% | Global with early gains in North America, South Korea, and China | Medium term (2–4 years) | (~) % Impact on CAGR Forecast:+6.20% | Geographic Relevance:Global with early gains in North America, South Korea, and China | Impact Timeline:Medium term (2–4 years) |
Mobile-first AR adoption in gaming and retail Mobile-first AR adoption in gaming and retail | +5.80% | Global, strongest in APAC and North America | Short term (≤2 years) | |||
Enterprise demand for immersive training and remote support Enterprise demand for immersive training and remote support | +7.10% | North America & EU core, expanding to APAC | Medium term (2–4 years) | |||
Vision Pro-driven spatial-computing investment Vision Pro-driven spatial-computing investment | +4.30% | North America & EU | Short term (≤2 years) | |||
Micro-OLED/OLEDoS cost breakthroughs Micro-OLED/OLEDoS cost breakthroughs | +5.9% | Global manufacturing in APAC | Long term (≥4 years) | |||
Generative-AI 3D content automation Generative-AI 3D content automation | +4.7% | Global, early in North America & EU | Medium term (2–4 years) | |||
| Source: Mordor Intelligence | ||||||
5G and Edge-enabled Low-latency Experiences
Telcos now deliver sub-20 ms latency, enabling cloud-rendered visuals that lighten headsets and prolong battery life. Edge offloading lets lightweight glasses handle feature-rich content without thermal overload. Qualcomm’s distributed compute patents allow devices to switch seamlessly between local and remote processing, matching power needs to network conditions. Multiplayer mixed-reality games now require up to 50 Mbps per player, pushing operators toward AR-specific service tiers. Time-sensitive industrial tasks such as remote equipment resets benefit from near-instant holographic guidance, unlocking new enterprise contracts for network providers.
Mobile-first AR Adoption in Gaming and Retail
Smartphone AR lowers entry barriers, evidenced by Pokémon GO surpassing USD 8 billion lifetime revenue. Retailers leverage virtual try-ons; Sephora’s facial-recognition-enabled Virtual Artist drives higher cart conversion while lowering return rates. IKEA’s Place app lets buyers assess furniture fit in actual rooms, reducing size-related returns. Google broadened AR beauty try-ons to mobile browsers, lifting interaction rates for 50+ brands by 10%. The mobile channel nurtures user familiarity that later transitions to headset adoption, reinforcing the augmented reality and mixed reality market’s funnel from phones to wearables.
Enterprise Demand for Immersive Training and Remote Support
Corporations measure higher knowledge retention and lower travel expenses with immersive training. ZEISS reported 90% retention using VR modules versus 20% via video. Johns Hopkins nurses practice critical decisions in VR, and Massachusetts General surgeons use PrecisionOS simulations that reduce complications. Renault Trucks cut downtime using Librestream Onsight overlays that connect field technicians to experts in real time. Microsoft HoloLens 2 pairs with Azure AI to adapt workflows to individual operators, slashing task errors in Industry 4.0 lines. These concrete outcomes justify budget shifts from conventional training to spatial-computing platforms.
Vision Pro-driven Spatial-computing Investment
Apple’s USD 3,499 headset spurred half of Fortune 100 firms to launch pilots across aircraft-design, operating-room displays, and collaborative engineering. Micro-OLED procurement from Samsung and LG indicates preparation for lower-priced variants that preserve 1,700 ppi density. Mobile Device Management capability enables zero-trust deployment, essential for regulated verticals. Competitors respond: Samsung and Google previewed transparent Android XR glasses slated for 2025, while Meta accelerates Orion prototype featuring 70-degree FOV silicon-carbide waveguides. Investor capital now flows into accessories, content studios, and middleware that extend Vision Pro use cases beyond early adopters.
Restraints Impact Analysis
| Restraint | (~) % Impact on CAGR Forecast | Geographic Relevance | Impact Timeline | |||
|---|---|---|---|---|---|---|
High upfront cost of professional HMDs High upfront cost of professional HMDs | -4.80% | Global, strongest in emerging markets | Short term (≤2 years) | (~) % Impact on CAGR Forecast:-4.80% | Geographic Relevance:Global, strongest in emerging markets | Impact Timeline:Short term (≤2 years) |
Privacy and data-security concerns Privacy and data-security concerns | -3.20% | EU & North America; spreading worldwide | Medium term (2–4 years) | |||
Inter-platform spatial standards gap Inter-platform spatial standards gap | -2.9% | Global | Long term (≥4 years) | |||
Waveguide and micro-OLED supply bottlenecks Waveguide and micro-OLED supply bottlenecks | -3.7% | Global; fabs in APAC | Medium term (2–4 years) | |||
| Source: Mordor Intelligence | ||||||
High Upfront Cost of Professional HMDs
Premium pricing restricts volume deployment. Apple Vision Pro’s tag surpasses USD 3,000, forcing firms to stage adoption in pilot waves. Sony trimmed PlayStation VR2 prices yet paused production after excess inventory underscored sensitivity to cost. HTC targets niche enterprise users willing to justify USD 999 Vive Focus Vision through ROI analytics. Meta’s cumulative Reality Labs losses signal the struggle to pair technological ambition with affordable consumer SKUs. Vendors focus on scale economies in optics and SoCs to cross critical pricing thresholds that unlock wider addressable markets.
Privacy and Data-Security Concerns
Smart glasses capture biometric, spatial, and gaze data, triggering GDPR scrutiny in Europe[1]European Data Protection Supervisor, “Opinion on Smart Glasses and Privacy,” edps.europa.eu. Studies find many mobile-AR users misunderstand camera-permission scope, eroding trust. Enterprise buyers demand end-to-end encryption and local data processing options before authorizing deployment. Regulators push for on-device redaction to mask bystanders, a capability already piloted by multiple chipset vendors. Clear disclosure and opt-in frameworks remain decisive factors in consumer uptake, particularly as mixed reality intersects with AI-driven analytics.
By Component: Services Acceleration Despite Hardware Dominance
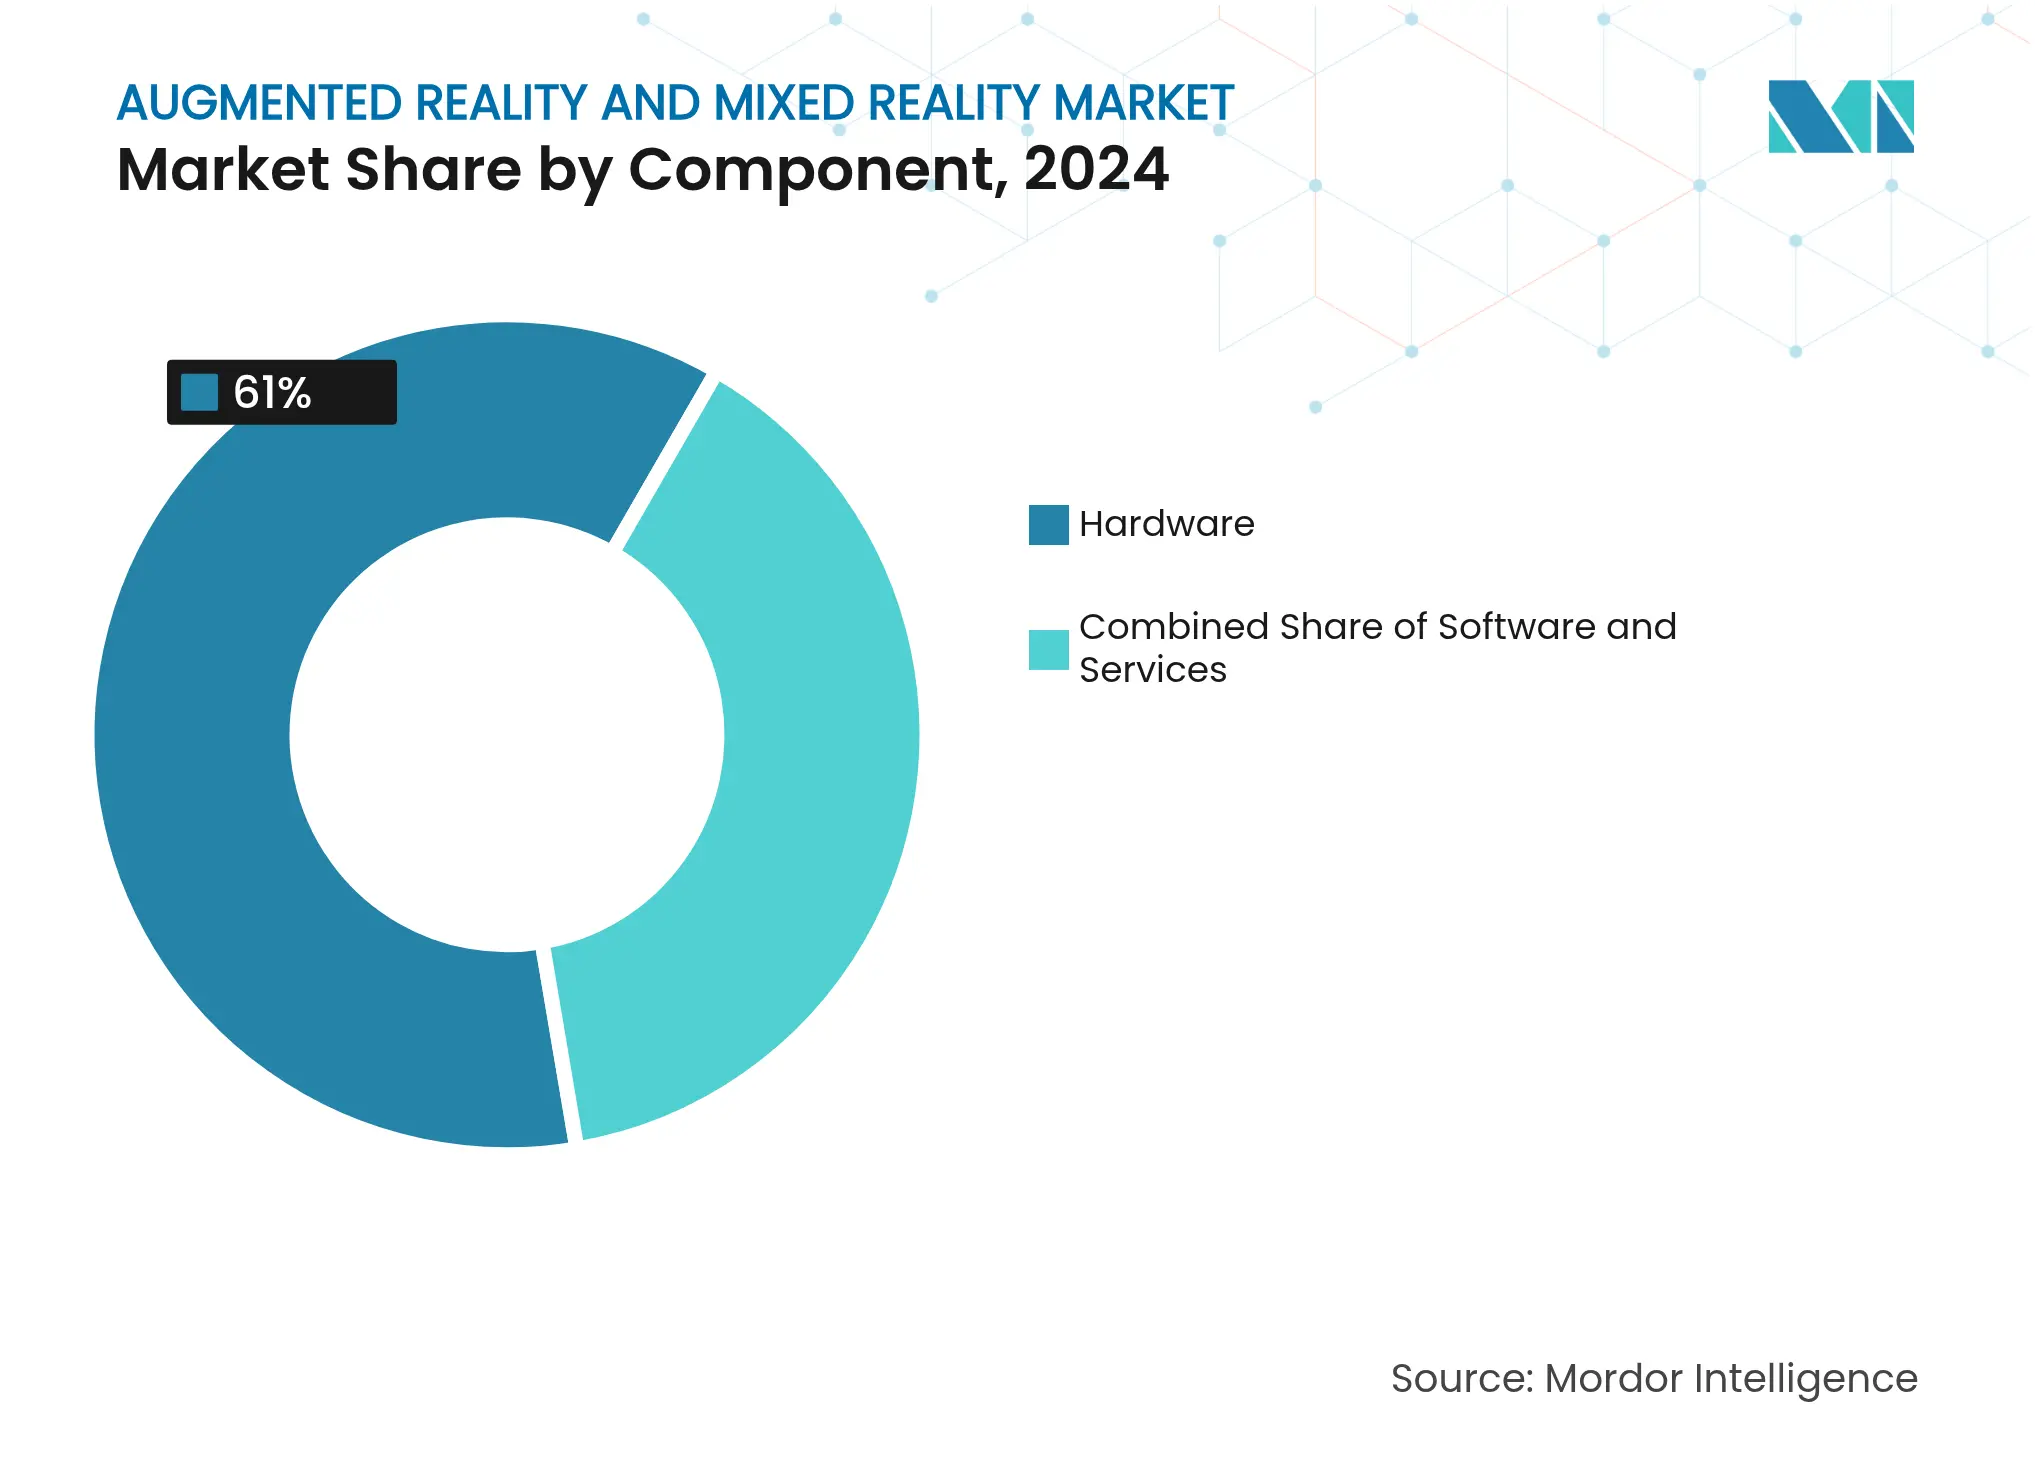
Hardware retained 61% of revenue in 2024 as premium headsets and optics remain capital-heavy. In monetary terms, the augmented reality and mixed reality market size for hardware approached USD 156 billion, reflecting continued enterprise spending on Vision Pro, Quest Pro, and HoloLens. Meanwhile, services posted the highest 32.5% CAGR, underlining migration to subscription-oriented support, content-authoring, and device-management offerings.
Growth in managed services mirrors cloud-software trajectories. ArborXR offers fleet-management subscriptions across multi-brand VR, reducing IT complexity for large roll-outs. System integrators bundle content libraries, analytics, and on-call troubleshooting into predictable OPEX, shifting cost discussions from hardware outlay to total-solution payback. As micro-OLED costs fall, hardware revenue may dilute proportionally, yet services will compound, keeping the augmented reality and mixed reality market on a recurring-revenue footing.
Note: Segment shares of all individual segments available upon report purchase
By Device Type: Smart Glasses Disruption Accelerates
Stand-alone HMDs commanded 48% of spend in 2024, equivalent to nearly half of the augmented reality and mixed reality market size for devices. However, smart glasses are forecast at a 33% CAGR as waveguide miniaturization moves products toward everyday eyewear weight. Industry prototypes such as Meta Orion deliver 70-degree FOV while meeting under-85-gram targets, a tipping point for day-long wearability.
Samsung–Google’s Project Moohan blends transparent displays with Gemini AI, focusing on heads-up information rather than full-occlusion immersion. Consumers gravitate to lighter form factors in social settings, while enterprises favor glasses for safety-helmet integration and line-of-sight workflows. As supply chains stabilize, the mix will pivot toward glasses, reshaping developer priorities and marketing narratives across the augmented reality and mixed reality market.
By End-user Industry: Healthcare Emerges as Growth Leader
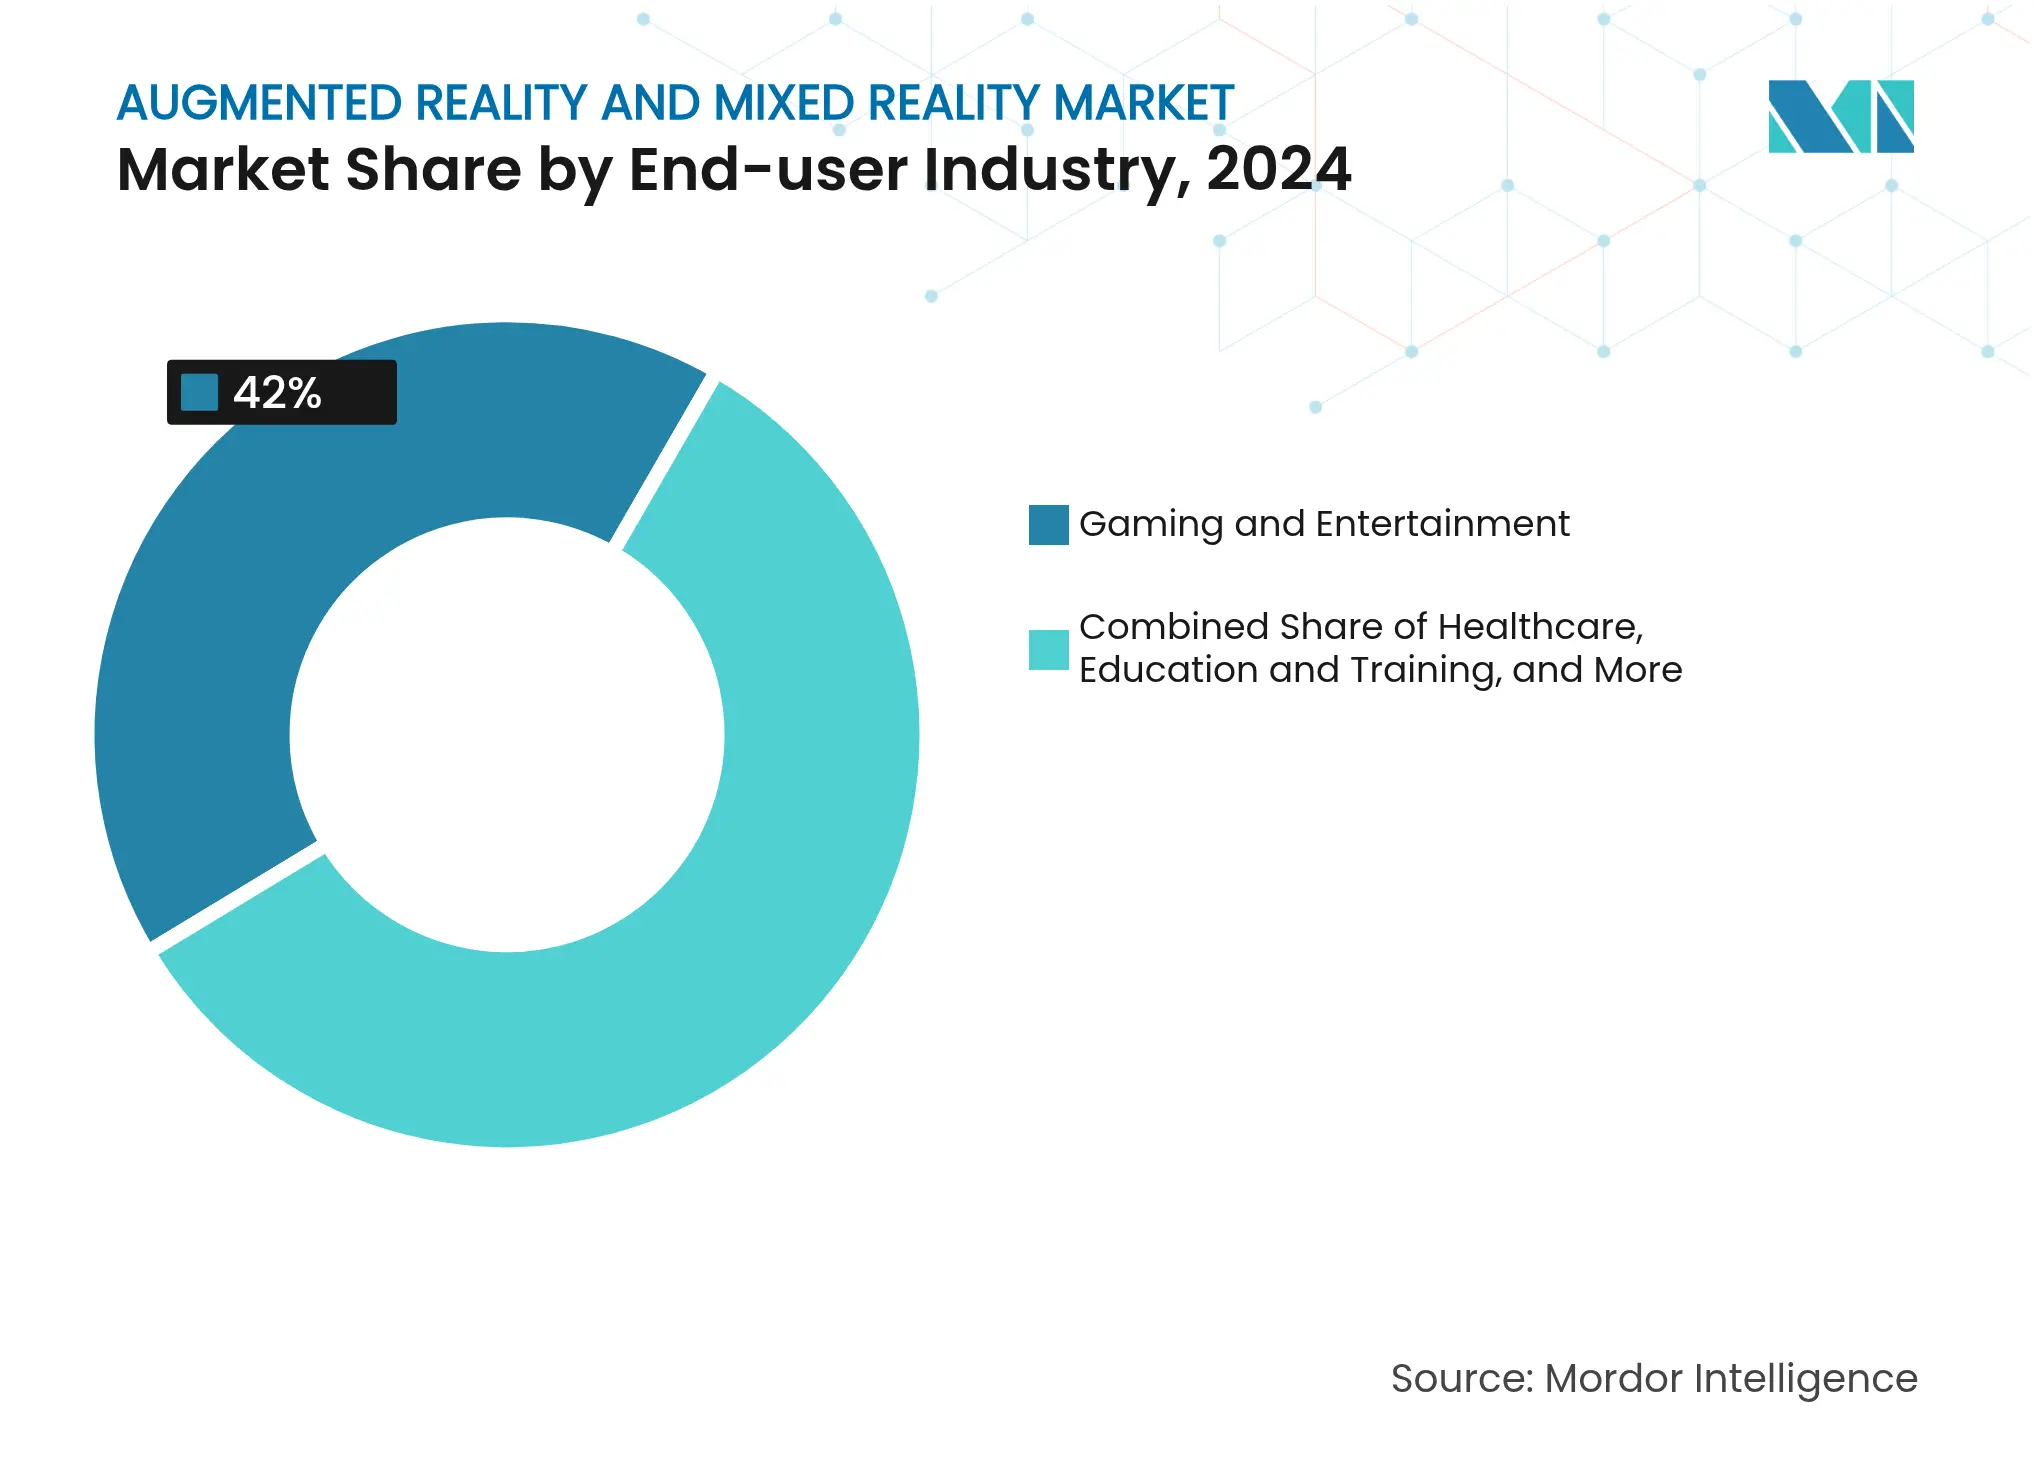
Gaming and entertainment retained 42% revenue in 2024, yet healthcare now holds the fastest 32.4% CAGR path. Hospitals integrate spatial computing into operating theaters. UC San Diego surgeons overlay 3D scans within vision-pro-enabled sterile fields, cutting physical strain and screen repositioning time.
Simulation modules for nursing and orthopedic training outperformed legacy methods on skill-retention metrics, driving budget reallocations. Industrial plants, automotive assembly lines, and defense training centers adopt similar immersive guidance, but healthcare’s combination of patient-outcome gains and reimbursement support positions it for sustained outperformance in the augmented reality and mixed reality market.
Note: Segment shares of all individual segments available upon report purchase
By Application: Remote Collaboration Dominance and Growth
Remote collaboration logged 28% of 2024 revenue and continues to top the growth chart at 31% CAGR. Corporate maintenance teams connect frontline staff to experts in real time; Mars Petcare’s 35% travel-cost saving validates the economic rationale[2]RealWear, “Mars Petcare Case Study,” realwear.com.
Design review, simulation, and marketing activations follow, yet distributed workflows across white- and blue-collar roles guarantee collaboration’s centrality. Vendors embed eye-contact correction and spatial-audio zoning to mimic co-presence, making mixed-reality meetings an accepted substitute rather than a novelty. Such maturation cements collaboration at the core of the augmented reality and mixed reality market.
North America continues to supply the bulk of platform software and venture capital. Early enterprise roll-outs confirmed ROI in logistics, field service, and healthcare, anchoring repeat orders despite macro uncertainty. Regulatory clarity on export controls and IP safeguards attracts overseas firms to form R&D centers in Silicon Valley and Seattle. Yet unit growth has slowed as first-wave adopters mature and procurement moves into replacement cycles.
Asia Pacific’s expansion outpaces the global average. Pro-innovation industrial policies and concentrated display manufacturing compress time-to-market for new optics. Telcos in South Korea and Japan monetize 5G-based XR subscriptions, fueling consumer awareness. Start-ups enjoy government grants that cover up to 50% of pilot costs, accelerating enterprise proof-of-concepts. Rising disposable income among middle-class consumers further elevates AR shopping and gaming uptake.
Europe balances opportunity with caution. Industrial companies leverage AR for predictive maintenance within established automation architectures, while healthcare systems pilot remote-surgery visualization. However, GDPR-driven consent workflows add development overhead. Firms that demonstrate privacy-by-design earn trust and win tenders across rail, energy, and defense. Subsidies from the Digital Europe Programme target cross-border standards alignment, aiming to lower fragmentation over the coming decade.
Market Concentration
Market rivalry spans integrated ecosystems and focused specialists. Apple leverages vertical control of silicon, OS, and services to command the premium tier. Meta’s open-price strategy targets social and gaming scale but requires long-run subsidy, as evidenced by USD 60 billion in Reality Labs losses since 2020[3]Meta Platforms, “Reality Labs Financial Results Q1 2025,” about.meta.com. Samsung-Google-Qualcomm combine optics, Android heritage, and Snapdragon silicon to court mid-tier consumers with transparent smart glasses.
Microsoft anchors enterprise deployments through HoloLens and Azure, bundling device management, identity, and cloud rendering. Qualcomm’s reference designs ensure chipset mindshare across second-tier OEMs. Optics start-ups specializing in silicon-carbide waveguides or pancake lenses attract strategic investment as incumbents hedge component roadmaps.
Competitive differentiation increasingly rests on AI-assisted developer tools, battery-efficiency breakthroughs, and cross-platform content portability. Partnerships between chipset vendors, lens suppliers, and content studios proliferate to hedge risk and accelerate roadmap delivery. The augmented reality & mixed reality market shows a moderate concentration, with the top five vendors holding an estimated 45% combined revenue share.

*Disclaimer: Major Players sorted in no particular order
1. INTRODUCTION
2. RESEARCH METHODOLOGY
3. EXECUTIVE SUMMARY
4. MARKET LANDSCAPE
5. MARKET SIZE AND GROWTH FORECASTS (VALUE)
6. COMPETITIVE LANDSCAPE
7. MARKET OPPORTUNITIES AND FUTURE OUTLOOK
Augmented reality does not take the user to the virtual world. It only enhances objects in the current world by superimposing virtual images. AR, thus, places virtual objects into an environment that exists in the real world. Mixed reality combines the aspects of the virtual world with those of the real world. It enables users to interact with the two worlds. Unlike AR, virtual objects in MR are not just overlaid. Users can interact with them. It is the main feature that distinguishes MR from AR.
The Augmented Reality Market is segmented by type (hardware, software), end-user verticals (gaming, education, healthcare, retail & advertising, automotive, military & defense), and geography (North America, Europe, Asia-Pacific, rest of the World [Latin America, and Middle East & Africa]).
The Mixed Reality Market is segmented by end-user verticals (consumer, medical & healthcare, industrial) and geography (North America, Europe, Asia-Pacific, rest of the World [Latin America, and Middle East & Africa]). The market size and forecasts are provided in terms of value (USD) for all the above segments.
Pricing Strategy for Semiconductor Components
3 Min Read
Accelerating Additive Manufacturing Adoption in India
3 Min Read
Unlocking Saudi Arabia’s Regional Tourism Growth Potential
5 Min Read
When decisions matter, industry leaders turn to our analysts. Let’s talk.