Retrieval Augmented Generation Market Size and Share
Market Overview
| Study Period | 2019 - 2030 |
|---|---|
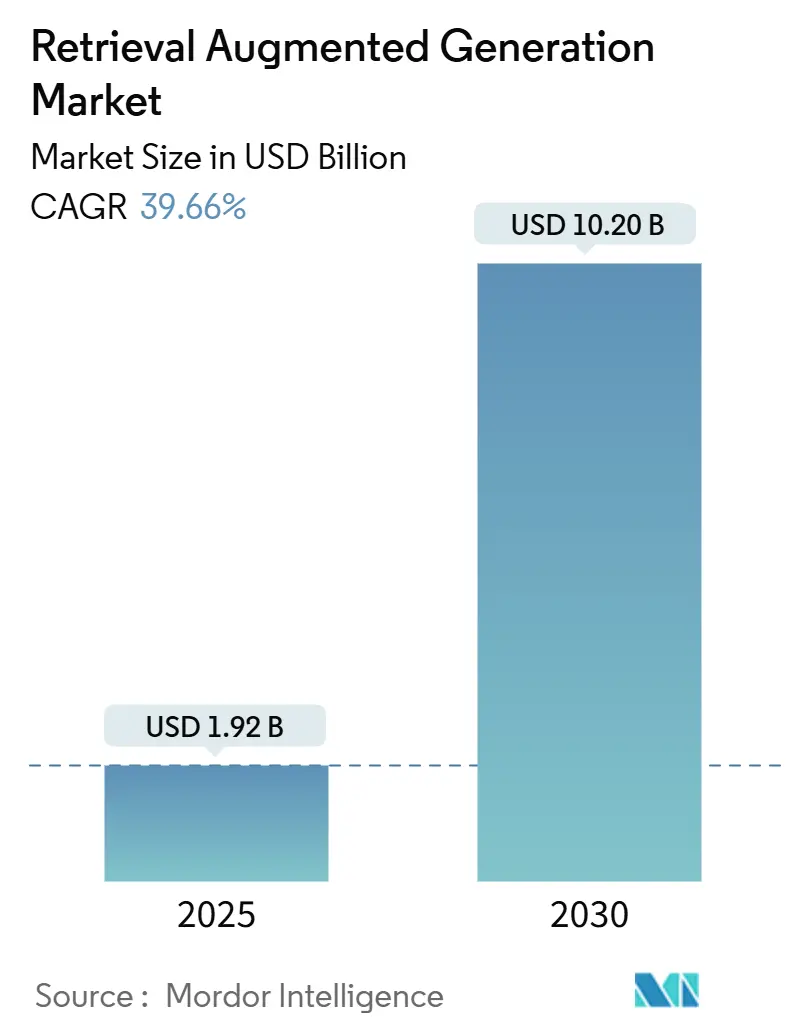
| Market Size (2025) | USD 1.92 Billion |
| Market Size (2030) | USD 10.20 Billion |
| Growth Rate (2025 - 2030) | 39.66% CAGR |
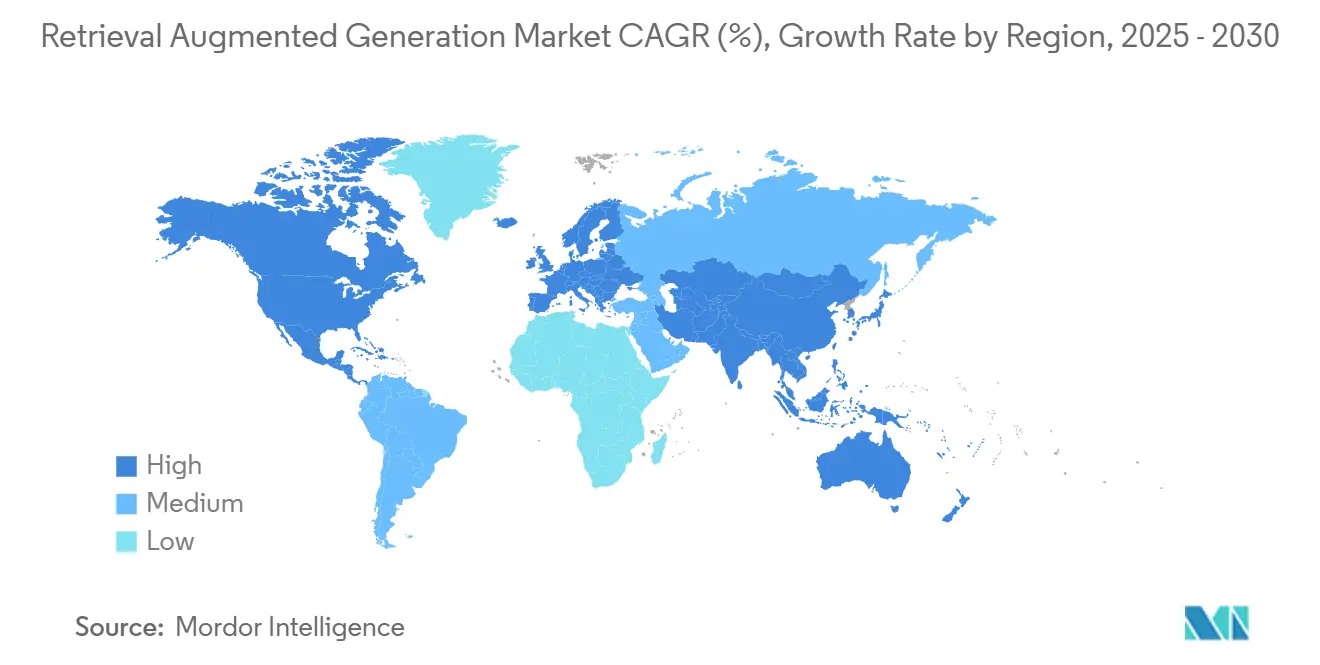
| Fastest Growing Market | Asia Pacific |
| Largest Market | North America |
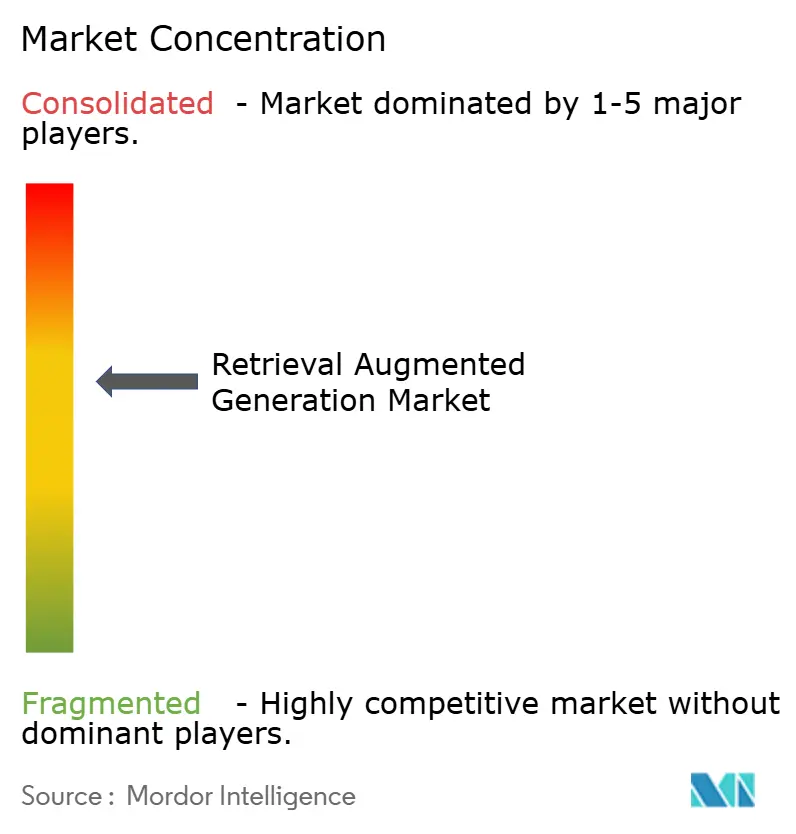
| Market Concentration | Medium |
Major Players *Disclaimer: Major Players sorted in no particular order Image © Mordor Intelligence. Reuse requires attribution under CC BY 4.0. | |
Retrieval Augmented Generation Market Analysis by Mordor Intelligence
The retrieval augmented generation market size reached USD 1.92 billion in 2025 and is forecast to climb to USD 10.2 billion by 2030, translating to a 39.66% CAGR over the forecast period. Expansive enterprise demand for factual, hallucination-free outputs, the availability of turnkey cloud infrastructure, and tightening regulatory requirements combine to propel growth. Organizations report measurable productivity gains that outweigh deployment costs, with Microsoft estimating USD 3.70 in value for every USD 1 invested in generative AI programs that embed retrieval pipelines [1]John Roach, “Microsoft Customers Report 3.7x ROI on Generative AI,” microsoft.com . Adoption accelerates as companies recognize that RAG architectures lower liability by grounding large language models in proprietary data. Cloud vendors widen access by bundling vector search services inside mainstream machine-learning platforms, while specialized database startups optimize latency and cost for at-scale similarity matching. Competitive intensity rises as incumbents race to deliver multimodal capabilities that operate across text, image, and audio corpora, and regulatory scrutiny cements transparent retrieval as a default architectural choice in highly regulated industries.
Key Report Takeaways
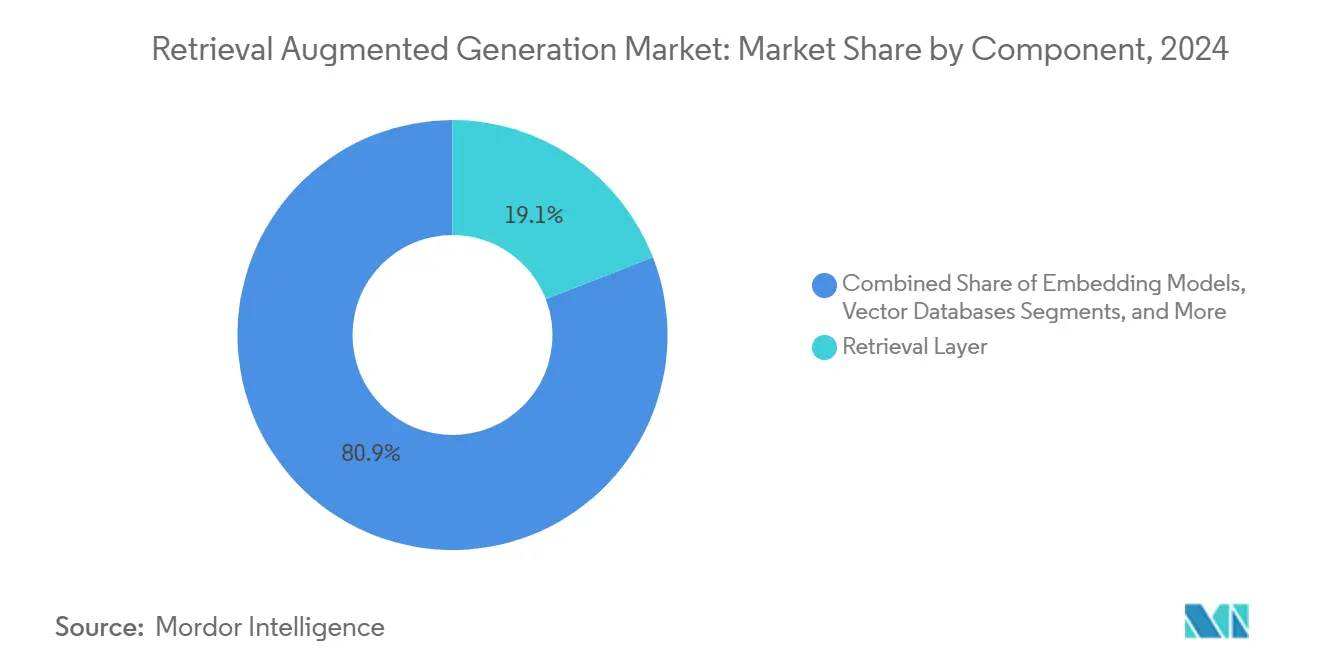
- By component, the retrieval layer accounted for 19.12% of the retrieval augmented generation market size in 2024; vector databases are poised to expand at a 40.02% CAGR through 2030.
- By deployment mode, cloud-based configurations held 75.24% of the retrieval augmented generation market share in 2024, and it is projected to advance at a 39.26% CAGR through 2030.
- By application, content generation and summarization led with a 22.11% share of the retrieval augmented generation market size in 2024, whereas code generation and DevOps are expected to record the fastest 41.56% CAGR to 2030.
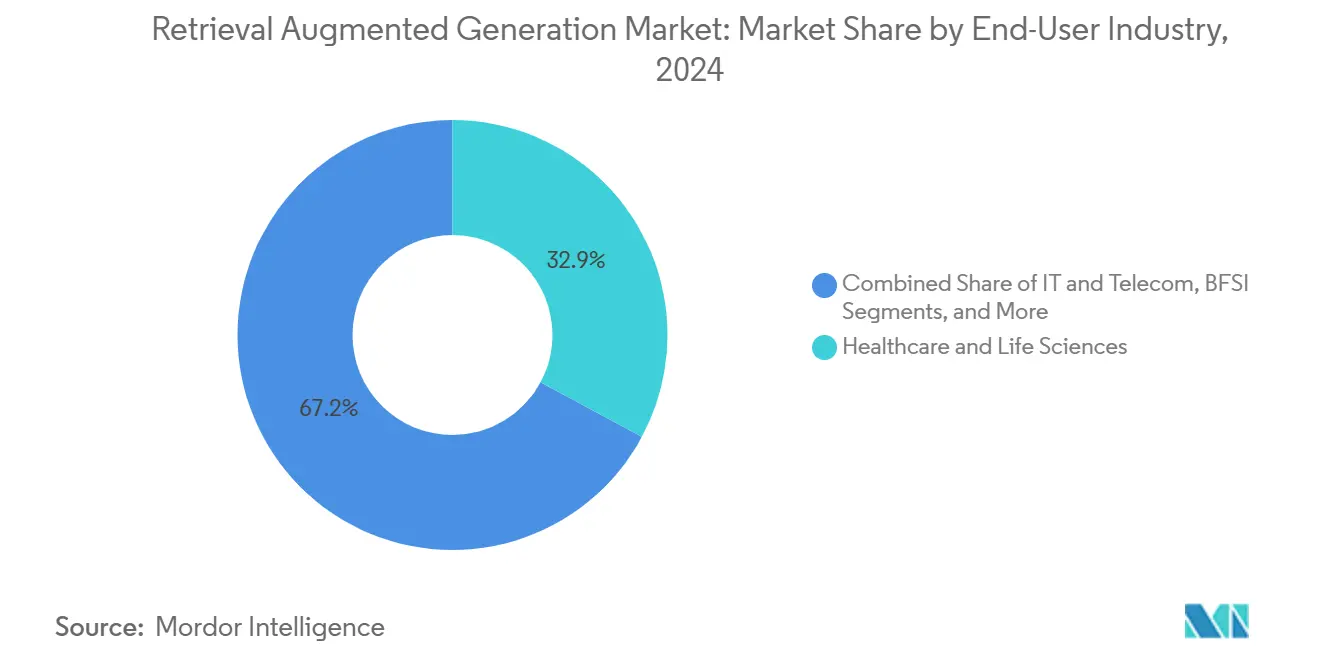
- By end-user industry, healthcare and life sciences commanded 32.85% of the retrieval augmented generation market share in 2024; retail and e-commerce are projected to achieve a 41.71% CAGR through 2030.
- By organization size, large enterprises retained a 71.45% share in 2024, although SMEs are forecast to advance at a 41.12% CAGR through 2030.
- By geography, North America held 38.15% of the retrieval augmented generation market share in 2024, while the Asia Pacific is forecast to grow at a 42.71% CAGR through 2030.
Global Retrieval Augmented Generation Market Trends and Insights
Drivers Impact Analysis*
| Driver | (~)% Impact on CAGR Forecast | Geographic Relevance | Impact Timeline |
|---|---|---|---|
| Explosion of enterprise-grade GenAI pilots needing factual answers | +12.5% | Global, with early concentration in North America and Europe | Short term (≤ 2 years) |
| Rising regulatory pressure to control hallucinations (EU AI Act, U.S. EO) | +8.3% | EU and North America primarily, spillover to APAC | Medium term (2-4 years) |
| Rapid cost decline of dense and sparse vector search infrastructure | +7.8% | Global, with accelerated adoption in cost-sensitive APAC markets | Short term (≤ 2 years) |
| Growing availability of domain-specific embeddings as off-the-shelf APIs | +6.2% | Global, led by North America and Europe | Medium term (2-4 years) |
| Shift from retrieval → "active" RAG with agentic planning | +4.9% | North America and Europe early adoption, APAC following | Long term (≥ 4 years) |
| CIO demand for RAG that natively supports unstructured video and audio chunks | +3.8% | Global, with enterprise focus in developed markets | Medium term (2-4 years) |
| Source: Mordor Intelligence | |||
Explosion of Enterprise-Grade GenAI Pilots Needing Factual Answers
Regulated industries discovered that hallucinations undermine trust in large language models, driving an enterprise pivot toward retrieval-augmented generation market solutions that can ground every answer in verifiable source material. Field studies record hallucination reductions between 70% and 90% when RAG pipelines are introduced, which validates the technology for mission-critical workflows [2]Makebot AI Research Team, “Enterprise RAG Benchmarks 2025,” makebot.ai. Financial institutions route regulatory interpretations through RAG layers so compliance officers can trace references to the exact policy clause. Hospitals embed peer-reviewed articles inside decision support dashboards so clinicians can confirm treatment guidelines at the point of care. Procurement teams adopt RAG chatbots that surface contract obligations with full text citations, which streamlines audit preparation. The same architectures now underpin internal knowledge bases, reducing employee search time and raising overall productivity.
Rising Regulatory Pressure to Control Hallucinations
Policy momentum turns RAG from an innovation optionality into a compliance necessity. Article 13 of the EU AI Act mandates explainability for any system classified as high risk, a standard that black-box generation fails to meet [3]European Union, “Regulation of the European Parliament and of the Council Laying Down Harmonized Rules on Artificial Intelligence,” eur-lex.europa.eu. In the United States, Executive Order 14110 instructs federal agencies to verify the reliability of AI models, prompting government contractors to implement retrieval layers that can reproduce source passages on request. Financial regulators in Canada and Singapore release similar interpretive guidance, which signals a global convergence toward transparency. Enterprises prefer platforms that embed audit logging, citation rendering, and redaction controls out of the box, because retrofitting governance later doubles integration costs. Vendors that certify compliance frameworks attract accelerated adoption in banking, healthcare, and defense.
Rapid Cost Decline of Vector Search Infrastructure
Cloud Hyperscalers reduced the unit price of embedding generation and similarity matching by an estimated 60% between 2023 and 2024, eliminating cost as a barrier to entry for mid-market firms. Pinecone launched serverless pricing at USD 0.096 per million operations, while open-source alternatives such as Qdrant and Chroma offer license-free runtimes for customers willing to self-host. Economies of scale in GPU provisioning and algorithmic efficiency gains in approximate nearest neighbor search lower inference latency, which extends the retrieval augmented generation market addressable base far beyond Fortune 500 early adopters. Cost elasticity also enables experimentation with larger context windows and multimodal embeddings that previously exceeded compute budgets.
Growing Availability of Domain-Specific Embeddings
Vendors now publish pretrained embedding models tailored for legal, medical, and financial language, available through simple APIs that circumvent the need for in-house model training. Cohere’s Command R+ supports 128k-token contexts and multilingual indexing, while startup SciPhi focuses on technical documentation with syntax-aware representations. These specialized vectors lift recall and precision in narrow knowledge domains where generic models misinterpret jargon. Enterprises stack multiple embedding spaces to cover heterogeneous data types, which improves retrieval granularity and reduces noise during generation. Third-party marketplaces ease procurement by handling billing and version control so that machine-learning teams can switch models with minimal integration overhead.
Restraints Impact Analysis*
| Restraint | (~)% Impact on CAGR Forecast | Geographic Relevance | Impact Timeline |
|---|---|---|---|
| Scarcity of RAG-savvy MLOps and prompt-engineering talent | -5.7% | Global, particularly acute in APAC and emerging markets | Medium term (2-4 years) |
| Latency penalties in multi-hop retrieval pipelines | -3.4% | Global, with higher impact in real-time applications | Short term (≤ 2 years) |
| Escalating copyright-licensing costs for proprietary corpora | -2.8% | North America and Europe primarily | Long term (≥ 4 years) |
| Emerging adversarial "prompt-injection" security exploits | -2.1% | Global, with heightened concern in security-sensitive sectors | Medium term (2-4 years) |
| Source: Mordor Intelligence | |||
Scarcity of RAG-Savvy MLOps and Prompt-Engineering Talent
Deploying a production-grade retrieval augmented generation market solution requires expertise that straddles information retrieval, model prompting, and continuous deployment engineering. Surveys indicate that fewer than 15% of machine-learning professionals possess hands-on RAG experience, and those who do concentrate in large technology hubs [4]IBM Data Science Blog, “Operationalizing RAG with watsonx.ai,” ibm.com. Competition for this limited talent favors incumbents that can pay premium salaries, leaving mid-size enterprises dependent on managed services. The shortage slows on-premises rollouts and lengthens proof-of-concept cycles. Universities respond with dedicated courses, yet curriculum supply lags enterprise demand. Vendors alleviate pain points by shipping opinionated templates and no-code orchestration tools, but skill scarcity remains a near-term drag on adoption velocity.
Escalating Copyright-Licensing Costs for Proprietary Corpora
High-quality, up-to-date content is non-negotiable for RAG relevance, pushing enterprises into negotiations with publishers that now realize their data’s strategic value. Reddit’s USD 60 million annual agreement with Google and Reuters’ USD 22 million in AI licensing revenue set new price anchors that ripple across the content ecosystem. Legal teams must forecast recurring fees instead of one-time training costs, adding financial uncertainty to long-term planning. Industries such as media, pharmaceuticals, and financial research face compound expenses because they ingest multiple gated datasets. Some firms explore synthetic data generation to offset fees, while others limit scope to public-domain or internally created materials, which constrains retrieval breadth and quality.
*Our forecasts treat driver/restraint impacts as directional, not additive. The impact forecasts reflect baseline growth, mix effects, and variable interactions.
Segment Analysis
By Component: Vector Databases Surge on Performance Gains
Vector databases captured growing mindshare as enterprises benchmarked billions of embeddings against legacy search engines. In 2024, the retrieval layer retained the largest 19.12% portion of the retrieval augmented generation market size due to its indispensable role in indexing and ranking. Yet vector platforms recorded a stellar 40.02% CAGR, outpacing every other layer. The surge reflects clear economic trade-offs. Purpose-built storage structures reduce memory footprint and cut millisecond-level latency, while integrated HNSW or IVF algorithms allow sub-second query times at scale. Open-source entrants accelerate innovation through community plug-ins that add metadata filtering and hybrid sparse-dense retrieval. Parallel progress in orchestration frameworks such as Langflow lets teams chain multiple databases for federated search without code refactoring, which reinforces the vector thesis. Meanwhile, embedding production and LLM generation continues to commoditize as cloud vendors embed these services into base plans. End-to-end RAG platforms cater to buyers who prefer single-vendor accountability, but they face pricing pressure as modular stacks prove cheaper for organizations with internal engineering capabilities.
Looking forward, procurement leaders weigh lock-in risk against convenience. Companies that anticipate multimodal expansion favor engines that already accommodate image and audio embeddings. Vendors race to add adaptive indexing, automatic rebalancing, and zero-downtime scaling, features considered table stakes by 2027. Intellectual-property clauses appear in more contracts, reflecting customer concerns over model fine-tuning on sensitive vectors. These dynamics indicate that vector databases will continue to siphon budget share from general-purpose data stores and secure their position as the performance backbone of the retrieval augmented generation market.


By Deployment Mode: Cloud Dominance Reflects Elastic Demand
Cloud deployments accounted for 75.24% of the retrieval augmented generation market size in 2024 because enterprises value elasticity during experimentation. It is projected to reach 39.26% CAGR through 2030. Bedrock, Vertex AI, and Azure OpenAI bundle managed embedding generation, vector storage, and governance dashboards, trimming proof-of-concept setup from weeks to hours. CIOs cite burst-capacity pricing as a hedge against unpredictable request volumes that follow chatbot releases. The public cloud’s compliance posture now includes SOC 2, HIPAA, and ISO 27001 attestations, which lowers due diligence friction even for regulated verticals. Private cloud variants gain traction when data residency or latency constraints demand regionally isolated clusters.
Hybrid patterns expand fastest because large organizations want on-premises control of confidential source documents while still leveraging cloud APIs for heavy compute. Edge caching reduces round-trip time for branch offices, and policy engines route sensitive prompts to internal LLMs while funneling low-risk traffic to hosted generative services. Telemetry from early adopters reveals that hybrid models cut the total cost of ownership by 18% relative to pure on-premises by offloading peak inference spikes. Suppliers respond by offering unified control planes that abstract deployment location, making workload placement a simple configuration toggle. These trends suggest that the retrieval augmented generation market will remain cloud-first in revenue terms, yet architecturally multi-environment in practice.
By Application: Code Generation Climbs the Priority Ladder
Content generation and summarization led in 2024, with a 22.11% slice of the retrieval augmented generation market size, because document-heavy functions such as legal, HR, and consulting benefited immediately from automated drafting. However, code generation and DevOps pipelines recorded the highest 41.56% CAGR through 2030 as software teams discovered that retrieval layers boost the accuracy of function stubs and configuration files by grounding suggestions in proprietary repositories. The shift aligns with the explosive growth of internal APIs, which doubles the challenge of remembering syntax variations. RAG copilots surface exact library calls with accompanying documentation lines, cutting debugging hours.
Meanwhile, enterprise knowledge management remains foundational, ingesting intranet wikis, PDFs, and slide decks into searchable vectors that feed downstream chatbots. Customer support chatbots measure success via reduced handoff rates; early pilots log 30% case deflection after three months when retrieval citations reassure users of response authenticity. Compliance and risk management solutions harvest regulatory bulletins and sanctions lists on a nightly schedule, generating dynamic obligations dashboards for legal counsel. Emerging multimodal RAG handles repair videos and training audio, paving the way for field-service technicians to receive visual instructions via smart glasses. As vertical use cases multiply, suppliers broaden application toolkits, ensuring that the retrieval augmented generation market retains a balanced mix of horizontal and domain-specific solutions.
By End-User Industry: Healthcare Leads, Retail Accelerates
Healthcare and life sciences controlled 32.85% of the retrieval augmented generation market share in 2024 because patient safety requires traceable information retrieval at every decision point. Mayo Clinic documented significant hallucination reduction after rolling out reverse RAG protocols that force grounding before generation. Drug-interaction chatbots link dosage advice to peer-reviewed trials, creating an audit path for regulators. Clinical coding teams use RAG to match procedure notes against ICD-10 codes, cutting reimbursement denials.
Retail and e-commerce races ahead at 41.71% CAGR as merchants infuse retrieval layers into recommendation engines that combine clickstream vectors with product metadata. RAG-powered digital stylist apps draw from image embeddings, style guides, and inventory APIs to curate outfits, lifting average order value. BFSI organizations leverage RAG for policy monitoring and portfolio risk alerts. Government adoption grows as agencies digitize archives and need transparent AI to comply with freedom-of-information laws. Manufacturing installs RAG kiosks on factory floors that retrieve maintenance manuals and safety instructions via QR scans. Media companies experiment with automated journalism that stitches data from filings, press releases, and live transcripts, but editorial policies still mandate human approval before publication. Collectively, these sectoral patterns highlight the diverse opportunity landscape inside the retrieval augmented generation market.
By Organization Size: SMEs Close the Gap Through Managed Services
Large enterprises captured 71.45% of the retrieval augmented generation market size in 2024 because they own vast proprietary datasets and possess budgets for custom pipelines. Their innovation roadmaps include federated retrieval across business units and multimodal expansions that span video, CAD files, and sensor logs. They also negotiate enterprise-wide commitments with cloud vendors that bundle GPU reservations, thus lowering marginal inference cost.
Small and mid-sized enterprises accelerate at a 41.12% CAGR because RAG-as-a-Service providers bundle ingestion, embedding, and orchestration behind REST endpoints. No-code dashboards allow non-technical staff to upload documents and deploy chatbots without touching Python scripts. Usage-based billing aligns with variable traffic patterns common in seasonal businesses. A growing ecosystem of marketplace templates covers legal Q&A, marketing collateral generation, and onboarding manuals, shortening time to value. SMEs also value built-in compliance features that satisfy customer due diligence without hiring dedicated governance staff. As managed offerings mature, the retrieval augmented generation market expects the SME revenue share to rise to nearly one-third by 2030, signaling democratization.
Geography Analysis
North America led with 38.15% of the retrieval augmented generation market share in 2024, owing to early enterprise AI budgets, concentrated talent pools, and venture capital that funded specialized tooling startups. The region hosts reference deployments across banking, healthcare, and technology, which lowers perceived risk for late adopters. Federal initiatives encourage open-source RAG toolkits to spur innovation while maintaining strategic leadership. Cloud hyperscalers headquartered in the United States reinforce regional dominance by locating GPU clusters near demand centers, cutting latency for production workloads.
Asia Pacific posts the fastest 42.71% CAGR because governments fund language-specific LLMs optimized for Mandarin, Japanese, Hindi, and Bahasa. It is anticipated that 60% of regional firms will run local models by 2025 to satisfy data-sovereignty rules. Chinese providers Baidu and Tencent embed RAG inside enterprise suites, while Indian service exporters build offshore delivery hubs that package RAG development with traditional IT outsourcing. Cost-sensitive firms benefit from declining vector-database pricing, widening adoption among mid-tier manufacturers, and e-commerce startups.
Europe grows steadily on a regulatory tailwind from the EU AI Act, which explicitly rewards explainable architectures. German automotive suppliers deploy RAG for technical documentation, and British financial firms incorporate retrieval layers to meet Consumer Duty requirements. Regional cloud availability zones address GDPR constraints, while sovereign-cloud initiatives in France and Italy bolster confidence among public-sector buyers. Vendor lock-in concerns drive interest in open-source stacks, yielding a diverse supplier base. Collectively, these geographic dynamics indicate that the retrieval augmented generation market will equalize regional revenue contributions by the decade’s close.

Competitive Landscape
Market concentration remains semi-consolidated because OpenAI, Microsoft, Google, and Amazon Web Services control the foundational model, compute, and orchestration layers that power most retrieval augmented generation market deployments. Microsoft leverages its OpenAI partnership to natively integrate retrieval flows inside Office and Azure, creating a defensible installed-base moat. Google capitalizes on decades of search research to fine-tune Vertex AI RAG offerings that optimize for precision at scale. AWS differentiates through Bedrock’s choice model catalog and serverless vector index.
Niche competition intensifies in vector databases. Pinecone, Weaviate, Qdrant, and Chroma compete on throughput, memory efficiency, and governance tooling. Pinecone’s serverless tier eases entry, while Weaviate emphasizes plugin extensibility. Qdrant appeals to buyers seeking open-source flexibility, and Chroma targets research teams with lightweight local deployment. Startups Contextual AI and Ragie launch RAG-as-a-Service platforms that abstract complexity and appeal to SMEs. Snowflake extends its data-cloud strategy through investment in Contextual AI, signaling convergence between analytics warehouses and retrieval pipelines.
Traditional enterprise vendors join the fray. IBM adds retrieval modules to watsonx.ai, SAP embeds RAG inside S/4HANA extensions, and Salesforce releases Service Cloud Answers that ground responses in CRM records. Security emerges as a competitive differentiator; Lakera and other specialists release tools that detect prompt-injection attacks and monitor retrieval misuse. Multimodal support becomes the next battleground as vendors experiment with embeddings for images, audio, CAD, and geospatial vectors. Maturity curves suggest that by 2028, at least five suppliers will offer unified retrieval across four modalities, signaling a new phase of feature parity in the retrieval augmented generation market.
Retrieval Augmented Generation Industry Leaders
OpenAI Inc.
Microsoft Corporation
Google LLC
Amazon Web Services, Inc.
Anthropic PBC
- *Disclaimer: Major Players sorted in no particular order

Recent Industry Developments
- February 2025: LightOn introduced multimodal RAG-as-a-Service with sovereign-cloud deployment options.
- December 2024: Perplexity AI acquired Carbon to strengthen enterprise search capabilities with RAG pipelines.
- August 2024: Contextual AI secured USD 80 million in Series A financing to scale its enterprise-grade RAG 2.0 platform.
- August 2024: Ragie launched a managed RAG-as-a-Service offering after raising USD 5.5 million in seed capital.
- August 2024: Snowflake invested in Contextual AI to embed RAG workflows into its AI Data Cloud.
- June 2024: DataStax released Langflow 1.0 and announced partnerships with LangChain, Microsoft, Mistral AI, and NVIDIA to speed RAG application development.
- February 2024: SciPhi raised USD 0.5 million to develop open-source RAG tooling for enterprise developers.


Global Retrieval Augmented Generation Market Report Scope
| Retrieval Layer |
| Embedding Models |
| Vector Databases |
| Orchestration Frameworks |
| LLM / Generation Layer |
| End-to-End RAG Platforms |
| Cloud-Based | Public Cloud |
| Private Cloud | |
| On-Premises | |
| Hybrid |
| Enterprise Knowledge Management |
| Customer Support Chatbots |
| Code Generation and DevOps |
| Content Generation and Summarization |
| Compliance and Risk Management |
| Other Applications |
| IT and Telecom |
| BFSI |
| Healthcare and Life Sciences |
| Retail and E-commerce |
| Manufacturing and Industrial |
| Government and Public Sector |
| Media and Entertainment |
| Other End-user Industries |
| Large Enterprises |
| Small and Mid-Sized Enterprises (SMEs) |
| North America | United States | |
| Canada | ||
| Mexico | ||
| South America | Brazil | |
| Argentina | ||
| Rest of South America | ||
| Europe | Germany | |
| United Kingdom | ||
| France | ||
| Italy | ||
| Spain | ||
| Russia | ||
| Rest of Europe | ||
| Asia Pacific | China | |
| Japan | ||
| India | ||
| South Korea | ||
| Australia and New Zealand | ||
| Rest of Asia Pacific | ||
| Middle East and Africa | Middle East | GCC |
| Turkey | ||
| Rest of Middle East | ||
| Africa | South Africa | |
| Rest of Africa | ||
| By Component | Retrieval Layer | ||
| Embedding Models | |||
| Vector Databases | |||
| Orchestration Frameworks | |||
| LLM / Generation Layer | |||
| End-to-End RAG Platforms | |||
| By Deployment Mode | Cloud-Based | Public Cloud | |
| Private Cloud | |||
| On-Premises | |||
| Hybrid | |||
| By Application | Enterprise Knowledge Management | ||
| Customer Support Chatbots | |||
| Code Generation and DevOps | |||
| Content Generation and Summarization | |||
| Compliance and Risk Management | |||
| Other Applications | |||
| By End-User Industry | IT and Telecom | ||
| BFSI | |||
| Healthcare and Life Sciences | |||
| Retail and E-commerce | |||
| Manufacturing and Industrial | |||
| Government and Public Sector | |||
| Media and Entertainment | |||
| Other End-user Industries | |||
| By Organization Size | Large Enterprises | ||
| Small and Mid-Sized Enterprises (SMEs) | |||
| By Geography | North America | United States | |
| Canada | |||
| Mexico | |||
| South America | Brazil | ||
| Argentina | |||
| Rest of South America | |||
| Europe | Germany | ||
| United Kingdom | |||
| France | |||
| Italy | |||
| Spain | |||
| Russia | |||
| Rest of Europe | |||
| Asia Pacific | China | ||
| Japan | |||
| India | |||
| South Korea | |||
| Australia and New Zealand | |||
| Rest of Asia Pacific | |||
| Middle East and Africa | Middle East | GCC | |
| Turkey | |||
| Rest of Middle East | |||
| Africa | South Africa | ||
| Rest of Africa | |||


Key Questions Answered in the Report
What is the current value of the retrieval augmented generation market?
The retrieval augmented generation market size stood at USD 1.92 billion in 2025.
How fast is this market projected to expand?
It is forecast to register a 39.66% CAGR and reach USD 10.2 billion by 2030.
Which deployment mode leads adoption?
Cloud-based deployment commands 75.24% share due to elastic scaling and turnkey services.
Which industry applies RAG most today?
Healthcare and life sciences hold the largest 32.85% share because they require traceable clinical information.
Why is Asia Pacific considered the fastest-growing region?
Government AI funding, multilingual model demand, and rapid digital transformation drive a 42.71% CAGR through 2030.
What technology component is expanding the quickest?
Vector databases are growing at a 40.02% CAGR as they optimize performance for large-scale similarity search.
Page last updated on:


