
Cloud AI Market Size and Share
Market Overview
| Study Period | 2020 - 2031 |
|---|---|
| Market Size (2026) | USD 114.26 Billion |
| Market Size (2031) | USD 269.02 Billion |
| Growth Rate (2026 - 2031) | 18.68 % |
| Fastest Growing Market | Asia Pacific |
| Largest Market | North America |
| Market Concentration | Medium |
Major Players *Disclaimer: Major Players sorted in no particular order Image © Mordor Intelligence. Reuse requires attribution under CC BY 4.0. | |
Cloud AI Market Analysis by Mordor Intelligence
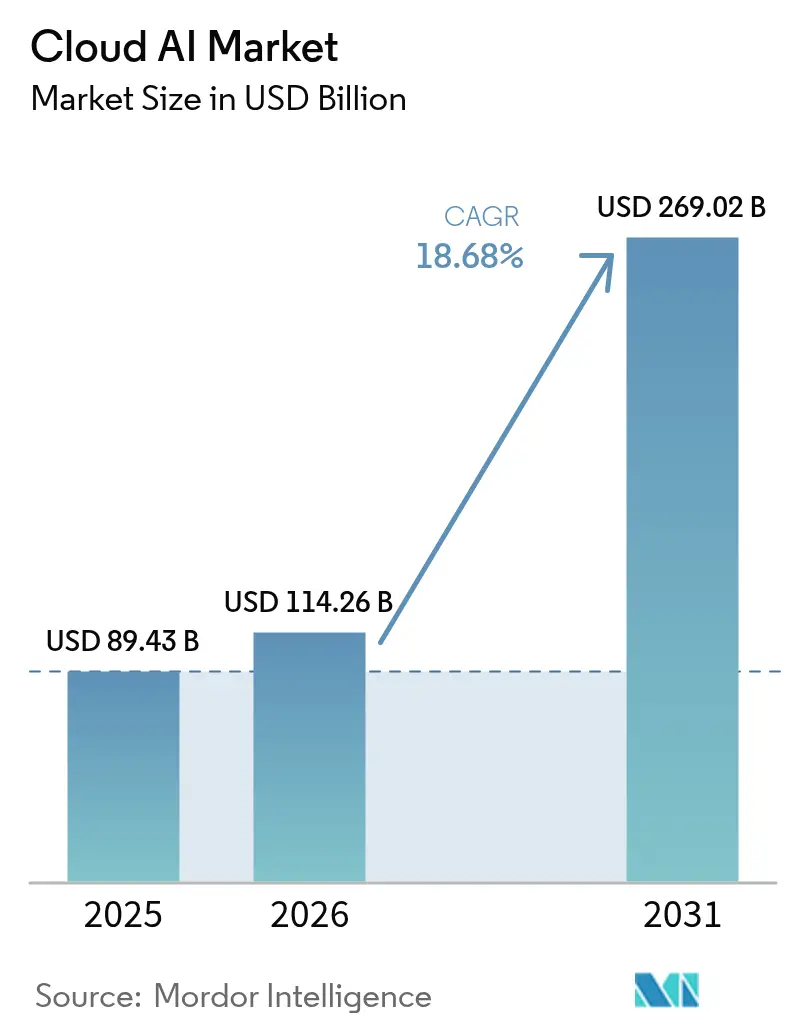
The cloud AI market size is projected to be USD 89.43 billion in 2025, USD 114.26 billion in 2026, and reach USD 269.02 billion by 2031, growing at a CAGR of 18.68% from 2026 to 2031. Enterprises are shifting budgets from small pilots toward large-scale production workloads that rely on hybrid architectures, sovereign-data controls, and GPU fractionalization to balance performance and cost. Vendors are hardening products for responsible-AI governance, bias monitoring, and explainability, which is beginning to influence purchasing criteria for heavily regulated sectors. Competitive strategies center on vertical integration of proprietary silicon, carbon-aware workload orchestration, and managed services that offload MLOps complexity. High-profile export-control policies, energy-supply concerns, and specialist GPU-cloud challengers are shaping the near-term trajectory of the cloud AI market.
Key Report Takeaways
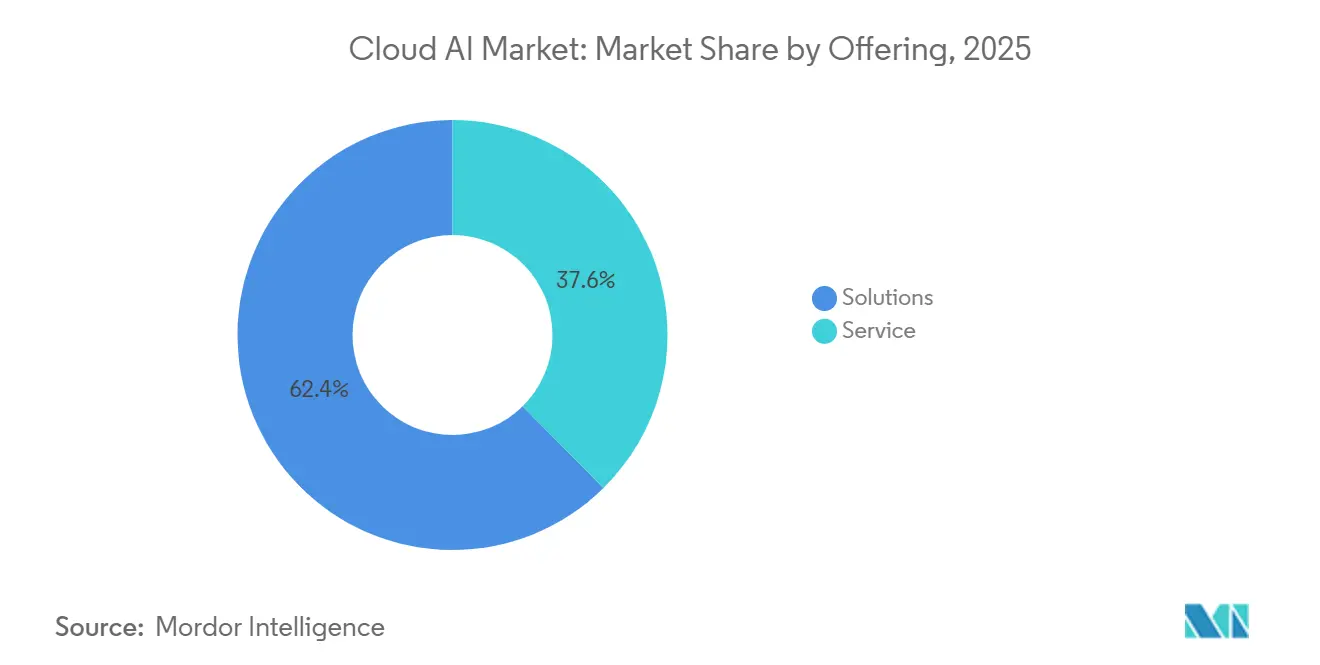
- By offering, solutions accounted for 62.39% of revenue in 2025, while services are advancing at a 20.19% CAGR through 2031.
- By deployment model, public cloud led with 70.24% of spending in 2025, whereas hybrid and multi-cloud architectures are scaling fastest at a 22.31% CAGR to 2031.
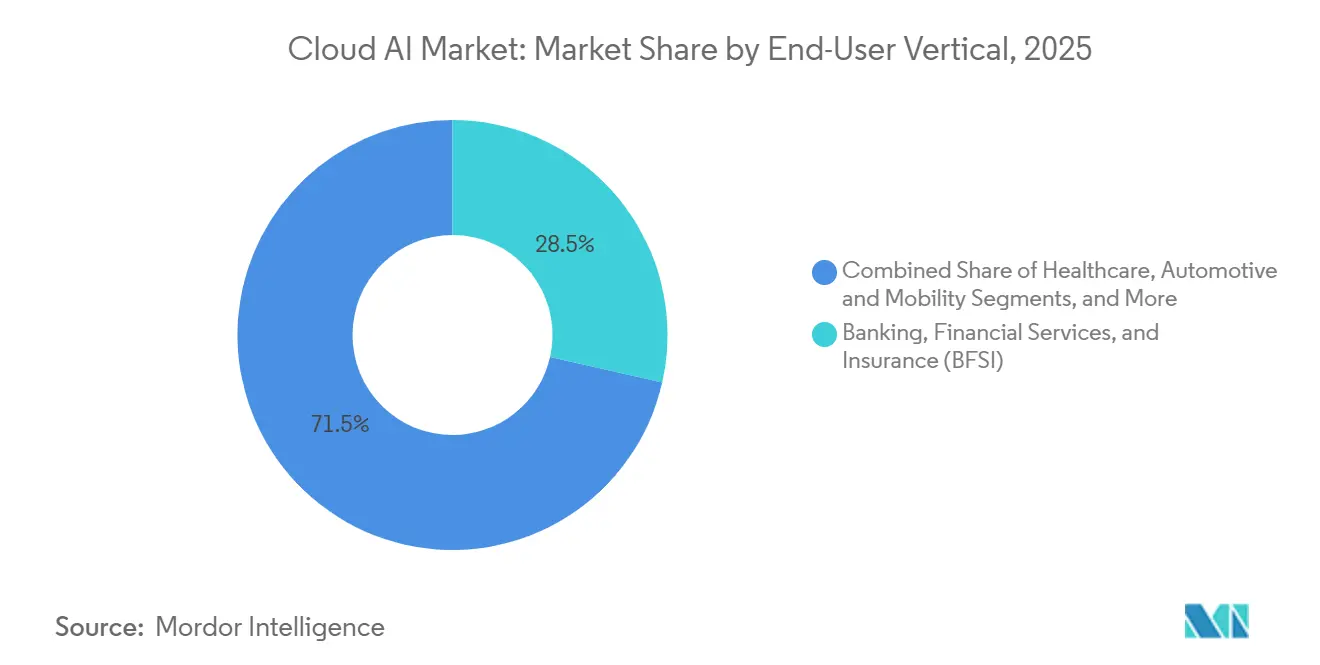
- By end-user vertical, BFSI captured 28.54% of 2025 spend, while healthcare is projected to post the strongest 21.07% CAGR to 2031.
- By application, customer-service and contact-center AI held a 35.39% share in 2025, yet marketing and personalization is the fastest-growing use case at 20.11% through 2031.
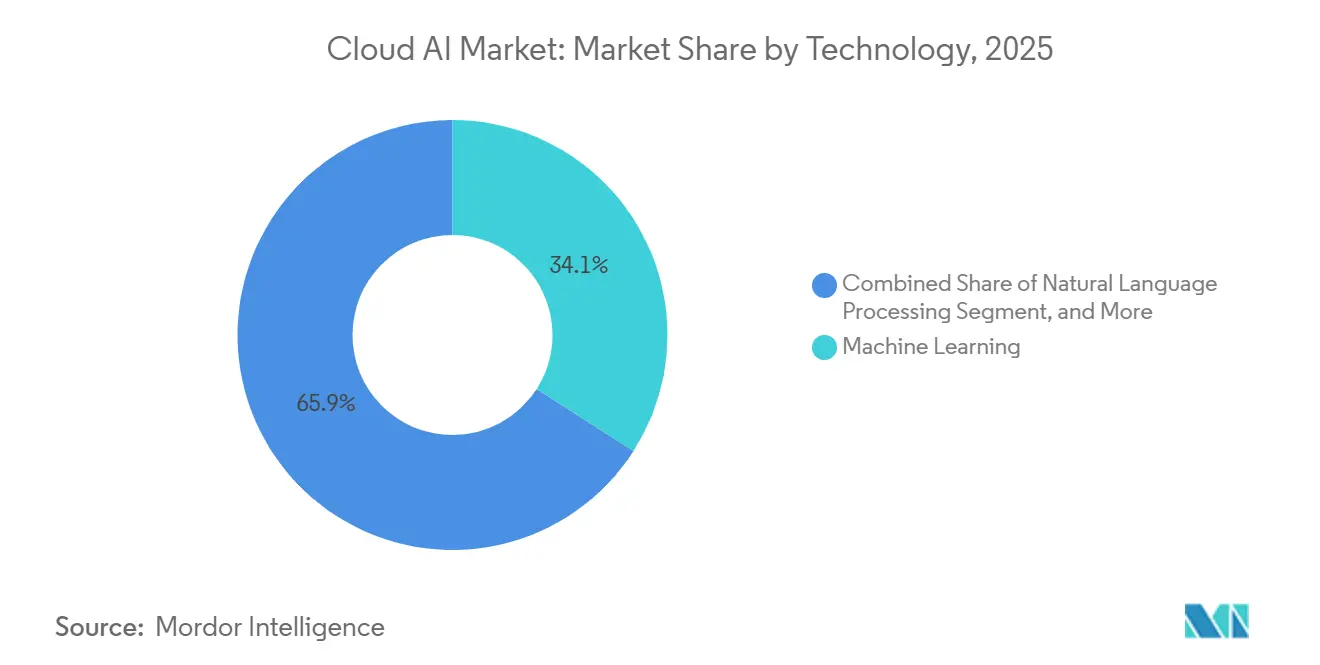
- By technology, machine learning commanded 34.06% of 2025 deployments, while natural-language processing is set to expand at a 20.43% CAGR to 2031.
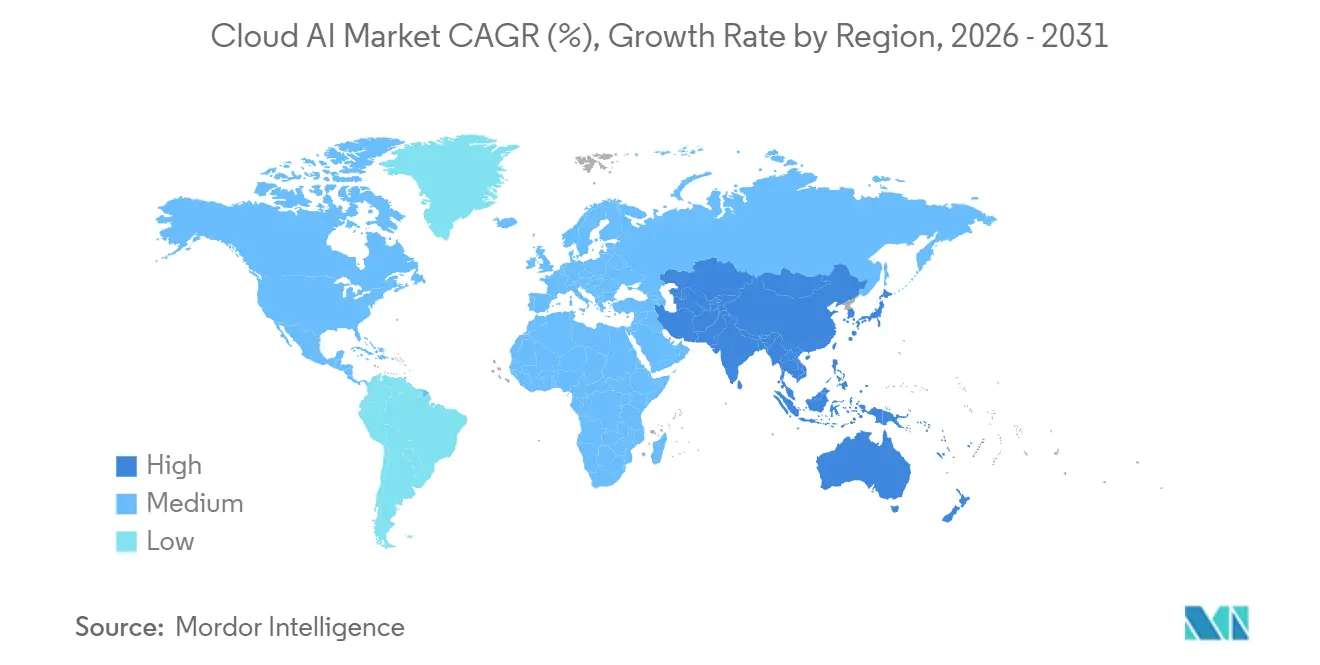
- by region, North America retained 40.59% of 2025 revenue, but Asia-Pacific is on pace for a 22.74% CAGR, the quickest regional rise to 2031.
Note: Market size and forecast figures in this report are generated using Mordor Intelligence’s proprietary estimation framework, updated with the latest available data and insights as of 2026.
Market Trends and Insights
Drivers Impact Analysis of Cloud AI Market*
| Driver | (~) % Impact on CAGR Forecast | Geographic Relevance | Impact Timeline |
|---|---|---|---|
| Rising Big-Data Volume | +3.2% | Global, with concentration in North America and Asia-Pacific | Medium term (2-4 years) |
| Growing Adoption of AI-as-a-Service (AIaaS) | +4.1% | Global, led by North America and Europe | Short term (≤ 2 years) |
| Increasing Demand for Virtual Assistants and Generative-AI Chatbots | +3.8% | Global, strongest in North America, Europe, and urban Asia-Pacific | Short term (≤ 2 years) |
| GenAI GPU-Fractionalization Expanding SME Access | +2.7% | North America and Europe core, spillover to Asia-Pacific and Middle East | Medium term (2-4 years) |
| Edge-Cloud AI Interoperability Standards (e.g., ONNX, MEDAL) | +1.9% | Global, early adoption in automotive and manufacturing hubs | Long term (≥ 4 years) |
| Carbon-Aware Workload Orchestration Incentives | +1.5% | Europe and North America, expanding to Asia-Pacific | Long term (≥ 4 years) |
| Source: Mordor Intelligence | |||
Rising Big-Data Volume
Organizations generated 120 zettabytes of data in 2025, and only scalable cloud AI platforms can cost-effectively ingest, label, and analyze multimodal datasets at that magnitude. Public-cloud object stores give manufacturers inexpensive retention of machine-vision footage used for predictive-maintenance algorithms that spot thermal anomalies weeks in advance.[1]Amazon Web Services, “Amazon Annual Report 2025,” aboutamazon.com Financial institutions are funneling transaction logs and call-center transcripts into cloud data lakes, then applying NLP to surface emerging fraud behaviors that rule-based engines miss. Eleven-nines durability guarantees and sub-USD 0.02 per-gigabyte pricing have all but ended interest in on-premises storage expansions for AI use cases. As a result, demand for data-pipeline automation, feature stores, and scalable annotation services is amplifying the growth of the cloud AI market.
Growing Adoption of AI-as-a-Service (AIaaS)
AIaaS revenue reached USD 28 billion in 2025 as firms without deep ML talent embraced turnkey model APIs. Databricks’ Model Serving processed 14 billion monthly inference calls, demonstrating how one-click deployment compresses time-to-production from quarters to weeks. Snowflake Cortex enabled SQL analysts to run sentiment and translation models inside familiar queries, widening access beyond data-science teams.[2]Snowflake, “Neeva Acquisition Press Release,” investors.snowflake.com A 2025 survey showed 42% of European SMEs already consume cloud NLP or vision APIs because consumption pricing removes up-front licensing risk. These dynamics position AIaaS as a near-term accelerator of cloud AI uptake across company sizes.
Increasing Demand for Virtual Assistants and Generative-AI Chatbots
Chatbots handled 68% of tier-1 service requests in 2025, slashing average handle time by 29% and lifting customer-satisfaction scores by 12 points.[3]Salesforce, “State of Service Report 2025,” salesforce.com Multilingual voice bots in telecom and utilities cut annual labor expense by USD 1.8 billion through 47-language coverage. Healthcare pilots that embed ambient clinical-documentation assistants save physicians 90 minutes per day and boost billing accuracy by 22%. Enterprises see hard OPEX savings and faster resolution times, driving executive sponsorship for further rollout. Higher inference call volumes from these assistants materially expand cloud AI compute demand.
GenAI GPU-Fractionalization Expanding SME Access
GPU slicing platforms let customers rent one-eighth or one-quarter of an H100 or MI300X for less than USD 2 per hour, adding 14,000 new users in 2025.[4]CoreWeave, “Product Documentation 2025,” docs.coreweave.com Case studies show legal-tech and biotech startups running fine-tuning jobs on fractional hardware they previously could not afford. NVIDIA’s Multi-Instance GPU boosts utilization to 87%, translating provider savings into lower prices for end users. The EU’s Horizon Europe program earmarked EUR 400 million (USD 452 million) for subsidized GPU credits, further democratizing access. By lowering cost and wait-time barriers, fractionalization expands the total addressable market for cloud AI among small and mid-size enterprises.
Restraints Impact Analysis of Cloud AI Market*
| Restraint | (~) % Impact on CAGR Forecast | Geographic Relevance | Impact Timeline |
|---|---|---|---|
| Lack of Skilled Workforce and Data-Security Concerns | -2.8% | Global, acute in emerging markets and SME segments | Medium term (2-4 years) |
| Persistent GPU and HBM Supply-Chain Shortages | -3.4% | Global, most severe in Asia-Pacific and Europe | Short term (≤ 2 years) |
| AI Datacenter Energy Constraints and Carbon Regulations | -2.1% | North America and Europe, expanding to Asia-Pacific | Medium term (2-4 years) |
| Geopolitical GPU Export-Control Frameworks | -1.9% | China, Russia, and 25 other restricted territories | Long term (≥ 4 years) |
| Source: Mordor Intelligence | |||
Lack of Skilled Workforce and Data-Security Concerns
The global shortage of 1.4 million ML professionals in 2025 pushed Silicon Valley median compensation to USD 385,000, pricing out many mid-market firms. Universities produced only 87,000 AI-focused doctorates, well below demand growth. Misconfigured cloud buckets exposed 2.3 billion records, triggering 34% of CIOs to postpone migrations until zero-trust and encryption controls mature. GDPR and CCPA fines reached USD 2.03 billion, raising the compliance stakes for sectors handling sensitive personal data. Without improved training pipelines and automated security tooling, talent scarcity and breach fears remain formidable obstacles.
Persistent GPU and HBM Supply-Chain Shortages
NVIDIA H100 lead times stretched to 52 weeks by late 2025, while AMD MI300X backlogs topped nine months due to wafer constraints at advanced-node fabs. HBM3 output met only 68% of demand because just three vendors manufacture the memory stacks, forcing datacenter operators to ration capacity. Cloud providers introduced CPU-based inference on Graviton4, but high-parameter training remains GPU bound. U.S. export rules also blocked shipments of top-tier GPUs to 27 jurisdictions, prompting stockpiling of older V100 chips and delaying new AI projects. Until supply expands or alternative accelerators mature, hardware scarcity will limit onboarding of compute-intensive workloads.
*Our forecasts treat driver/restraint impacts as directional, not additive. The impact forecasts reflect baseline growth, mix effects, and variable interactions.
Cloud AI Market Segment Analysis
By Offering:
Services Scale as Firms Seek Turnkey IntegrationSolutions held a 62.39% cloud AI market share in 2025, reflecting enterprises’ preference for turnkey infrastructure, PaaS tooling, and expansive model marketplaces that shorten development cycles. GPU-optimized instances from every hyperscaler remained the anchor purchase, while Databricks Lakehouse AI and Snowflake Cortex abstracted data prep and version control so retailers could roll out holiday recommendation engines on time. Model hubs such as Hugging Face hosted 340,000 algorithms, letting teams fine-tune BERT or Stable Diffusion instead of training from scratch, computer vision, and code-generation workloads proliferate, customers continue to funnel budget toward solution bundles that promise predictable latency and embedded governance.
Services are set to post a 20.19% CAGR through 2031, driven by professional guidance on bias mitigation and managed offerings that guarantee 99.9% uptime for production inference. As the EU AI Act starts enforcement in 2026, 67% of European firms intend to outsource compliance audits and model documentation, raising the services slice of overall cloud AI market size during the forecast window. Continuous-training contracts already cover drift alerts, adversarial filtering, and zero-day patching, helping clients bridge the AI-talent gap without ballooning payrolls. Collectively, these factors position service vendors to capture a growing share of budget even among organizations that keep core infrastructure in-house.


By Deployment Model:
Hybrid Gains Ground Amid Data-Residency RulesPublic cloud accounted for 70.24% of 2025 spending, with elastic capacity and rapid access to new silicon, H100, H200, MI300X, remaining decisive advantages. Digital-native firms especially prize the pay-as-you-go economics that avoid capex on data centers, cooling, and high-speed networking. Public platforms now package AutoML and foundation-model APIs, letting business analysts stand up pilots in days rather than quarters. Yet regulators continue to push finance, healthcare, and government users to retain sensitive data within national borders, forcing teams to bifurcate architectures.
Hybrid and multi-cloud deployments are projected to expand at a 22.31% CAGR, as 54% of enterprises now schedule AI workloads across at least two providers to sidestep lock-in and meet latency goals. Banks repatriate transaction ledgers to private clouds for GDPR compliance, while anonymized features flow back to public clusters for large-scale model training. Healthcare networks follow a similar pattern by storing PHI on-premises and shipping stripped tensors to GPU farms for federated learning. Tooling that normalizes MLOps across providers, feature stores, observability dashboards, and policy engines, is therefore emerging as a pivotal growth vector for the cloud AI market.
By End-User Vertical:
Healthcare Accelerates Following Surge in FDA ClearancesBFSI dominated spending with a 28.54% share in 2025, applying anomaly-detection models to 12 billion transactions and trimming synthetic-identity fraud by double digits. Graph-based underwriting systems also extended credit to 18 million thin-file consumers, lowering default risk without manual review. Algorithmic-trading desks back-tested thousands of reinforcement-learning strategies overnight, capturing incremental alpha that reinforced cloud budgets.
Healthcare is forecast to grow at a 21.07% CAGR after the FDA cleared 127 AI-enabled devices in 2025, legitimizing cloud-based diagnostic pipelines. Radiology networks now analyze CT and MRI scans in under two minutes, halving turnaround time and catching pathologies previously overlooked. Ambient clinical-documentation tools free clinicians 90 minutes per day, and genomics labs shrink variant-calling cycles from four weeks to 36 hours. Given these time and cost savings, healthcare’s weight inside the cloud AI market is expected to climb steadily through 2031.

By Application:
Personalization Outpaces Customer-Service StrongholdCustomer-service automation commanded 35.39% of 2025 outlays, with multilingual chatbots resolving 68% of tier-1 requests and slicing handle times by nearly one-third. Virtual agents in telecom, airlines, and insurance collectively saved USD 1.8 billion in annual labor. As handling efficiency approaches saturation, incremental growth for this application class is slowing, although unit volumes remain high enough to anchor GPU inference demand.
Marketing and personalization is tracking a 20.11% CAGR, fueled by generative-AI recommenders that already account for 35% of revenue at leading e-commerce platforms. Fashion retailers offer visual-similarity search that lifts mobile conversion by more than a quarter, and streaming services cut churn by optimizing watch lists with reinforcement learning. As these successes spread, marketing workloads are positioned to seize incremental cloud AI market share from mature service bots.
By Technology:
NLP Jumps as LLMs Permeate Back-Office SystemsMachine learning captured 34.06% of 2025 deployments, covering classic regression, tree ensembles, and clustering models that underpin credit-risk scoring, demand planning, and predictive maintenance. Manufacturers that embedded anomaly detectors into line-edge sensors cut scrap by almost one-third, illustrating why conventional ML will stay foundational.
Natural-language processing is poised for a 20.43% CAGR as GPT-class models automate contract abstraction, regulatory summaries, and email drafting. Legal teams now review 4.8 million agreements annually in a fraction of past time, and pharma companies mine millions of trial documents for adverse events within hours rather than weeks. Because these gains translate directly into billable-hour savings, NLP’s share of overall cloud AI market size is expected to overtake computer vision before 2031.
Geography Analysis
North America Cloud AI Market
North America commanded a 40.59% cloud AI market share in 2025, reflecting deep Fortune 500 budgets and hyperscaler capital expenditure that topped USD 200 billion on new datacenter builds during the year. Sovereign-compute initiatives are also scaling: Canada’s Pan-Canadian AI Strategy earmarked CAD 2.4 billion (USD 1.77 billion) to retain talent and fund local GPU clusters. Mexico leveraged near-shoring to infuse cloud AI into automotive and electronics supply chains, pushing regional cloud-services revenue up 19% year over year. Across the United States, enterprises report median 240% ROI on generative-AI pilots, an outcome that fuels continued expansion of the cloud AI market in the region. Taken together, these factors keep North America at the forefront of large-parameter model training and inference consumption.
APAC Cloud AI Market
Asia-Pacific is projected to record the fastest 22.74% CAGR through 2031, propelled by state-led mandates and rising private investment in localized model ecosystems. China redirected roughly USD 18 billion in annual enterprise spending toward domestic AI clouds under its sovereign-AI directive, accelerating adoption of locally trained foundation models. India’s National AI Mission allocated INR 103 billion (USD 1.24 billion) for multi-city GPU clusters and subsidized compute credits for 14,000 startups, broadening developer access to advanced silicon. Japan and South Korea committed a combined USD 1.5 billion to edge-cloud infrastructure and domestic AI-chip production, actions that shorten inference latency for smart-city and autonomous-mobility projects.
EMEA and South America Cloud AI Market
Europe, South America, Middle East, and Africa together accounted for 37% of 2025 revenue, and regulatory dynamics now shape procurement criteria across these territories. The forthcoming EU AI Act is prompting 62% of surveyed enterprises to adopt explainable-AI tooling and engage compliance consultants before 2026 go-live. Germany’s AI Made in Europe program set aside EUR 3 billion (USD 3.39 billion) for sovereign cloud nodes, attracting 340 enterprise tenants in its first year. Brazil’s banks and Argentina’s agritech firms pushed South American cloud AI market size upward by 18% in 2025 through fraud analytics and precision-farming solutions. GCC nations invested USD 12 billion in AI infrastructure, with Saudi Arabia’s NEOM project piloting autonomous fleets and smart-grid optimization. In Africa, mobile carriers used AI-powered credit scoring to extend micro-loans to 8.2 million unbanked adults in 2025, underscoring the region’s early-stage yet high-impact opportunity set.

Regulatory Landscape
Cloud AI procurement is increasingly shaped by cross-border AI governance, privacy compliance, and model-security expectations that sit on top of cloud and data regulations. In the EU, the AI Act (Regulation (EU) 2024/1689) entered into force on August 1, 2024, with broad applicability dates centered on August 2, 2026. This timeline pushes buyers toward explainability, documentation, and risk controls that can be operationalized in cloud MLOps toolchains. Alongside the AI Act implementation track, the European Commission proposed a Cloud and AI Development Act in 2026, signaling policy focus on cloud sovereignty and computing-capacity concentration. That direction raises requirements around data residency and trusted cloud controls for regulated workloads.
In the United States, the policy direction in 2026 emphasizes innovation with security through frameworks rather than mandatory licensing. This includes a June 5, 2026 Executive Order on Promoting Advanced AI Innovation and Security that establishes a classified benchmarking process for frontier models managed by the Director of the NSA. Standards also remain a key compliance anchor: NIST continues to maintain the voluntary AI Risk Management Framework and issued draft cybersecurity guidance for AI in December 2025 with feedback processes continuing through 2026, explicitly calling out cloud service providers as critical actors for securing model weights and supply-chain controls. Together, these developments reinforce vendor investment in responsible-AI governance, auditability, and security-by-design as differentiators for cloud AI solutions and managed services in heavily regulated sectors.
Value Chain Analysis
The cloud AI value chain spans five interlinked layers: compute and memory hardware, data center and cloud infrastructure, data ingestion and curation, foundation-model development and model hosting, and end-user applications delivered as solutions and services. Upstream constraints and differentiation concentrate in accelerators, high-bandwidth memory, and networking, with supply and performance roadmaps influencing availability and unit economics for training and inference. Partnerships show how providers secure critical inputs: NVIDIA and SK hynix announced a multiyear technology partnership in June 2026 to co-develop next-generation memory for AI factories, underscoring the dependency on advanced memory stacks for large-model workloads.
Midstream hyperscalers and specialist GPU clouds package hardware into instances, AI PaaS, and model marketplaces, then distribute through direct enterprise sales, channel partners, and system integrators into vertical solutions. Data center build-outs and interconnect upgrades are now core supply chain levers, highlighted by Microsofts July 2026 partnership with 3M to deploy Expanded Beam Optical technology in Azure data centers to improve high-density connectivity. Downstream, application providers and enterprise teams operationalize models through MLOps, governance, and observability, while managed services expand as buyers outsource compliance and production reliability, particularly for hybrid and multi-cloud architectures used to meet residency and risk requirements.
Competitive Landscape
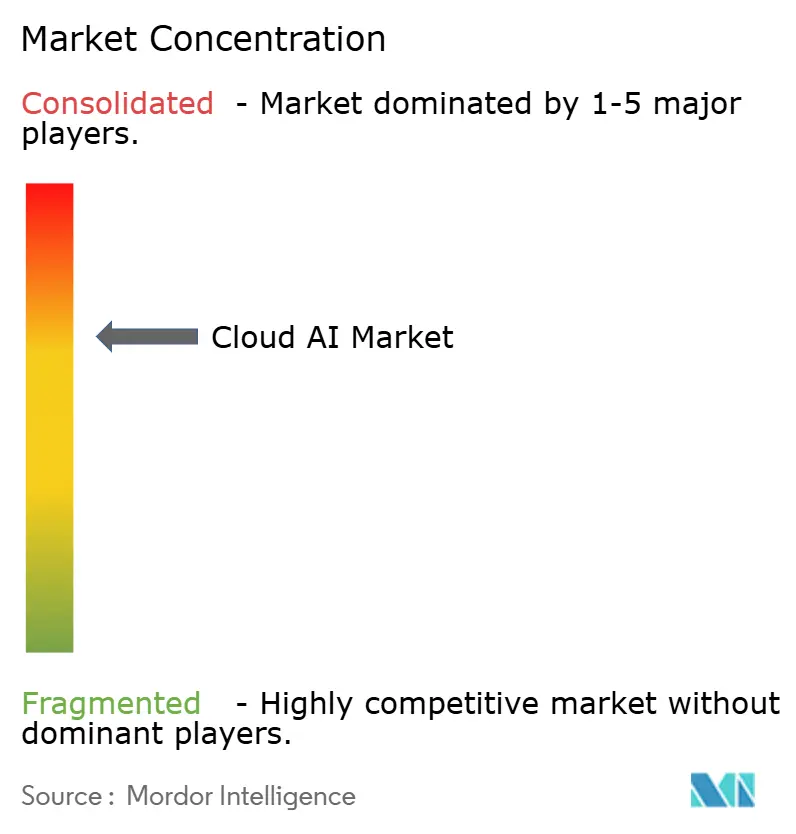
The top three hyperscalers, Amazon Web Services, Microsoft Azure, and Google Cloud, controlled roughly 65% of infrastructure revenue in 2025, a level that translates into moderate concentration for the cloud AI market. AWS differentiates through Trainium and Inferentia chips, which cut training and inference costs by up to 40% compared with GPU-based instances, while Microsoft integrates OpenAI models into Office and Dynamics to monetize 380 million enterprise seats. Google counters with carbon-aware workload scheduling that shifts batch jobs to regions with surplus renewable energy, reducing Scope 2 emissions by 18% and appealing to sustainability-focused buyers.
Specialized GPU-cloud providers such as CoreWeave and Lambda Labs are eroding hyperscaler dominance by offering fractional H100 and MI300X capacity, flexible per-second billing, and data centers colocated near low-cost renewable power. Their client count grew by double digits in 2025 as mid-market software vendors pursued cost relief and avoided long lead times for dedicated GPUs. Sovereign-cloud initiatives in Germany, France, and Canada add further fragmentation, giving local enterprises alternatives that satisfy residency mandates while maintaining access to high-end compute.
Feature-rich managed platforms are driving a wave of mergers and acquisitions aimed at rounding out model-ops capabilities. Snowflake bought Neeva for USD 185 million to embed semantic search into its data cloud, and Databricks acquired MosaicML for USD 1.3 billion to deliver turnkey foundation-model training. Providers that obtain ISO/IEC 42001 certification for AI management and demonstrate GDPR-compliant workflows win disproportionate contracts in finance and healthcare, sectors where non-compliance carries steep fines. Competitive vectors now include quantization, speculative decoding, and federated-learning toolkits that let customers train across multiple parties without centralizing data, reinforcing a steady march toward richer, more portable offerings in the global cloud AI market.
Cloud AI Industry Leaders
Amazon Web Services Inc.
Microsoft Corporation
Google LLC
IBM Corporation
Intel Corporation
- *Disclaimer: Major Players sorted in no particular order
Cloud AI Market Companies Covered in this Report
- Amazon Web Services
- Microsoft Corp.
- Google LLC
- IBM Corp.
- Salesforce Inc.
- NVIDIA Corp.
- Oracle Corp.
- Alibaba Cloud
- SAP SE
- ServiceNow Inc.
- Databricks Inc.
- Snowflake Inc.
- Hugging Face Inc.
- OpenAI LP
- Anthropic PBC
- CoreWeave Inc.
- AMD Inc.
- Intel Corp.
- Wipro Ltd.
- Infosys Ltd.
- SoundHound AI Inc.
- Twilio Inc.
- Cohere Inc.
- Tencent Cloud

Market Opportunities and Future Outlook
A primary whitespace is emerging around AI infrastructure that is power- and network-constrained rather than purely chip-constrained. This creates room for differentiated offerings in carbon-aware workload orchestration, high-density interconnect, and capacity assurance for regulated and latency-sensitive workloads. The infrastructure pivot is visible in large-scale site and campus moves: Meta deepened investment in its Richland Parish, Louisiana data center initiative in July 2026, scaling an AI-optimized footprint designed for large training clusters, while Oracle and OpenAI began construction on the Stargate data center campus in Saline Township, Michigan with 1 GW of capacity. These buildouts reinforce demand for cloud AI platforms that can abstract placement, scheduling, and cost controls across regions and providers as compute availability becomes a procurement criterion.
Policy and sovereignty programs also open commercial lanes for providers that can operationalize data residency, auditability, and trusted-cloud controls without forcing customers to sacrifice access to high-end accelerators. The European Commissions 2026 proposal for a Cloud and AI Development Act, paired with the EU AI Act implementation timeline, creates an opportunity set for sovereign and hybrid cloud AI stacks that integrate governance, model documentation, and security controls as managed capabilities. On the consumption side, enterprise adoption of agentic AI patterns is increasing the need for standardized model access layers, guardrails, and observability across multiple model endpoints and clouds. This favors platforms and services that normalize deployment, monitoring, and compliance workflows across public, private, and hybrid environments.
Recent Industry Developments in Cloud AI Market
- July 2026: Amazon Web Services and OpenAI expanded their multiyear partnership, with Amazon investing USD 50 billion and OpenAI committing to use 2 gigawatts of Trainium capacity on AWS while extending their cloud contract by USD 100 billion over eight years. The deal strengthens AWSs position in large-scale training and inference by anchoring demand to proprietary silicon and long-term capacity planning. It also raises competitive pressure on hyperscalers and GPU-cloud specialists to secure comparable multi-year compute commitments and differentiated pricing for frontier workloads.
- May 2026: Snowflake and AWS signed a multiyear strategic collaboration that included a USD 6 billion infrastructure commitment to accelerate enterprise agentic AI adoption. The agreement tightens integration between data platforms and cloud AI infrastructure, targeting faster pathways from governed data to production model serving. For cloud AI buyers, it reinforces a trend toward bundled procurement of data, model tooling, and compute that reduces MLOps friction but can increase platform dependency.
- December 2025: AWS launched Trainium2, targeting major gains in training performance and lower training costs versus the prior generation. The release broadened the competitive set beyond GPU-only roadmaps by giving customers an alternative accelerator path inside a major hyperscale ecosystem. It also reinforced the market shift toward vertical integration of silicon, infrastructure, and managed AI services as providers compete on unit economics and capacity availability.


Cloud AI Market Report Scope and Research Methodology
Market Definition and Coverage
This market covers revenue earned from AI capabilities that are delivered through cloud environments, including cloud-hosted platforms, tools, and related services used to build, train, deploy, and run AI workloads.
Scope exclusions: Excludes standalone on-premise AI software and hardware that is not delivered or billed as part of a cloud offering.
Segments Covered in This Report
- By Type
- Solution
- Infrastructure (Compute, Storage, Networking)
- Platform-as-a-Service for AI
- Model Marketplace
- Service
- Professional Services
- Managed Services
- Solution
- By End-User Vertical
- Banking, Financial Services, and Insurance (BFSI)
- Healthcare
- Automotive and Mobility
- Retail and E-Commerce
- Government and Public Sector
- Education
- Manufacturing
- By Deployment Model
- Public Cloud
- Private Cloud
- Hybrid and Multi-Cloud
- By Application
- Customer Service and Contact-Center AI
- Predictive Maintenance and Asset Operations
- Fraud and Risk Analytics
- Marketing and Personalization
- Computer-Vision-as-a-Service
- By Technology
- Machine Learning
- Natural Language Processing
- Computer Vision
- Generative AI
- Reinforcement and Edge AI
- By Geography
- North America
- United States
- Canada
- Mexico
- South America
- Brazil
- Argentina
- Chile
- Rest of South America
- Europe
- Germany
- United Kingdom
- France
- Italy
- Spain
- Netherlands
- Russia
- Rest of Europe
- Asia-Pacific
- China
- India
- Japan
- South Korea
- ASEAN
- Rest of Asia-Pacific
- Middle East
- GCC
- Turkey
- Rest of Middle East
- Africa
- South Africa
- Nigeria
- Kenya
- Rest of Africa
- North America
Data Sources, Market Sizing, and Validation
Desk Research
Desk research was used to set the baseline facts that the model depends on, before any interview inputs were added. We pulled non-paywalled references such as US Census Bureau and Bureau of Economic Analysis datasets for IT spending signals, OECD and World Bank indicators for macro and productivity context, and ITU statistics for connectivity and data-traffic direction.
To ground what vendors are actually shipping and monetizing, we also reviewed public company filings, earnings call transcripts, investor presentations, and trusted press coverage on cloud and AI product releases. Patent databases were referenced selectively to sanity check technology momentum and timing, and a news and financials subscription helped with faster tracking of major contracts and partnership announcements. The source list above is illustrative, and many other public references were used to cross-check figures and clarify assumptions during analysis.
Primary Interviews and Surveys
Primary work focused on validating what is counted as cloud AI revenue in real buying and selling situations, and on tightening assumptions where desk sources stayed broad. We spoke with cloud platform teams, AI solution providers, system integrators, and enterprise buyers across APAC, EMEA, and the Americas, so adoption patterns and pricing behavior were not inferred from a single region.
Distribution of primary research fieldwork respondents
| Company type | Respondent position | Region |
|---|---|---|
| Top tier: 36% | CXOs: 19% | APAC: 42% |
| Mid tier: 44% | Functional/Unit leaders: 28% | EMEA: 35% |
| Smaller Players: 20% | Managers: 53% | Americas: 23% |
Market-Sizing & Forecasting
Sizing starts with a top-down demand pool build, where cloud and AI spend signals are translated into a cloud AI revenue envelope using adoption and attach-rate assumptions that were validated in interviews. The totals are then checked with selective bottom-up approximations, such as sampled vendor revenue disclosures, channel partner feedback, and an ASP times volume view for common cloud AI consumption patterns, before the final number is fixed.
Inputs used in the model include public cloud adoption levels by region, enterprise AI use-case rollout pace, the mix shift between training and inference workloads, average contract durations for AI-enabled cloud services, and pricing direction for compute and managed AI services. Where bottom-up evidence is incomplete for smaller geographies or newer offerings, gap handling is done through proxy indicators like IT services intensity and cloud workload growth, followed by a second pass from expert feedback.
Forecasts use scenario analysis supported by variable-level expectations from interviews, since cloud AI spend can move quickly with regulation, budget cycles, and platform releases. A base case is built first, and conservative and aggressive bands are used to test sensitivity to pricing changes and workload growth.
Data Validation & Update Cycle
Outputs are validated by comparing them with independent signals, including cloud spending direction, AI software and services revenue trends, and regional digitization indicators. When a segment or region shows an unusual jump, the underlying drivers are rechecked, and assumptions are revisited with follow-up outreach where needed.
Before sign-off, the full model is reviewed in steps so calculation logic, currency conversions, and year-to-year movements are consistent. Reports are refreshed annually, and interim updates are made when material events occur that can move demand or pricing. Right before delivery, a fresh review pass is completed so clients receive the latest updated view.
Mordor Intelligence's Cloud AI Market Size Compared With Other Published Estimates
It is common to see different market sizes for cloud AI because publishers do not always count the same revenue items, and they may also anchor forecasts on different base years and price paths. Differences in what is treated as services versus platform revenue can also shift totals even when the narrative sounds similar.
On-premise AI software revenue sits outside Mordor Intelligence's scope, and that single exclusion can widen the spread when other estimates blend hybrid deployments without clearly separating cloud-billed value from on-premise licenses. Beyond scope, gaps also come from how fast AI compute and managed-service pricing is assumed to fall, whether forecast numbers reflect a base case or an aggressive adoption curve, and how often assumptions are refreshed after major platform launches or policy changes.
Benchmark comparison
| Source | Market Size | Gaps in Research Methodology |
|---|---|---|
| Mordor Intelligence | USD 89.43 B (2025) | |
| Global Consultancy A | USD 121.74 B (2025) | Often uses a broader revenue pool that can blend adjacent AI software and bundled services into cloud AI, and may apply faster adoption ramp assumptions across all regions at once. |
| Industry Publisher B | USD 102.09 B (2025) | May count a wider set of solution and service revenues under cloud AI, with less explicit separation between cloud-delivered AI value and hybrid deployments that still monetize on-premise components. |
Looking at the table, most of the variance ties back to what is included in the revenue definition and how pricing and adoption are projected year over year. By keeping the inputs tied to clear demand indicators and by cross-checking with interview feedback, the final size stays traceable and easier to replicate when assumptions are updated.


Key Questions Answered in the Report
How large will the cloud AI market be by 2031?
It is forecast to reach USD 269.02 billion, expanding at an 18.68% CAGR from 2026 to 2031.
Which segment is growing fastest within cloud AI deployments?
Hybrid and multi-cloud architectures are projected to grow at 22.31% CAGR as data-residency and vendor-diversification needs rise.
Why is healthcare accelerating its use of cloud-based AI?
FDA clearance of 127 AI medical devices in 2025, alongside radiology and ambient-documentation gains, is fueling a 21.07% CAGR for healthcare workloads.
What hardware bottlenecks could impede cloud AI adoption?
Persistent shortages of H100 and MI300X GPUs and limited HBM3 supply have stretched lead times past 12 months, constraining new training projects.
How are smaller firms accessing advanced GPUs?
GPU fractionalization platforms let companies rent one-eighth or one-quarter slices of H100 or MI300X accelerators, cutting hourly costs below USD 2.
Which regions are expected to post the strongest growth?
Asia-Pacific leads with a projected 22.74% CAGR, supported by sovereign-AI mandates and large-scale digital-infrastructure investments.
Page last updated on:





