AR And VR In Defense Market Size and Share
Market Overview
| Study Period | 2019 - 2030 |
|---|---|
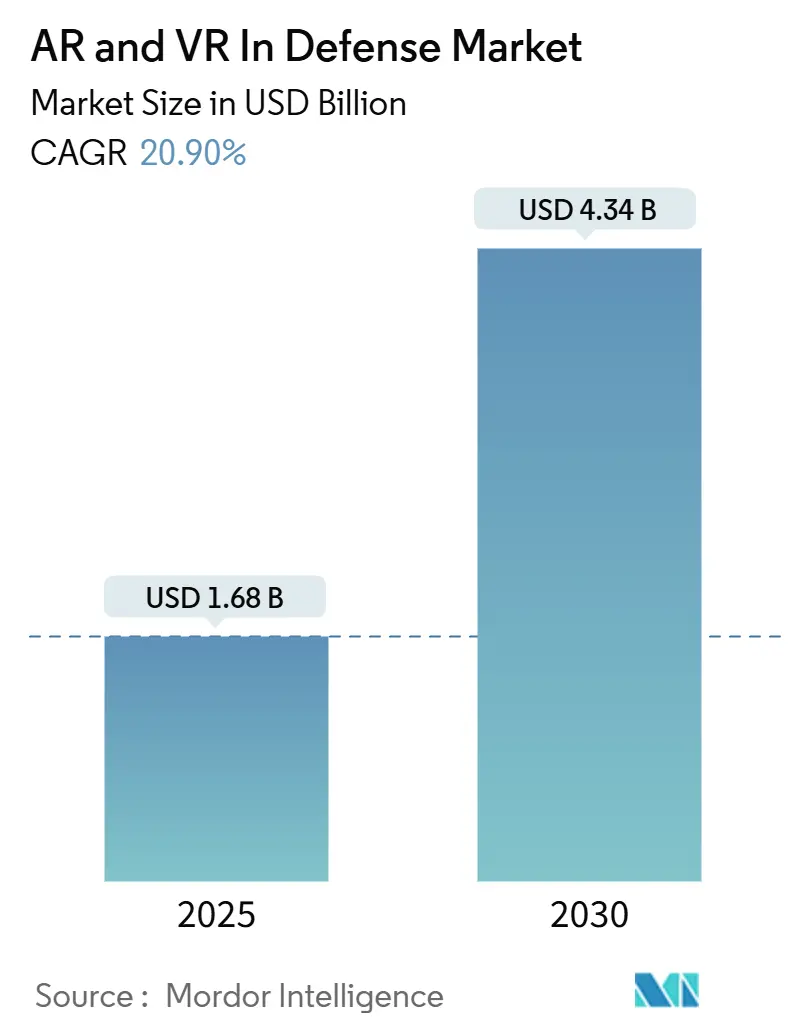
| Market Size (2025) | USD 1.68 Billion |
| Market Size (2030) | USD 4.34 Billion |
| Growth Rate (2025 - 2030) | 20.90% CAGR |
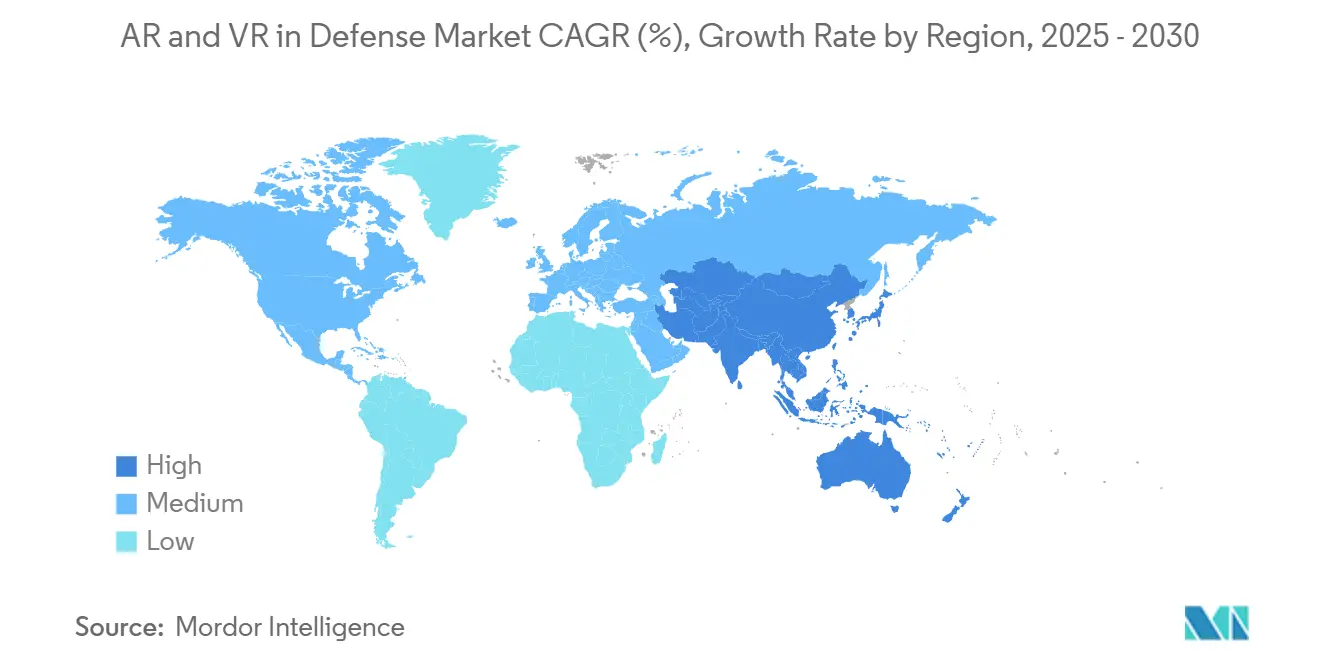
| Fastest Growing Market | Asia Pacific |
| Largest Market | North America |
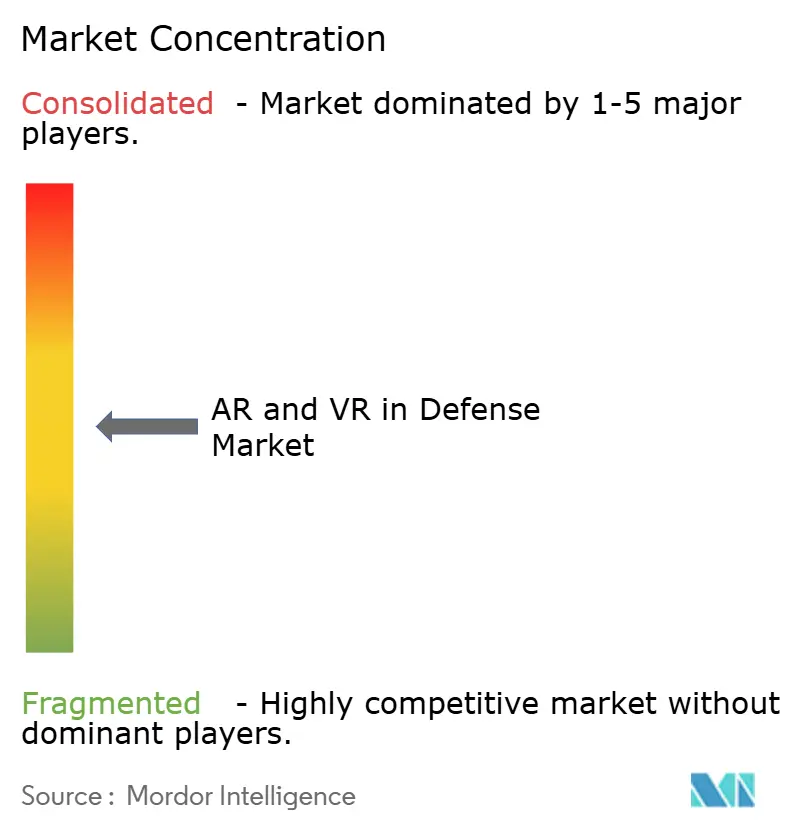
| Market Concentration | Medium |
Major Players *Disclaimer: Major Players sorted in no particular order Image © Mordor Intelligence. Reuse requires attribution under CC BY 4.0. | |
AR And VR In Defense Market Analysis by Mordor Intelligence
The AR and VR in defense market size is valued at USD 1.68 billion in 2025 and is forecasted to reach USD 4.34 billion in 2030, advancing at a 20.9% CAGR. Escalating military allocations for immersive training, the steady rollout of large-scale procurement programs, and rapid improvements in wearable optics collectively sustain an aggressive growth curve. The US, France, Germany, Japan, and Australia anchor demand through multi-year spending plans prioritizing augmented and virtual reality for training, maintenance, and battlefield networking. Platform readiness goals drive preference for software-centric architectures that interface with existing command-and-control systems, while hardware sales accelerate in parallel as domestic manufacturing capacity expands. 5G-enabled edge computing is emerging as a decisive enabler of distributed simulation, opening new revenue pools across joint-force planning, tele-maintenance, and real-time data fusion requirements.
Key Report Takeaways
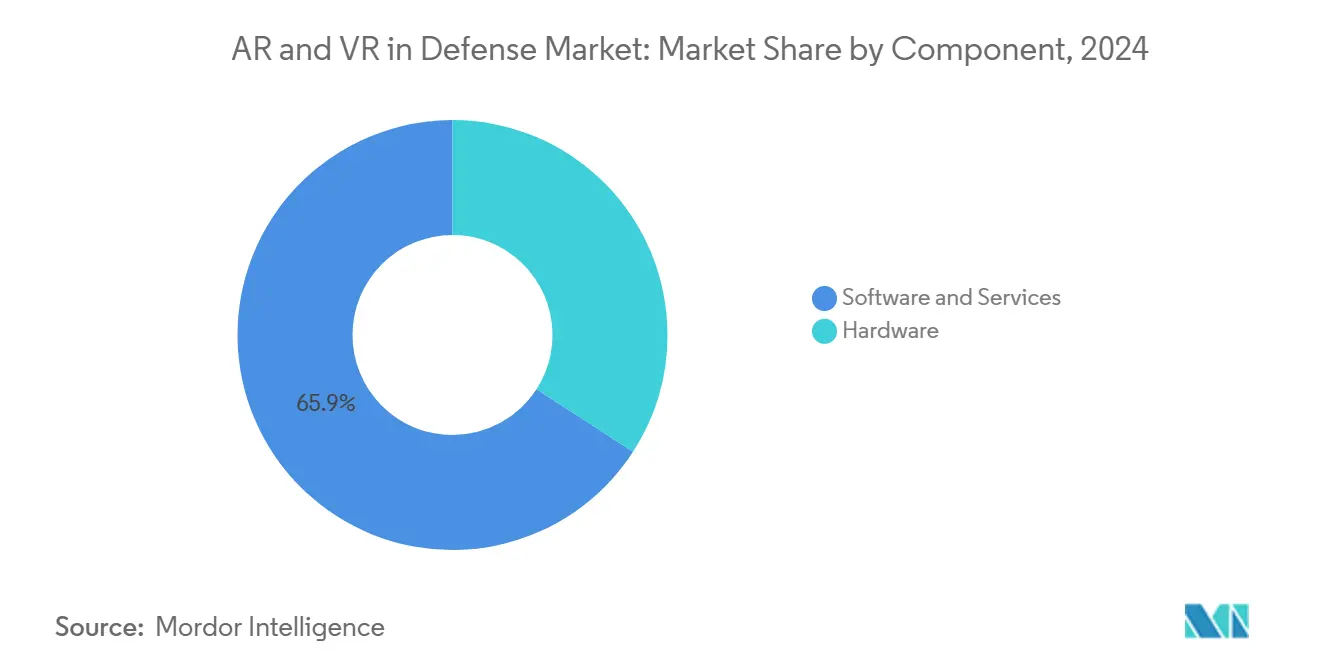
- By component, software and services remain the largest slice at 65.87% of 2024 revenue, while hardware posts the quickest expansion at a 20.55% CAGR through 2030.
- By device type, smart glasses will lead with a 42.45% share in 2024, whereas VR simulators and pods will grow the fastest at a 21.75% CAGR.
- By application, training and simulation dominate in volume at 56.47% of 2024 spending, with situational awareness and battlefield management advancing rapidly at a 22.77% CAGR.
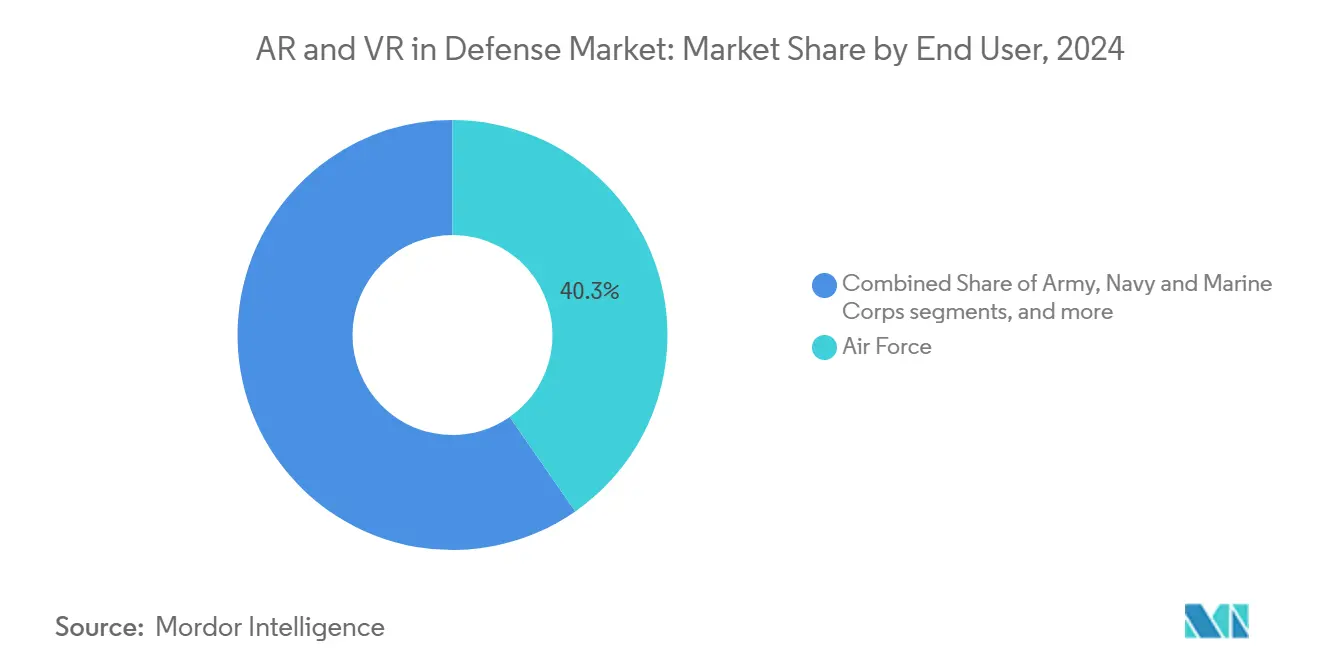
- By end user, air forces account for the highest outlay, 40.32% of 2024 totals, while the navy and marine formations record the strongest growth, 22.31% CAGR.
- By technology, augmented reality commands the largest share at 55.98% in 2024, and Mixed Reality shows the fastest momentum at 20.89% CAGR.
- By geography, North America holds the top position with 42.74% of 2024 global spending, whereas Asia-Pacific delivers the highest growth rate at 21.88% CAGR to 2030.
Global AR And VR In Defense Market Trends and Insights
Drivers Impact Analysis*
| Driver | ( ~) % Impact on CAGR Forecast | Geographic Relevance | Impact Timeline |
|---|---|---|---|
| Surge in defense spending on immersive training | +3.20% | North America, Europe, Asia-Pacific | Medium term (2-4 years) |
| Multi-billion-dollar procurement programs (e.g., IVAS) | +4.10% | North America, European Union | Long term (≥ 4 years) |
| Advances in wearable optics and wider-FOV headsets | +2.80% | Global technology hubs | Short term (≤ 2 years) |
| 5G and edge computing enabling networked simulation | +3.50% | Asia-Pacific core, spill-over to North America and Europe | Medium term (2-4 years) |
| AR-enabled depot MRO cuts platform downtime | +2.40% | Early adoption in North America | Short term (≤ 2 years) |
| Distributed extended reality (XR) mission-planning for joint forces | +2.90% | NATO countries and allies | Medium term (2-4 years) |
| Source: Mordor Intelligence | |||
Surge in Defense Spending on Immersive Training
Global military budgets rose sharply in 2024, and the US alone earmarked more than USD 26 billion a year through 2028 for simulation and training systems.[1]US Army SBIR/STTR Program, “Enhanced Explosive Ordnance Disposal Training Capability,” armysbir.army.mil The US Army’s FY 2025 request includes USD 255 million for 3,000 plus Integrated Visual Augmentation System (IVAS) units, signaling durable institutional support. Parallel increases appear in Europe, where NATO members continue to raise spending commitments, and in Asia-Pacific, Japan’s draft FY2025 defense budget gains 10.5% yearly. Larger outlays accelerate replacement of consumable-heavy live-fire drills with virtual scenarios that compress training cycles and lower ammunition and platform wear.
Multi-billion-Dollar Procurement Programs Drive Market Expansion
Decade-long procurement vehicles provide predictable revenue to suppliers. Following program restructuring, the IVAS contract, valued at USD 21.90 billion, is now open to multiple vendors, including Anduril and Palantir. In Europe, the Franco-German Main Ground Combat System (MGCS) project progressed to Phase 1A in 2025, with France allocating EUR 98 million (USD 115.42 million) for initial development. The European Defence Fund’s FMBTech program, coordinated by Thales, directs EUR 19 million (USD 22.37 million) toward next-generation crew training solutions, setting technical standards that reverberate through partner and allied procurement decisions.
Advances in Wearable Optics Enable Field Deployment
Defense integrators are overcoming weight and optical constraints that once limited head-borne displays. Vuzix fulfilled six-figure waveguide orders for lightweight heads-up displays under multiple US defense contracts, solidifying its status as the only domestic waveguide producer.[2]Vuzix Corporation, “Vuzix Receives Production Order for Customized Waveguides,” vuzix.com Thales introduced a panoramic four-tube night-vision goggle exceeding 120° field-of-view, substantially enlarging situational awareness. Rheinmetall’s collaboration with Lightspace Technologies on multi-focal augmented reality demonstrated reduced eye fatigue during the UK Army Warfighting Experiment.
5G and Edge Computing Transform Networked Simulation
Low-latency, high-bandwidth connectivity is redefining distributed training. Lockheed Martin’s OSIRIS private 5G testbed, funded at USD 19.3 million, linked multiple unmanned air systems (UAS) and radars in live exercises with the US Marine Corps. Booz Allen validated a wireless XR training framework at Fort Cavazos that transmitted biometric data and real-time feedback to remote instructors, demonstrating the operational practicality of untethered deployments. Singtel projects Asia-Pacific XR outlays to hit USD 14.8 billion in 2026 as telco-defense collaborations deepen.
Restraints Impact Analysis*
| Restraint | ( ~) % Impact on CAGR Forecast | Geographic Relevance | Impact Timeline |
|---|---|---|---|
| High upfront and lifecycle costs of ruggedized XR | –2.1% | Global, price-sensitive ministries | Long term (≥ 4 years) |
| Headset ergonomics: weight, battery, FOV limits | –1.8% | Worldwide, affects field deployment | Medium term (2-4 years) |
| Cyber-attack surface of networked XR data streams | –1.5% | Global, acute in contested communication environments | Short term (≤ 2 years) |
| Lack of NATO-wide XR training certification | –1.2% | NATO and partner nations | Long term (≥ 4 years) |
| Source: Mordor Intelligence | |||
High Upfront and Lifecycle Costs Challenge Adoption
Development programs targeting rugged military specifications impose substantial non-recurring engineering, software accreditation, and sustainment costs. IVAS restructuring underscores how performance shortfalls can magnify the total cost of ownership, while European planners debate funding splits in the MGCS roadmap. Lifecycle expenses now encompass cybersecurity patching, optical component refurbishment, and periodic hardware refreshes necessary to remain interoperable with evolving sensor and network standards.
Headset Ergonomics Limit Operational Effectiveness
Units often report weight-induced fatigue, limited battery endurance, and restricted peripheral vision. NATO human-factors research cites motion sickness and eye strain as persistent obstacles to prolonged use of fully immersive devices. Industry responses include multifocal lenses that mimic natural depth perception and battery modules that hot-swap without shutting down critical mission software. Yet, the gap between field requirements and commercially available ergonomics remains material.
*Our forecasts treat driver/restraint impacts as directional, not additive. The impact forecasts reflect baseline growth, mix effects, and variable interactions.
Segment Analysis
By Component: Software and Services Sustain Market Leadership
Software and services captured 65.87% of the AR and VR in defense market share in 2024 because ministries value modular code bases that mesh with legacy command-and-control (C2) networks.[3]ADS Advance, “BISim to Provide US Army Futures Command with Synthetic Environment MPT,” adsadvance.co.uk The segment also benefits from rapid upgrade cycles; developers can field new mission-specific features through routine patches without shipping fresh hardware. These traits lower accreditation timelines and allow forces to tailor scenarios to shifting threat environments on short notice.
Hardware revenues are rising faster at a 20.55% CAGR through 2030 as domestic optics production reduces import exposure and drives unit costs down. Waveguide makers like Vuzix now supply lightweight display engines that meet secure supply chain rules, helping primes replace foreign components while improving optical clarity. As ruggedized batteries and low-power processors mature, the hardware side increasingly complements software platforms rather than lagging behind them.


By Device Type: Smart Glasses Dominate Practical Deployments
Smart glasses held 42.45% of 2024 sales thanks to hands-free operation and lighter frames that fit seamlessly into line maintenance or field support workflows. Their lower power draw supports multi-hour missions, and integrated microphones allow voice-command inputs that speed checklist execution even in high-noise settings. Accessibility pilots, such as the UK Ministry of Defence (MoD) captioning trial, illustrate how the same form factor can broaden workforce participation.
VR simulators and full-motion pods log the quickest expansion at 21.75% CAGR as forces benchmark cost-per-training-hour against live platforms that demand fuel, ammunition, and airspace slot allocations. Armored-crew gunnery modules and naval bridge trainers now combine motion platforms with immersive visuals to replicate stress loads without risking equipment. Planners increasingly view fixed-site simulators as the anchor layer, with deployable smart glasses providing complementary refresh in forward locations.
By Application: Training and Simulation Provide Volume Foundation
Training and simulation delivered 56.47% of the AR and VR in defense market in 2024 because immersive repetition slashes ammunition spend and accelerates skill retention. Integrated ecosystems such as France’s FOMEDEC blend classroom stations with live aircraft to let pilots rehearse complex sorties before takeoff. Similar constructs for armor and artillery shorten certification cycles and ease range-scheduling bottlenecks.
Situational awareness and battlefield management record the sharpest growth at a 22.77% CAGR, fueled by sensor-fusion engines that stream blue-force positions and threat alerts onto see-through displays. Edge-computing nodes crunch imagery in real time, so squad leaders receive visual overlays rather than radio calls. Commanders value shifting from reactive voice updates to proactive prompts that keep units inside adversaries’ decision loops.
By End User: Air Forces Are Early Adopters
Air forces accounted for 40.32% of 2024 expenditures, leveraging decades of simulator culture to fold mixed-reality cockpits into undergraduate pilot syllabi. Reduced live-flight hours translate into fuel savings and airframe life extension, while embedded analytics measure trainee cognitive load to personalize lesson pacing. The same infrastructure now supports boom-operator and crew-chief drills, widening return on simulator capital.
Navy and marine formations trail closely, projecting 22.31% CAGR as 5G maritime testbeds like OSIRIS prove stable over saltwater environments. Amphibious units mix VR rehearsals for beach-landing sequences with AR deck-handling aids overlaying aircraft tie-down points during night ops. Army units remain steady adopters for infantry marksmanship and combat-medic scenarios, though procurement cycles often track broader modernization budgets.

By Technology: Augmented Reality Retains Versatility
AR produced 55.98% of 2024 revenue because overlaying digital cues on real-world scenes preserves situational context during maintenance, navigation, and live-fire scoring. Users avoid the disorientation of full occlusion while accessing interactive call-outs, which boosts task accuracy and safety. The technology also works on lighter optics, helping crews wear systems for an entire duty shift.
MR posts the fastest climb at 20.89% CAGR as multi-focal lenses and depth-sensing AI merge spatial anchoring with opaque holograms, enabling vehicle crews to “see through” armor when docking or traversing confined areas. VR maintains a strong niche for high-risk tasks—such as carrier landings in rough seas—where zero distraction from the physical world is essential. Together, the trio of modalities now forms a layered toolkit that commanders match to mission phase and environment.
Geography Analysis
North America generated 42.74% of 2024 revenue, underpinned by the US defense budget that exceeds USD 800 billion and funds multibillion-dollar XR programs. Canada and allied industrial-base partnerships reinforce regional capacity, while Mexico’s security modernization invites pilot projects in border surveillance.
Asia-Pacific is the fastest-growing territory, with a 21.88% CAGR to 2030. China’s USD 314 billion allocation, Japan’s 10.5% budget jump, and Australia’s drive for sovereign capability generate sustained procurement opportunities. Indigenous suppliers increasingly collaborate with US primes to satisfy domestic content rules, accelerating technology transfer and local waveguide fabrication.
Europe’s coordinated initiatives, including MGCS and the European Defence Fund, combine with Germany’s off-budget EUR 500 billion (USD 588.80 billion) fund to foster demand for interoperable AR/VR that supports multinational task forces. Interoperability requirements across Future Combat Air System (FCAS) partners encourage open-architecture software that attracts smaller niche vendors.

Competitive Landscape
The AR and VR in defense market shows moderate concentration. Established prime contractors wield incumbency advantages in large-scale integration, while specialist optics and software firms infuse rapid innovation. Lockheed Martin’s 5G-XR integration, Rheinmetall-Lightspace’s multi-focal displays, and Hololight-Oversight’s 3D collaboration all point to a partnership-oriented playbook favouring dual-expertise teams.[4]Hololight, “Strategic Partnership to Transform AR Solutions for Defense and Security,” hololight.com
Vuzix secures strategic positioning as the sole domestic waveguide manufacturer and benefits from continuous six-figure defense orders. Emerging entrants, such as Anduril, leverage venture capital to iterate quickly and meet modular open-system architectures demanded by revamped procurement guidelines. Cybersecurity accreditation and International Traffic in Arms Regulations (ITAR) compliance remain substantial entry barriers.
AR And VR In Defense Industry Leaders
Microsoft Corporation
BAE Systems plc
Lockheed Martin Corporation
CAE Inc.
Thales Group
- *Disclaimer: Major Players sorted in no particular order

Recent Industry Developments
- May 2025: Anduril and Meta partnered to develop integrated XR products for military applications. These products aim to enhance battlefield perception and provide intuitive control of autonomous systems for military personnel.
- March 2025: Vuzix's subsidiary Moviynt gained Airbus Helicopters' commitment to deploy smart-glasses solutions across North American distribution sites.
- May 2024: Sigma Defense Systems secured a USD 4.7 million task order to develop a VR intelligence training ecosystem for the US Army.


Global AR And VR In Defense Market Report Scope
| Hardware |
| Software and Services |
| Head-Mounted Displays (HMDs) |
| Head-Up Displays (HUDs) |
| Smart Glasses |
| VR Simulators/Pods |
| Handheld and Tablets |
| Training and Simulation |
| Maintenance, Repair and Overhaul (MRO) |
| Situational Awareness and Battlefield Management |
| Mission Planning and Rehearsal |
| Medical Training and Rehabilitation |
| Design and Prototyping |
| Army |
| Air Force |
| Navy and Marine Corps |
| Special Operations Forces |
| Homeland Security and Law Enforcement |
| Augmented Reality (AR) |
| Virtual Reality (VR) |
| Mixed Reality (MR) |
| North America | United States | |
| Canada | ||
| Mexico | ||
| Europe | United Kingdom | |
| France | ||
| Germany | ||
| Italy | ||
| Rest of Europe | ||
| Asia-Pacific | China | |
| India | ||
| Japan | ||
| South Korea | ||
| Australia | ||
| Rest of Asia-Pacific | ||
| South America | Brazil | |
| Rest of South America | ||
| Middle East and Africa | Middle East | Saudi Arabia |
| United Arab Emirates | ||
| Israel | ||
| Rest of Middle East | ||
| Africa | South Africa | |
| Rest of Africa | ||
| By Component | Hardware | ||
| Software and Services | |||
| By Device Type | Head-Mounted Displays (HMDs) | ||
| Head-Up Displays (HUDs) | |||
| Smart Glasses | |||
| VR Simulators/Pods | |||
| Handheld and Tablets | |||
| By Application | Training and Simulation | ||
| Maintenance, Repair and Overhaul (MRO) | |||
| Situational Awareness and Battlefield Management | |||
| Mission Planning and Rehearsal | |||
| Medical Training and Rehabilitation | |||
| Design and Prototyping | |||
| By End User | Army | ||
| Air Force | |||
| Navy and Marine Corps | |||
| Special Operations Forces | |||
| Homeland Security and Law Enforcement | |||
| By Technology | Augmented Reality (AR) | ||
| Virtual Reality (VR) | |||
| Mixed Reality (MR) | |||
| By Geography | North America | United States | |
| Canada | |||
| Mexico | |||
| Europe | United Kingdom | ||
| France | |||
| Germany | |||
| Italy | |||
| Rest of Europe | |||
| Asia-Pacific | China | ||
| India | |||
| Japan | |||
| South Korea | |||
| Australia | |||
| Rest of Asia-Pacific | |||
| South America | Brazil | ||
| Rest of South America | |||
| Middle East and Africa | Middle East | Saudi Arabia | |
| United Arab Emirates | |||
| Israel | |||
| Rest of Middle East | |||
| Africa | South Africa | ||
| Rest of Africa | |||


Key Questions Answered in the Report
How large is the AR VR defense space in 2025, and what growth rate is expected through 2030?
Spending reaches USD 1.68 billion in 2025 and is projected to climb at a 20.9% CAGR to USD 4.34 billion by 2030.
Which application accounts for the biggest share of current defense XR spending?
Training and simulation hold 56.47% of 2024 revenue thanks to proven savings on ammunition, fuel, and asset wear.
What device category is most widely adopted by armed forces today?
Smart glasses capture 42.45% of 2024 sales because their light weight and hands-free design suit field tasks.
Which armed-service branch invests the most in immersive technologies?
Air forces lead with 40.32% of 2024 spending, leveraging mixed-reality cockpits and maintenance viewers.
Why is North America considered the prime buyer region?
A defense budget above USD 800 billion and programs like IVAS give North America 42.74% of 2024 global outlays.
How are 5G and edge computing changing XR adoption on the battlefield?
Low-latency private networks now support distributed, real-time training and mission planning across dispersed units.
What remains the chief barrier to widescale deployment of rugged headsets?
High upfront and lifecycle costs—covering hardware, cybersecurity, and periodic tech refresh—still slow adoption, especially for smaller forces.
Page last updated on:


