Electronic Warfare Market Size and Share
Market Overview
| Study Period | 2020 - 2031 |
|---|---|
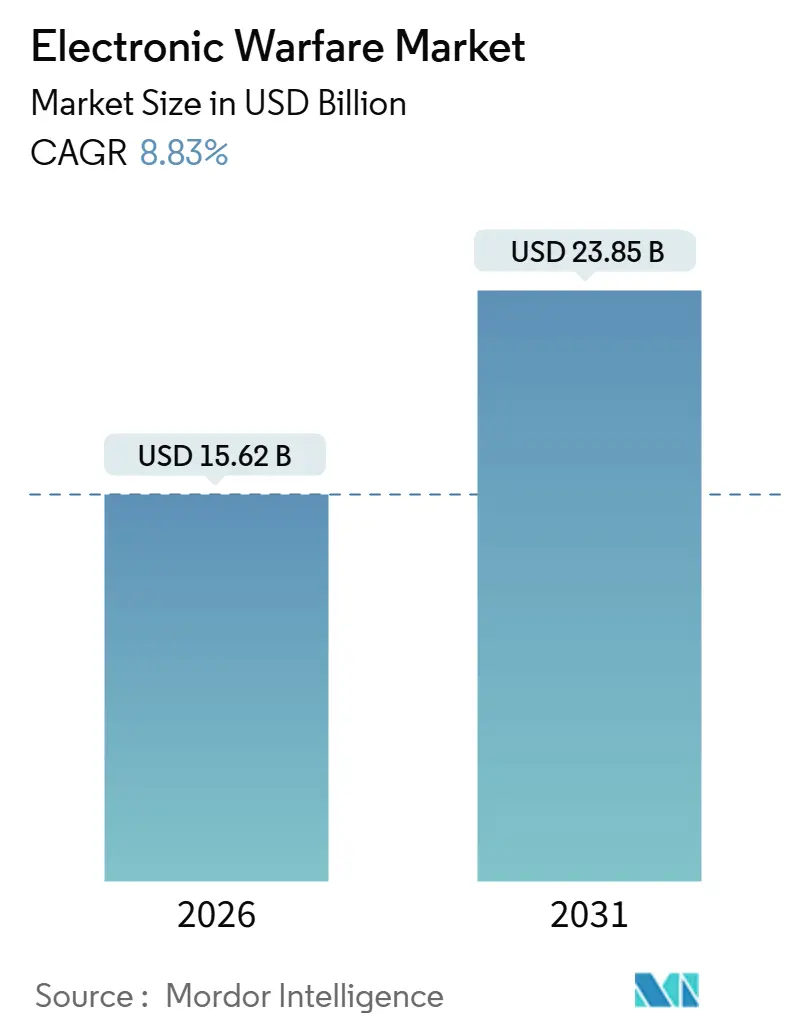
| Market Size (2026) | USD 15.62 Billion |
| Market Size (2031) | USD 23.85 Billion |
| Growth Rate (2026 - 2031) | 8.83% CAGR |
| Fastest Growing Market | North America |
| Largest Market | Asia Pacific |
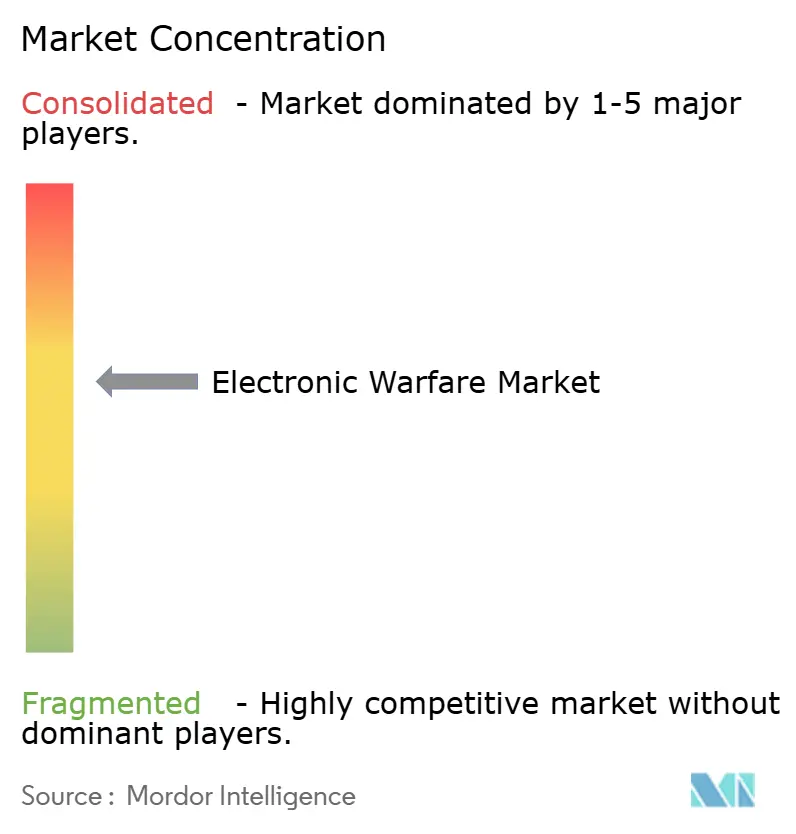
| Market Concentration | Medium |
Major Players *Disclaimer: Major Players sorted in no particular order Image © Mordor Intelligence. Reuse requires attribution under CC BY 4.0. | |
Electronic Warfare Market Analysis by Mordor Intelligence
The electronic warfare market size reached USD 15.62 billion in 2026 and is forecasted to reach USD 23.85 billion by 2031, advancing at an 8.83% CAGR. Rising investments in spectrum-dominance programs, incremental retrofit budgets, and the surge of counter-unmanned systems are repositioning the electronic warfare market as a priority spend category for major and emerging militaries alike. Airborne and naval platforms remain the revenue backbone, yet orbital and land-based applications are attracting new allocations as adversaries probe new parts of the spectrum. Contract momentum is most substantial for software-defined architectures that can pivot between electronic attack, protection, and support without hardware swaps. This trend favors modular suppliers over traditional line-replaceable-unit vendors. Budget-constrained operators are leaning on retrofit programs that slot gallium-nitride (GaN) amplifiers and cognitive algorithms into existing pods, compressing integration timelines and boosting unit affordability. Meanwhile, tightening export-control regimes threaten to fragment the electronic warfare market into regional supply chains, adding complexity to multinational programs while creating openings for indigenous champions.
Key Report Takeaways
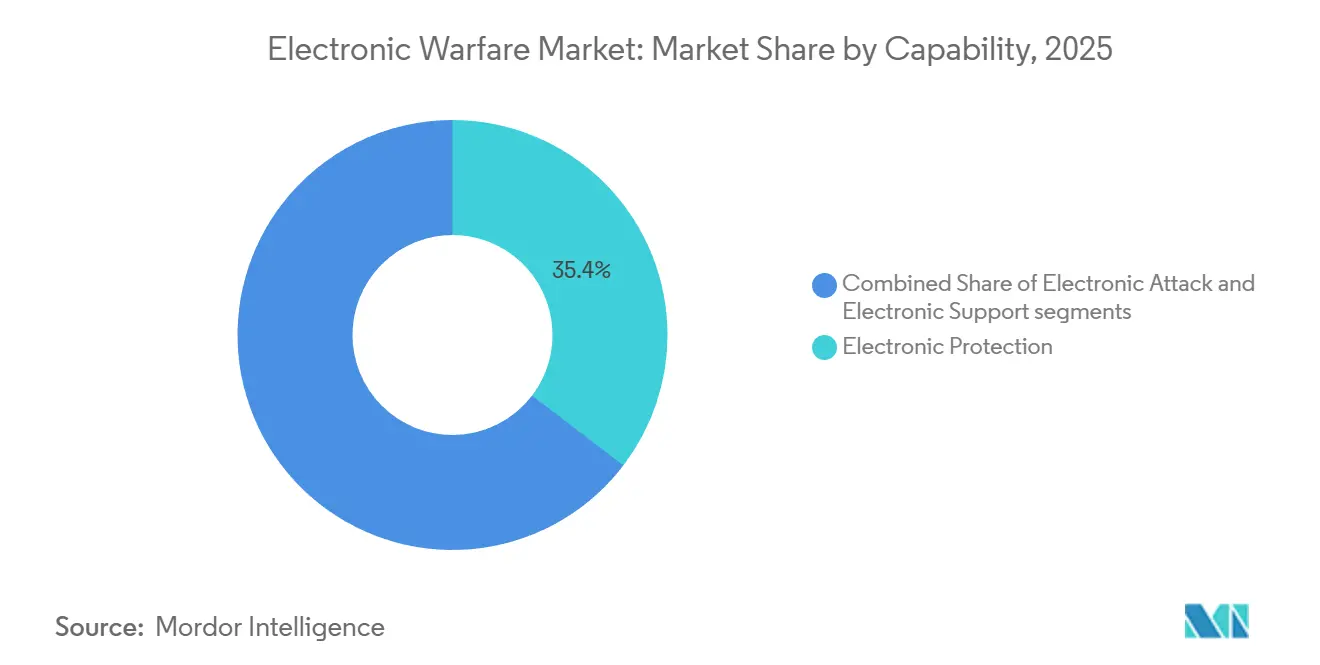
- By capability, electronic protection commanded 35.37% of the electronic warfare market share in 2025, while electronic attack is projected to expand at a 9.16% CAGR to 2031.
- By platform, air systems led with a 35.21% revenue share in 2025; space-based electronic warfare is forecasted to post the highest growth rate at a 9.37% CAGR.
- By equipment, counter-UAS EW suites represented a smaller installed base in 2025 but are set to grow at a 9% CAGR, outpacing jammer systems and radar warning receivers.
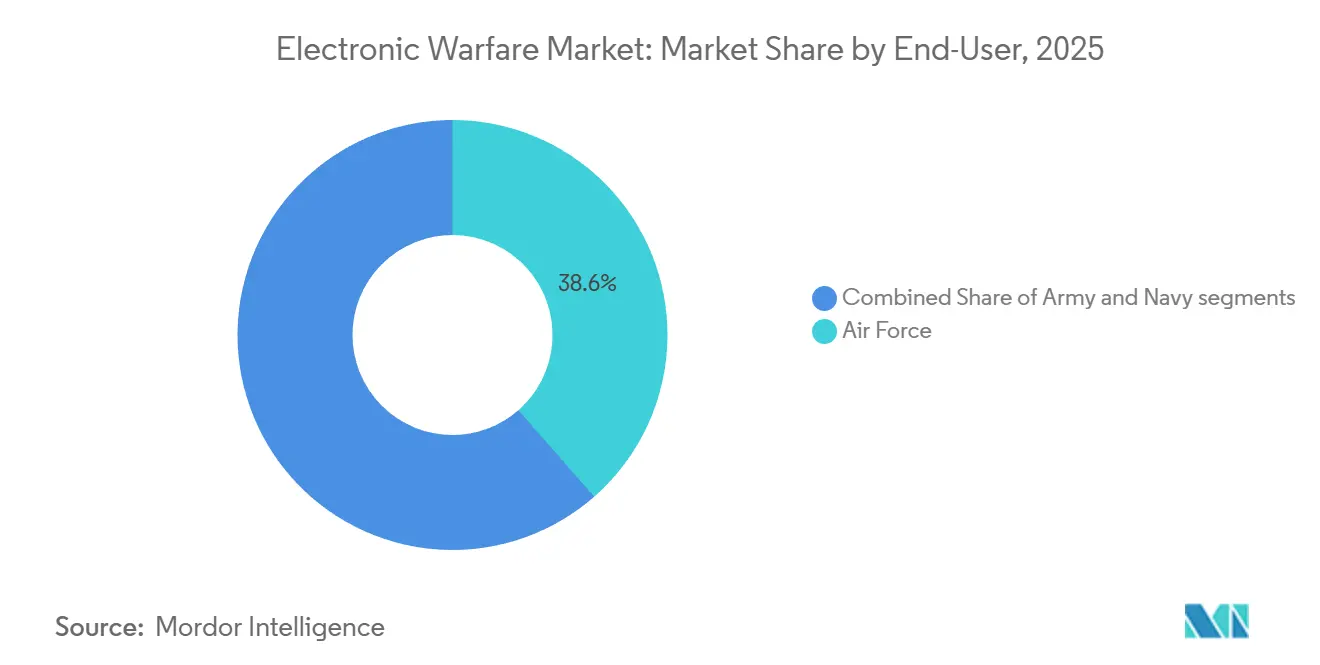
- By end user, air forces accounted for 38.55% of demand in 2025 and are expected to sustain a 9.06% CAGR through 2031.
- By fit, retrofit and upgrade programs captured 55.30% share of the electronic warfare market size in 2025 and are advancing at a 9.23% CAGR.
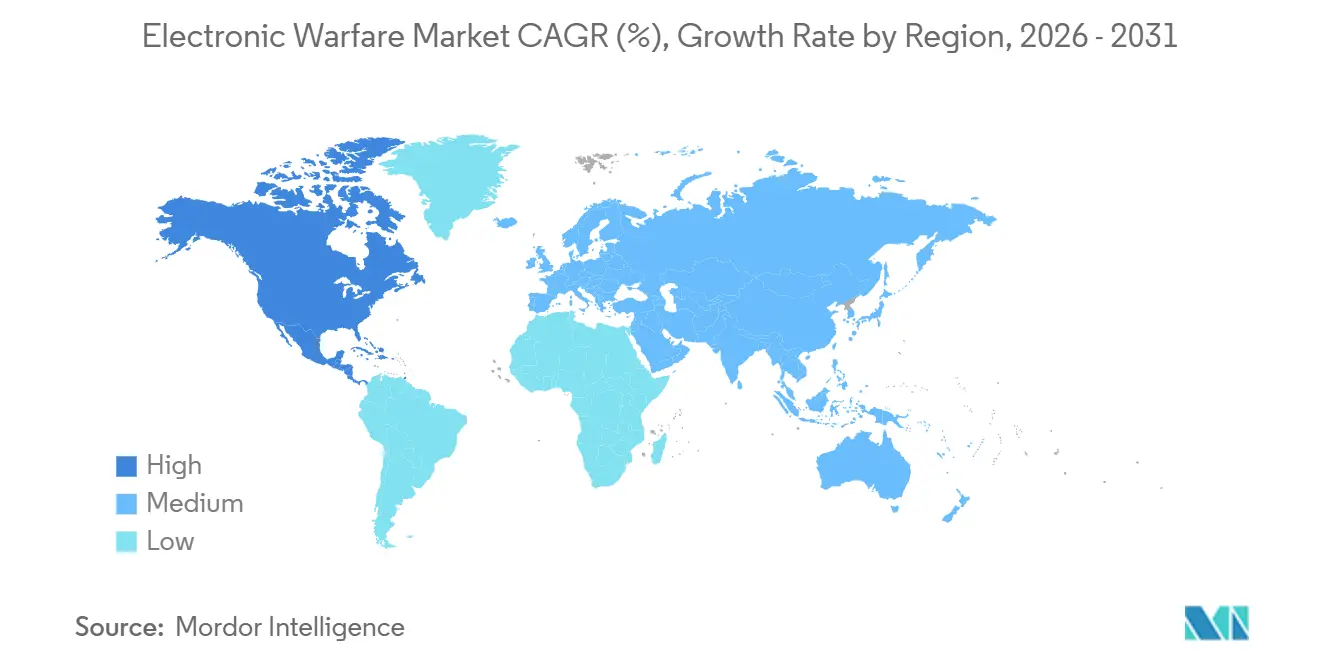
- By geography, North America led with 40.46% revenue share in 2025 and is on track for 9.42% CAGR, the fastest among all regions.
Note: Market size and forecast figures in this report are generated using Mordor Intelligence’s proprietary estimation framework, updated with the latest available data and insights as of 2026.
Global Electronic Warfare Market Trends and Insights
Drivers Impact Analysis*
| Driver | (%) Impact on CAGR Forecast | Geographic Relevance | Impact Timeline |
|---|---|---|---|
| Escalating geopolitical tensions and defense modernization | +2.1% | Global, with concentration in Eastern Europe, Indo-Pacific, Middle East | Medium term (2-4 years) |
| Surge in unmanned platforms requiring EW payloads | +1.8% | Global, led by North America and Asia-Pacific | Short term (≤ 2 years) |
| Evolution of radar/comm threats necessitating advanced EW | +1.6% | Global, particularly NATO and Asia-Pacific allies | Long term (≥ 4 years) |
| COTS GaN enabling low-SWaP EW on small drones | +1.4% | North America, Europe, Asia-Pacific | Short term (≤ 2 years) |
| AI/ML-driven cognitive EW for adaptive jamming | +1.2% | North America, Europe, select Asia-Pacific markets | Medium term (2-4 years) |
| Asymmetric warfare tactics are driving demand for flexible EW systems | +1.0% | Middle East and Africa, South America | Short term (≤ 2 years) |
| Source: Mordor Intelligence | |||
Escalating Geopolitical Tensions and Defense Modernization
Russia’s battlefield jamming in Ukraine compelled NATO armies to rush orders for stand-in jammers and spectrum-resilient radios, resetting procurement cycles toward continuous capability insertion. The US Army’s USD 100 million Terrestrial Layer System contract, awarded in 2024, typifies demand for man-portable kits that integrate electronic support, attack, and cyber effects on a single chassis. Japan’s defense strategy in 2025 prioritizes record budget allocations toward F-35A electronic countermeasure upgrades aimed at addressing advanced frequency-hopping radar systems deployed by the Chinese Ministry of Defense. The Gulf states are expanding airborne early warning fleets to surveil congested EM environments along critical shipping lanes. These moves elevate spectrum dominance to parity with air and maritime superiority, cementing an investment baseline that supports long-run growth of the electronic warfare market.
Surge in Unmanned Platforms Requiring EW Payloads
Commercial quadcopters armed with improvised munitions now threaten multi-billion-dollar capital ships, forcing navies to install shipboard counter-UAS suites as standard fit rather than mission kits. Lockheed Martin’s Sanctum and Elbit’s ReDrone integrate RF detection, protocol analysis, and targeted jamming in man-portable packages that commanders can deploy in minutes. Offensive drone swarms are also being equipped with miniature GaN amplifiers that broadcast deceptive signals, saturating enemy defenses at a fraction of the cost. The bidirectional proliferation of unmanned systems is driving double-digit unit orders even as broader defense budgets flatten, sustaining momentum for counter-UAS segments of the electronic warfare market.
Evolution of Radar and Communication Threats
Adversaries deploy agile waveforms and quantum-resilient links that defeat legacy noise jamming. Programs such as DARPA’s Adaptive Radar Countermeasures use machine learning (ML) libraries to identify unknown emitters within milliseconds, then tailor response waveforms.[1]Stephen Frahm, “Adaptive Radar Countermeasures,” Rand.org Emerging quantum radar further challenges stealth assets, forcing investments in broader-band decoys and digital radio frequency memory techniques. The military integration of 5G and early 6G adds complexity because EW suites must simultaneously cover sub-6 GHz and mm-wave bands. Consequently, research budgets emphasize software-defined architectures capable of remote re-parameterization via over-the-air (OTA) updates.
COTS GaN Enabling Low-SWaP EW on Small Drones
Gallium-nitride (GaN) devices deliver higher power density than gallium-arsenide and silicon, allowing broadband electronic-attack payloads in footprints suited to quad-copters or loitering munitions.[2]Duncan Tift, “GaN broadens low-SWaP horizons,” IEEE.org Commercial availability compresses cost curves, letting mid-tier suppliers enter the electronic warfare industry with niche solutions. One obstacle is China’s 98% share of the gallium supply, prompting Western allies to stockpile and seek alternative refining hubs. Despite supply-risk hedging, GaN adoption remains pivotal for extending electronic warfare coverage to every echelon, from squad-level drones to hypersonic glide vehicles.
Restraints Impact Analysis*
| Restraint | (%) Impact on CAGR Forecast | Geographic Relevance | Impact Timeline |
|---|---|---|---|
| High program cost and long development cycles | -1.5% | Global, most acute in North America and Europe | Long term (≥ 4 years) |
| Spectrum management and regulatory hurdles | -0.9% | North America, Europe, select APAC markets | Medium term (2-4 years) |
| Cyber-enabled spoofing vulnerability of EW suites | -0.7% | Global | Short term (≤ 2 years) |
| Tightening export controls on advanced semiconductors | -0.6% | Global, particularly affecting China and Russia | Medium term (2-4 years) |
| Source: Mordor Intelligence | |||
High Program Cost and Long Development Cycles
The US Navy’s Next Generation Jammer took 11 years to reach initial operational capability because integrating high-power transmitters without disrupting on-board sensors required extensive flight testing. Italy’s USD 300 million order for two EA-37B aircraft in 2025 underscores the capital-intensive nature of purpose-built jamming platforms that carry no kinetic weapons. These headline prices push ministries toward incremental upgrades that favor modular retrofit vendors over prime contractors dependent on clean-sheet aircraft. Contractors must also finance secure test ranges to evaluate classified threat waveforms before contracts are guaranteed, elevating balance-sheet risk and diluting margins across the electronic warfare market.
Spectrum Management and Regulatory Hurdles
Defense transmitters now share C-band and Ka-band real estate with 5G towers and commercial satellites, amplifying interference disputes. The FCC’s 2024 ruling on C-band sharing forces US programs to embed dynamic spectrum-access algorithms that were never part of their original scope, inflating budgets midstream. NATO’s plan to reserve spectrum for large-scale electronic-attack training has stalled amid objections from satellite operators, cutting realistic exercise windows for member forces. Dense civilian spectrum use in Europe and North America leaves limited headroom, compelling designers to bake in extra agility that increases component count and cost, thereby tempering the growth of the electronic warfare market.
*Our forecasts treat driver/restraint impacts as directional, not additive. The impact forecasts reflect baseline growth, mix effects, and variable interactions.
Segment Analysis
By Capability: Offensive Jamming Gains Doctrinal Priority
Electronic protection retained a 35.37% share in the electronic warfare market during 2025, as every platform still requires self-defense receivers and dispensers. However, the electronic warfare market for electronic attack is projected to expand fastest at a 9.16% CAGR through 2031, driven by stand-in jamming concepts that embed high-power transmitters on expendable drones that penetrate enemy air defenses. L3Harris’s USD 587 million Next Generation Jammer Low-Band award underscores demand for wideband pods that merge attack with support, blurring internal capability lines.
Second-generation protection suites now fuse infrared and RF sensors, but incremental performance gains are shrinking, slowing revenue velocity for this mature segment. Electronic support is climbing as miniaturized SDRs enable geolocation payloads on Group 2 drones, creating low-cost options for tactical commanders. Integration of cognitive algorithms enables a single aperture to auto-switch from threat detection to jamming within milliseconds, reducing SWaP and providing a compelling value proposition that accelerates cross-segment adoption in the electronic warfare market.


By Platform: Orbit Joins the Fight
Air systems delivered 35.21% of 2025 revenue, reflecting sustained upgrade cycles for F-35, EA-18G, and legacy fighters. Yet the electronic warfare market for space platforms is forecasted to grow at a 9.37% CAGR, as satellite constellations have become both high-value targets and persistent jamming nodes. The US Space Force is financing studies on payloads that can deny adversary communications without violating orbital debris protocols, adding a fresh stream of contracts through the decade.
Sea platforms benefit from steady shipbuilding budgets: Northrop Grumman’s SEWIP Block 3 replaces analog SLQ-32s with AESA arrays on US surface combatants, with installations starting on Arleigh Burke-class destroyers like the USS Pinckney. Land fleets are refreshing mobile jammers as armies confront drone swarms and GPS denial. Platform diversification spreads risk and enables suppliers to reallocate resources, reinforcing stable, long-term growth in the electronic warfare market.
By Equipment: Counter-UAS Suites Redefine Priorities
Counter-UAS suites are forecasted to expand at a 9% CAGR, the highest within equipment classes, because low-cost drones threaten everything from runways to oil terminals. Elbit’s ReDrone and Lockheed Martin’s Sanctum integrate detection, classification, and nulling functions in a backpack-sized form factor, illustrating buyer preference for turnkey kits. Jammer systems retain the largest revenue pool, but commoditization is squeezing unit margins.
The electronic warfare market size for radar warning receivers is transitioning to digital designs that offer finer frequency resolution and faster threat reaction, delivering a modest uplift in retrofit demand. Directed-energy systems like Raytheon’s Leonidas moved from test to initial fielding in 2024, positioning high-power microwave modules as future complements to RF jammers for drone defeat. Other equipment, including decoys and expendables, will continue to grow yet remain integral to holistic force-protection architectures.
By End-User: Air Force Leads Naval Modernization
Air force customers owned 38.55% of 2025 revenue, underscoring sustained investment in podded systems for fifth-generation fighters and autonomous wingmen that must survive GPS-denied missions. Digital backbones push firmware updates over encrypted links. At the same time, jets remain on the flight line, compressing sustainment timelines as sixth-generation programs embed fully integrated sensor-fusion suites from day one. The F-35’s AN/ASQ-239 integrates attack, protection, and support in a single aperture, setting the benchmark for future fighters and driving copy programs worldwide.
Navies concentrate spending in SEWIP Block 3 and submarine masts, whereas armies prioritize tactical jammers that can ride on infantry vehicles. Convergence around joint waveforms enables shared development roadmaps, lowers life-cycle costs, and reinforces the electronic warfare market’s prospects across service branches.
By Fit: Retrofit Outpaces OEM Delivery
Retrofit captured 55.30% of 2025 revenue, and the electronic warfare market share for upgrades is projected to remain dominant through 2031 as operators extend the life of fourth-generation platforms instead of buying new airframes. The US Air Force’s F-16 ALQ-211 installation program demonstrates that a fractional budget can unlock near-peer capability at squadron scale.
OEM installations command higher margins but are constrained by slower airframe production rates; Boeing’s EA-18G line is already tapering, with no funded successor. Modular open-systems standards such as SOSA and CMOSS reduce integration risk during upgrades, allowing primes to drop in new antennas or processors without re-qualifying entire pods. This technical flexibility underpins the long-run dominance of retrofit in the electronic warfare market.
Geography Analysis
North America held 40.46% of 2025 revenue and is expected to grow at a 9.42% CAGR, the fastest among all regions. The US DoD's USD 842 billion FY 2025 budget allocates significant funding to Joint All-Domain Command and Control (JADC2) initiatives that require real-time spectrum management tools. Canada's F-35 procurement embeds advanced EW into its fighter recapitalization, while Mexico invests in airborne SIGINT for counter-narcotics operations.
Europe is pivoting from fragmented national efforts to pooled capability development. The Eurofighter Electronic Attack variant, financed by the UK and Germany, will integrate Saab's Arexis suite and Northrop Grumman's AARGM missiles by 2030, adding a dedicated SEAD asset to NATO.[3]Royal Air Force, “Eurofighter Electronic Attack Programme,” raf.mod.uk Italy, Japan, and the UK's Global Combat Air Programme (GCAP) has named Leonardo and ELT Group as co-primes for integrated sensing and non-kinetic effects, embedding cognitive EW from program inception. France's Rafale F5 standard upgrades Thales's SPECTRA suite for enhanced jamming, keeping the platform competitive in denied environments.
Asia-Pacific demand is accelerating as China fields advanced air-defense complexes. India's DRDO is maturing airborne and shipborne suites for Tejas and destroyers while bridging gaps with Israeli hardware. Japan's FY 2025 record budget funds F-35 EW upgrades and counter-space systems to mitigate satellite jamming. South Korea's KF-21 fighter and Sejong-class destroyer programs include indigenous EW to reduce reliance on imports. Australia leverages the AUKUS pact to develop submarine EW and signals intelligence with BAE Systems integration.[4]Australian Department of Defence, “Signals Intelligence and EW Projects,” defence.gov.au Middle Eastern customers split focus: Israel emphasizes offensive jamming, whereas Gulf states invest in electronic support and counter-drone defenses. South America and Africa remain early-stage adopters, with Brazil and South Africa making limited niche purchases.

Competitive Landscape
The electronic warfare market shows moderate concentration as the top five primes, namely Lockheed Martin, Northrop Grumman, RTX, L3Harris, and BAE Systems, control roughly 60% of global revenue through multi-year platform programs. Lockheed Martin’s USD 587 million Next Generation Jammer Low-Band award and Northrop Grumman’s SEWIP Block 3 contracts highlight their grip on large program-of-record budgets. However, modular open-systems rules are eroding incumbent advantages; Mercury Systems and HENSOLDT win retrofit deals by offering COTS GaN hardware and software-defined waveforms that slot into legacy pods with minimal re-qualification.
Strategic moves emphasize vertical integration: RTX purchased GaN foundry capacity to secure power-amplifier supply, while L3Harris invested in FPGA tooling to tighten hardware-software synergy. Primes are collaborating with academia and AI startups to accelerate cognitive-jammer algorithms, mitigating in-house software gaps. Export-control tightening splinters markets; Wassenaar rules restrict dual-use transfers to China and Russia, enabling indigenous champions such as Bharat Electronics and ASELSAN to win domestic tenders free from Western competition. Competitive intensity is highest in counter-UAS and retrofit arenas where smaller players can iterate faster than traditional program cycles, ensuring a dynamic pipeline of challengers in the electronic warfare market.
Electronic Warfare Industry Leaders
Lockheed Martin Corporation
Northrop Grumman Corporation
RTX Corporation
L3Harris Technologies, Inc.
BAE Systems plc
- *Disclaimer: Major Players sorted in no particular order

Recent Industry Developments
- August 2025: L3Harris and Joby Aviation launched a hybrid-VTOL demonstrator to host EW payloads, with flight tests slated for the last quarter of 2025.
- July 2025: Italy inked the first EA-37A export agreement with L3Harris, signaling European appetite for advanced stand-off jamming suites.
- April 2025: UAE-based EDGE Group widened its Brazilian presence through counter-drone and missile-defense accords, broadening EW reach in South America.
- February 2025: L3Harris teamed with Shield AI to co-develop AI-powered EW systems for adaptive jamming.
- January 2025: Elbit Systems secured a USD 80 million order to upgrade F-16I Sufa EW suites with advanced jamming and support functions.


Global Electronic Warfare Market Report Scope
Electronic Warfare involves using electromagnetic spectrum signals, such as radio, infrared, and radar, to attack or impede enemy operations. Moreover, electronic warfare can help disrupt, deny, and degrade enemy forces' ability to use such electromagnetic signals.
The electronic warfare market is segmented by capability, platform, equipment, end-user, fit, and geography. By capability, the market is segmented into electronic attack, electronic protection, and electronic support. By platform, the market is segmented into air, sea, land, and space. By equipment, the market is segmented into jammer systems, radar warning receivers, directed energy weapons, counter-UAS EW suites, and other equipment. By end-user, the market is segmented into Air Force, Navy, and Army. By fit, the market is segmented into OEM and retrofit/upgrades. The report also covers the market sizes and forecasts for the electronic warfare market in major countries across different regions. For each segment, the market size is provided in terms of value (USD).
| Electronic Attack |
| Electronic Protection |
| Electronic Support |
| Air |
| Sea |
| Land |
| Space |
| Jammer Systems |
| Radar Warning Receivers |
| Directed Energy Weapons |
| Counter-UAS EW Suites |
| Other Equipments |
| Air Force |
| Navy |
| Army |
| OEM |
| Retrofit/Upgrades |
| North America | United States | |
| Canada | ||
| Mexico | ||
| Europe | United Kingdom | |
| France | ||
| Germany | ||
| Russia | ||
| Rest of Europe | ||
| Asia-Pacific | China | |
| India | ||
| Japan | ||
| South Korea | ||
| Rest of Asia-Pacific | ||
| South America | Brazil | |
| Rest of South America | ||
| Middle East and Africa | Middle East | Saudi Arabia |
| United Arab Emirates | ||
| Turkey | ||
| Rest of Middle East | ||
| Africa | South Africa | |
| Rest of Africa | ||
| By Capability | Electronic Attack | ||
| Electronic Protection | |||
| Electronic Support | |||
| By Platform | Air | ||
| Sea | |||
| Land | |||
| Space | |||
| By Equipment | Jammer Systems | ||
| Radar Warning Receivers | |||
| Directed Energy Weapons | |||
| Counter-UAS EW Suites | |||
| Other Equipments | |||
| By End-User | Air Force | ||
| Navy | |||
| Army | |||
| By Fit | OEM | ||
| Retrofit/Upgrades | |||
| By Geography | North America | United States | |
| Canada | |||
| Mexico | |||
| Europe | United Kingdom | ||
| France | |||
| Germany | |||
| Russia | |||
| Rest of Europe | |||
| Asia-Pacific | China | ||
| India | |||
| Japan | |||
| South Korea | |||
| Rest of Asia-Pacific | |||
| South America | Brazil | ||
| Rest of South America | |||
| Middle East and Africa | Middle East | Saudi Arabia | |
| United Arab Emirates | |||
| Turkey | |||
| Rest of Middle East | |||
| Africa | South Africa | ||
| Rest of Africa | |||


Key Questions Answered in the Report
How large will the electronic warfare market be by 2031?
The electronic warfare market is projected to reach USD 23.85 billion, expanding at an 8.83% CAGR from 2026.
Which equipment category is growing fastest within the electronic warfare market?
Counter-UAS EW suites are expected to register a 9% CAGR through 2031 as militaries confront drone threats.
Why are retrofit programs dominating new-build installations?
Retrofit captured 55.30% of 2025 revenue because modular upgrades deliver near-peer capability at lower cost and faster timelines than purchasing new platforms.
Which region leads spending on electronic warfare capabilities?
North America held 40.46% of 2025 revenue and is forecasted to grow at 9.42% CAGR, driven mainly by the US DoD programs.
How is artificial intelligence (AI) influencing electronic warfare solutions?
AI-driven cognitive algorithms enable jammers to recognize and counter new waveforms in real time, boosting effectiveness and sustaining demand for upgradeable systems.
What is the biggest restraint to faster market growth?
High program costs and lengthy development cycles, particularly in the US and Europe, subtract an estimated 1.5% from potential CAGR because of budget overruns and certification delays.
Page last updated on:


