Airborne Electronic Warfare Market Size and Share
Market Overview
| Study Period | 2020 - 2031 |
|---|---|
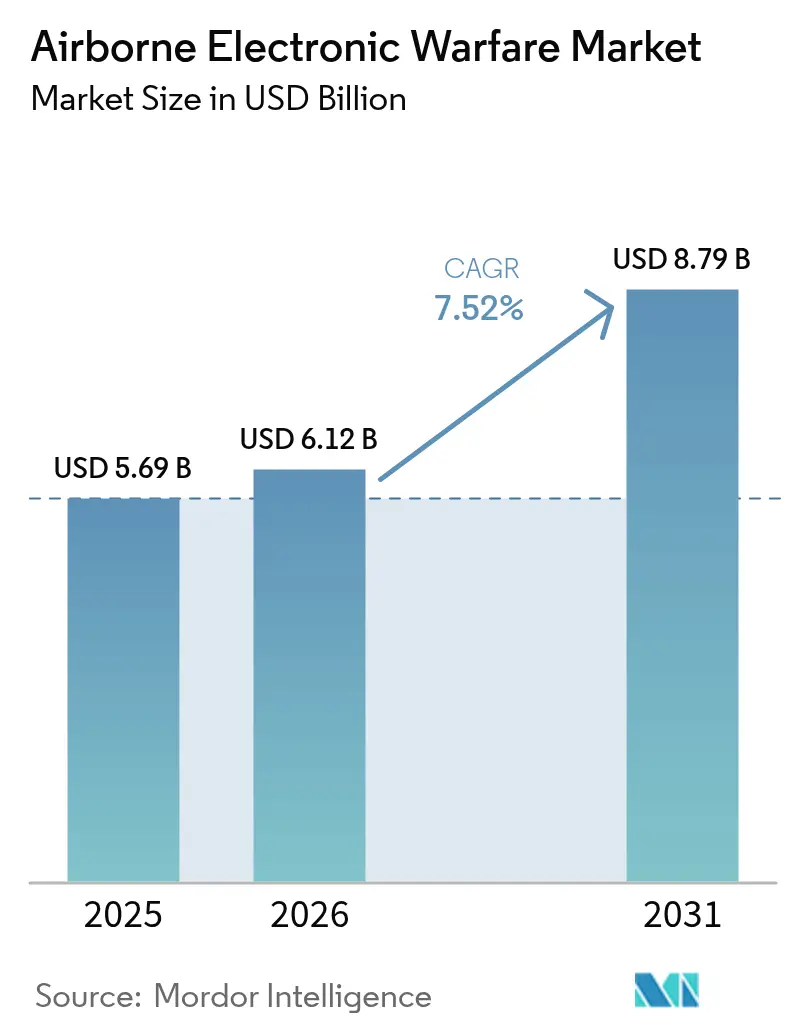
| Market Size (2026) | USD 6.12 Billion |
| Market Size (2031) | USD 8.79 Billion |
| Growth Rate (2026 - 2031) | 7.52% CAGR |
| Fastest Growing Market | Asia Pacific |
| Largest Market | North America |
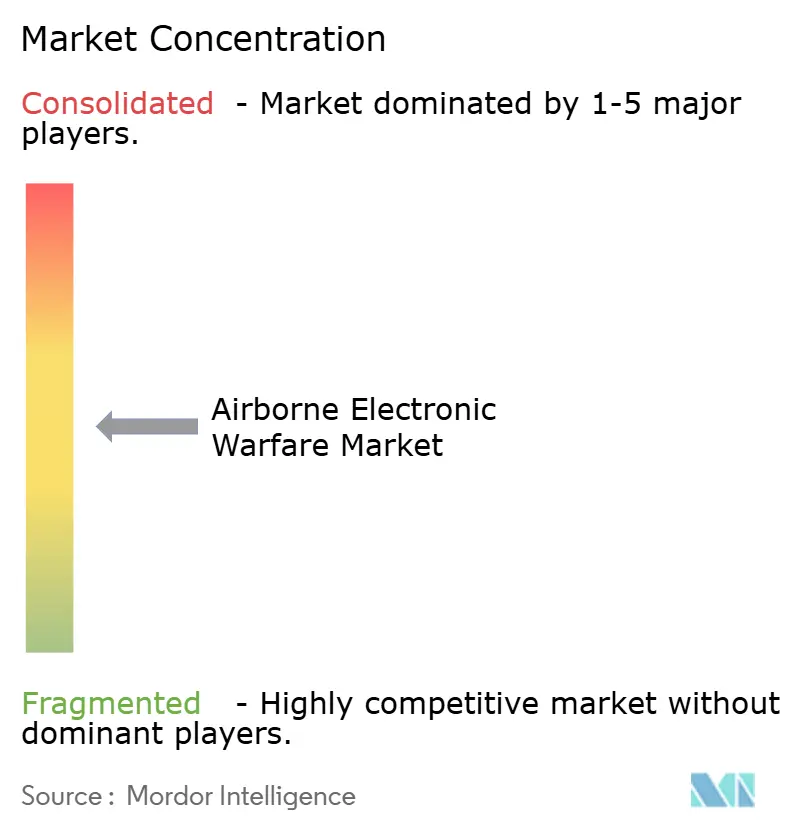
| Market Concentration | Medium |
Major Players *Disclaimer: Major Players sorted in no particular order Image © Mordor Intelligence. Reuse requires attribution under CC BY 4.0. | |
Airborne Electronic Warfare Market Analysis by Mordor Intelligence
The airborne electronic warfare market size is expected to grow from USD 5.69 billion in 2025 to USD 6.12 billion in 2026 and is forecast to reach USD 8.79 billion by 2031 at 7.52% CAGR over 2026-2031. This expansion reflects the priority militaries place on dominating the electromagnetic spectrum as advanced multi-band surface-to-air missile (SAM) systems proliferate and cognitive jamming becomes indispensable. Recent budget approvals—such as the United States setting aside USD 5 billion for electronic warfare (EW) programs in 2024—have reinforced demand for next-generation airborne EW suites. North America captured 45.21% of the airborne electronic warfare market share in 2024, yet Asia-Pacific is growing faster as China, Japan, and Australia acquire sophisticated EW capabilities. Platforms remain dominated by manned aircraft, but unmanned systems are outpacing in growth because ultra-lightweight payloads now fit Group 1-3 drones without compromising endurance. Consolidation continues: BAE Systems’ acquisition of Kirintec and RTX’s investments in AI/ML-enabled receivers illustrate how primes expand portfolios while securing intellectual property.[1]Source: BAE Systems, “BAE Systems Acquires Kirintec,” militaryembedded.com
Key Report Takeaways
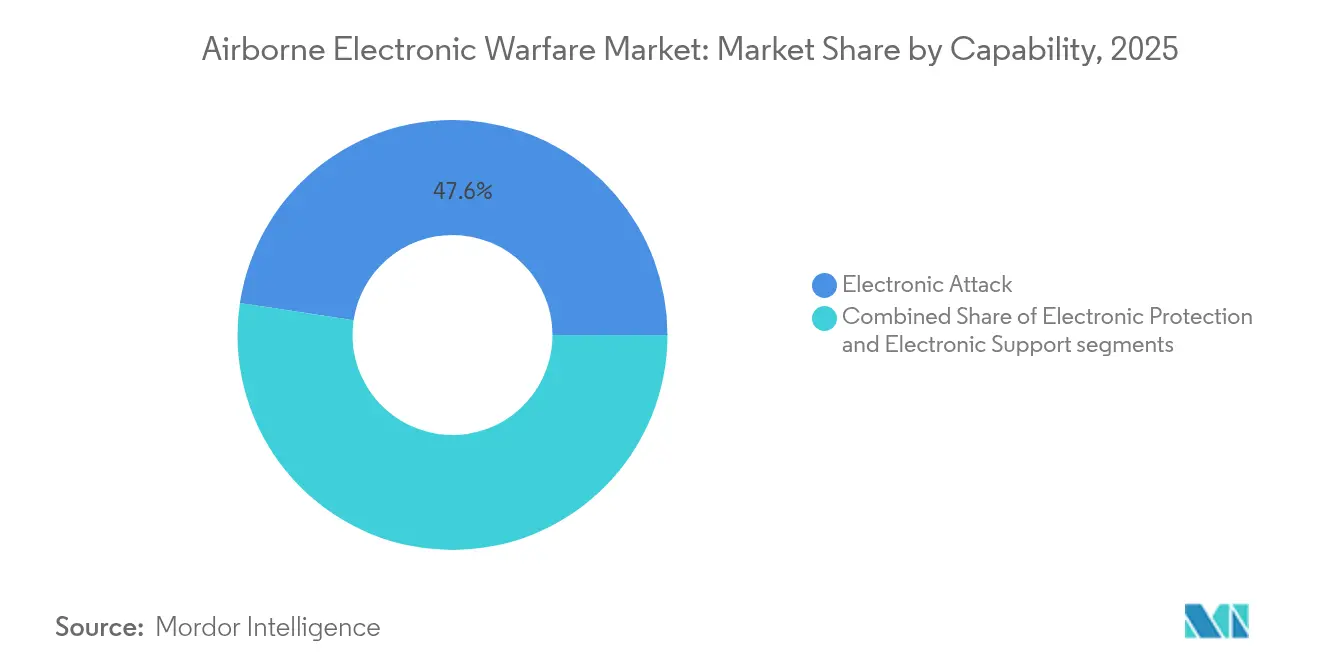
- By capability, electronic attacks led to 47.63% of the airborne electronic warfare market share in 2025; electronic support is forecasted to expand at a 9.72% CAGR by 2031.
- By platform, manned aircraft held a 73.92% share of the airborne electronic warfare market size in 2025; unmanned aircraft are projected to grow at an 11.08% CAGR through 2031.
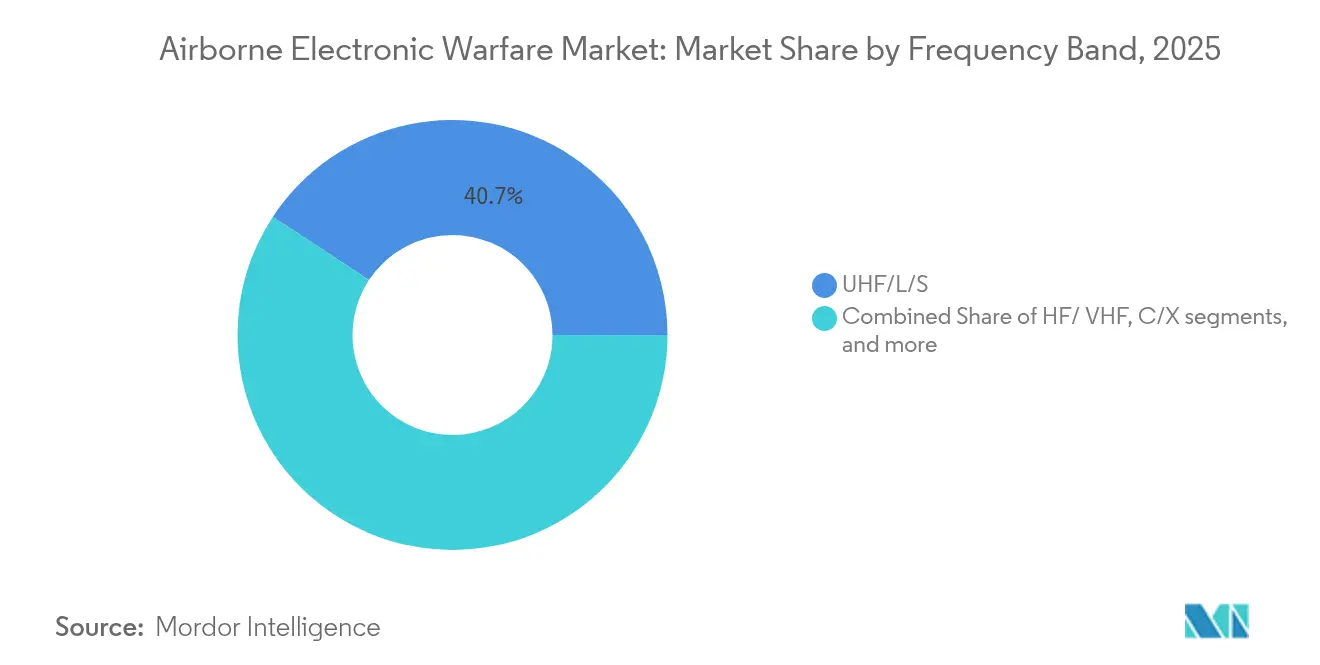
- By frequency band, UHF/L/S bands accounted for 40.74% of the airborne electronic warfare market size in 2025; Ku/Ka bands are expected to post a 9.31% CAGR to 2031.
- By architecture, pod-mounted solutions claimed 57.12% revenue share in 2025; payload/pod solutions for UAVs are advancing at an 11.22% CAGR to 2031.
- By geography, North America commanded 44.78% of the airborne electronic warfare market share in 2025, while Asia-Pacific is forecasted to grow at an 8.58% CAGR through 2031.
Note: Market size and forecast figures in this report are generated using Mordor Intelligence’s proprietary estimation framework, updated with the latest available data and insights as of 2026.
Global Airborne Electronic Warfare Market Trends and Insights
Drivers Impact Analysis*
| Driver | (~) % Impact on CAGR Forecast | Geographic Relevance | Impact Timeline |
|---|---|---|---|
| Rising defense budgets and recapitalization cycles | +2.1% | Global; early gains in North America, Europe, Asia-Pacific | Medium term (2-4 years) |
| Growing threat of advanced multi-band SAM and radar systems | +1.8% | Global; most acute in contested regions | Short term (≤ 2 years) |
| Fighter recapitalization programmes integrating organic EW suites | +1.5% | North America, Europe, Asia-Pacific | Long term (≥ 4 years) |
| UAV fleet expansion requiring ultra-lightweight EW payloads | +1.3% | Global; spillover to emerging markets | Medium term (2-4 years) |
| Shift toward SOSA-aligned open EW architectures | +0.7% | North America and EU; adoption by allied partners | Long term (≥ 4 years) |
| AI-enabled cognitive EW for adaptive jamming | +0.9% | Advanced military markets worldwide | Medium term (2-4 years) |
| Source: Mordor Intelligence | |||
Rising Defense Budgets and Recapitalization Cycles
Defense spending acceleration boosted procurement of next-generation EW suites. The US Department of Defense planned at least USD 21 billion for EW development over five years, a 40% uplift versus the previous cycle.[2]Source: Inside Defense, “DoD Plans to Spend at Least USD 21 Billion on EW Development,” insidedefense.com European states formed a multinational coalition to pool EW resources for lower unit costs and higher interoperability. Saudi Arabia and other Gulf nations have mirrored the trend, investing in fully integrated radar, missile, and EW solutions to counter Russian anti-access systems. Across regions, higher budgets shortened replacement cycles, pushing more orders for pod-mounted and embedded EW architectures that comply with open-system standards.
Growing Threat of Advanced Multi-Band SAM and Radar Systems
The spread of adaptable SAMs has forced air forces to adopt cognitive EW and be able to reprogram within milliseconds. PLA prototypes demonstrated jammers that create 3,600 false radar targets, accelerating US and NATO interest in wideband Active Electronically Scanned Array (AESA) countermeasures. Digital Radio Frequency Memory (DRFM) technology capable of simultaneous multi-band deception is now central in acquisition roadmaps, as evidenced by RTX’s Next Generation Jammer Mid-Band contract covering US Navy and Royal Australian Air Force requirements.
Fighter Recapitalization Programmes Integrating Organic EW Suites
Modern combat aircraft tend to stipulate internal EW, displacing legacy pod-only solutions increasingly. The Eurofighter Typhoon EK variant adopted Saab’s Arexis suite under a EUR 1.5 billion (USD 1.72 billion) award to guarantee relevance through 2060. The F-16 Viper Shield retrofit reached first flight in February 2025, enabling customers in Europe and the Middle East to field integrated digital receivers and processing blocks. Such organic approaches mitigate drag, align threat libraries with primary sensors, and cut support costs over the aircraft life cycle.
UAV Fleet Expansion Requiring Ultra-Lightweight EW Payloads
Persistent airborne coverage without risking crews has led to robust demand for miniaturized EW. The MQ-1C Gray Eagle completed a 32-hour flight with the NERO jammer, validating low-SWaP solutions for long-endurance platforms. Curtiss-Wright introduced small-form-factor mission computers optimized for Group 1-3 drones, supporting AI-enabled detection and response within a few cubic inches of volume. Elbit’s Micro Spear sensor demonstrated radar-site detection beyond 6 km when launched from an expendable air-launched platform, underscoring how distributed unmanned nodes multiply the reach of manned assets.
Restraints Impact Analysis*
| Restraint | (~) % Impact on CAGR Forecast | Geographic Relevance | Impact Timeline |
|---|---|---|---|
| Acquisition and life-cycle cost overruns of next-gen EW pods | -1.2% | Global, particularly complex procurement systems | Medium term (2-4 years) |
| Electromagnetic-spectrum congestion and deconfliction hurdles | -0.8% | Contested regions and dense electromagnetic environments | Short term (≤ 2 years) |
| Export-control regimes (ITAR/ML5) throttling cross-border deals | -0.6% | International markets, excluding domestic US programs | Long term (≥ 4 years) |
| SWaP limits when integrating EW on Group 1–3 drones | -0.4% | Global UAV markets, particularly small drone applications | Medium term (2-4 years) |
| Source: Mordor Intelligence | |||
Acquisition and Life-Cycle Cost Overruns of Next-Gen EW Pods
Pod programs such as the NGJ-Mid Band experienced multiple contract modifications that expanded cost profiles and delayed milestones, placing pressure on already stretched defense budgets. Integrating AI/ML algorithms into legacy fighters raised unforeseen technical risks, pushing schedules to the right as developers worked through electromagnetic compatibility issues across avionics suites. Extended test campaigns are now obligatory to prove reliability against adaptive threats, inflating support costs over product life cycles.
Electromagnetic-Spectrum Congestion and Deconfliction Hurdles
Coalition operations often involve dozens of national emitters competing for spectrum, raising the risk of fratricide and degraded performance. Hudson Institute studies showed that current deconfliction tools cannot cope with simultaneous S-band through K-band transmissions in high-density operations.[3]Source: Hudson Institute, “US Military Needs More Spectrum Access,” hudson.org Adversaries exploit this congestion by saturating bands with noise, compelling investments in real-time spectrum management software and dynamic allocation algorithms that add complexity and cost to airborne EW architectures.
*Our forecasts treat driver/restraint impacts as directional, not additive. The impact forecasts reflect baseline growth, mix effects, and variable interactions.
Segment Analysis
By Capability: Electronic Attack Maintained Strategic Primacy
Electronic attack accounted for 47.63% of the airborne electronic warfare market share in 2025, underscoring the premium placed on striking adversary radar and communications before kinetic weapons launch. Demand for wideband escort jamming and stand-off decoys kept the airborne electronic warfare market size for offensive payloads above USD 2.9 billion in 2026. Electronic support grew fastest at a 9.72% CAGR as armed services invested in real-time threat libraries and direction-finding sensors that feed cognitive jammers. Electronic protection retained steady budgets to harden satellite links and precision-navigation signals, particularly in joint operations where loss of GPS could cripple maneuver. Integrated suites that merge these three missions into a single processing stack became standard on new fighter and bomber programs, enhancing situational awareness while lowering sustainment costs.
Historical investments in electronic attack matured into exportable solutions, enabling NATO partners to field common waveforms and coordinate strike packages with minimal data latency. The airborne electronic warfare market now favors systems that deliver simultaneous detect-classify-jam functions within the same aperture. This trend reduces the need for multiple line-replaceable units and streamlines maintenance. Growth is also fueled by training ranges adopting high-fidelity threat emitters so that aircrews can rehearse against realistic multi-band radar clusters.


By Platform Type: Unmanned Growth Complemented, Not Replaced, Manned Assets
Manned aircraft continued representing 73.92% of the airborne electronic warfare market in 2025 because recapitalization programs for F-16, F-35, Typhoon, and EA-18G fleets commanded thousands of active airframes worldwide. The airborne electronic warfare market size for manned platforms is projected to expand at a 6.78% CAGR, driven by embedded architectures such as AN/ASQ-239 on the F-35. Unmanned systems, however, achieved an 11.08% CAGR through 2031 thanks to successful MQ-20 Avenger autonomous jamming trials by GA-ASI. Reduced risk to crews and lower operating costs supported procurement of attritable air-launched effects that distribute EW nodes across the battlespace. Doctrinally, unmanned platforms increasingly act as decoys to draw out threat emitters, allowing crewed aircraft to preserve stealth while orchestrating coordinated attack sequences.
UAV producers focused on open-systems payload bays so end users can swap EW cartridges quickly. The market welcomed lightweight gallium nitride transmitters that reduced power draw by 20%, extending loiter to beyond 24 hours on MALE UAVs. In parallel, manned platforms integrated autonomous decision aids developed for unmanned craft, illustrating cross-pollination of hardware and software that elevates the entire fleet’s resilience.
By Frequency Band: Wideband Adoption Challenged Traditional Band Preferences
UHF/L/S bands remained in front with 40.74% of the airborne electronic warfare market size in 2025, reflecting their central role in degrading early-warning radar and military communications. The airborne electronic warfare market recorded 9.31% CAGR in the Ku/Ka segment as satellite communications became a critical target, especially for expeditionary forces. C/X bands sustained relevance in anti-ship missions where naval radars operate, whereas HF/VHF bands retained niche value for long-range propaganda and navigation signal disruption. Programs such as the NGJ-Mid Band highlighted future directions, showing a single pod could jam or deceive across S, C, and X bands concurrently.
The growing need for adaptive coverage drove investment in tunable filters and digital beamforming, which let operators retask frequencies within seconds. As a result, procurement specifications now emphasize instantaneous bandwidth and spectral purity over single-band peak power, signaling a paradigm shift toward fluid, software-defined operations across the spectrum.
By Architecture: External Pods Retained Lead While Embedded Systems Advanced
Pod-mounted solutions led spending with a 57.12% share in 2025 due to their ability to modernize legacy fighters without structural rework. The US Air Force’s “Angry Kitten” pod exemplified agile prototyping, transitioning from test asset to fielded capability across F-16 and C-130 within 24 months. Payload-pod solutions for UAVs secured the highest CAGR at 11.22% because operators prioritized endurance and mission-specific plug-and-play modules for attritable drones. Internally integrated suites obtained higher funding in new-build programs such as the F-15EX, where stealth shaping and weight distribution mandated embedded antennas and receivers.
Hybrid configurations also emerged: Some advanced fighters use internal receivers paired with expendable decoy jammers that extend the strike package's footprint forward. Suppliers responded by offering scalable back-end processors that fit podded and internal designs, allowing customers to harmonize software baselines and threat libraries.
Geography Analysis
North America generated 44.78% of the airborne electronic warfare market revenue in 2025, anchored by multi-year US contracts such as Boeing’s USD 615 million award for a next-generation Air Force EW system. The region's airborne electronic warfare market size is projected to grow at 6.37% CAGR through 2031, supported by the modernization of F-15, F-16, and EA-18G fleets and the ongoing development of B-21 bomber defensive suites. Canada’s defense policy update earmarked funds for escort jammers on its future fighter, further strengthening regional demand.
Asia-Pacific is expected to post the fastest growth at 8.58% CAGR, reflecting China’s 6G-enabled jamming trials and Japan’s policy revisions that accelerated EW procurement for F-35 and next-generation fighter programs. Indigenous manufacturing centers in South Korea and India secured technology-transfer deals to assemble podded systems locally, reducing cost and building sovereign maintenance capacity. The airborne electronic warfare market thus benefited from both import acquisitions and emergent domestic production lines.
Europe remained resilient, buoyed by multinational initiatives to harmonize EW doctrines, including Germany’s Eurofighter EK and the United Kingdom’s Tempest future combat air system. Cooperative funding streams improved economies of scale and encouraged adoption of open-architecture standards, aligning with US SOSA profiles to guarantee coalition interoperability. Meanwhile, the Middle East and Africa concentrated spending among a smaller set of buyers, yet Saudi Arabia’s integrated radar-EW roadmap and the UAE EDGE Group’s export push highlighted strategic intent to field credible spectrum-dominance capabilities.


Competitive Landscape
The airborne electronic warfare market displayed moderate concentration with leading contractors—RTX, BAE Systems, Northrop Grumman, and L3Harris. These firms leveraged scale and in-house semiconductor fabrication to deliver gallium nitride transmitters that support higher power density and longer mean time between failures. Acquisitions consolidated capability breadth, such as BAE Systems purchasing Kirintec to strengthen cyber-electromagnetic offerings.
Strategic collaborations have proliferated. GA-ASI partnered with BAE Systems to integrate autonomous jamming on the MQ-20 Avenger, showcasing how unmanned platforms can host sophisticated link-16 enabled EW payloads. Leonardo unveiled an AI-enabled Eurofighter suite that merges cognitive electronic support and attack within a single array, demonstrating Europe’s push for sovereign technology. Smaller firms such as Southwest Research Institute won contracts valued at USD 6.4 million to advance cognitive EW algorithms, indicating room for niche innovators.
Competition increasingly revolves around software agility and open architectures rather than hardware alone. Vendors that certify Solutions on the Sensor Open Systems Architecture (SOSA) standard enhance upgrade cycles and reduce vendor lock-in, appealing to budget-minded customers. However, sustaining leading positions still requires vertically integrated engineering talent capable of designing custom RF front-ends that meet stringent airborne qualification standards.
Airborne Electronic Warfare Industry Leaders
Northrop Grumman Corporation
BAE Systems plc
Lockheed Martin Corporation
L3Harris Technologies, Inc.
RTX Corporation
- *Disclaimer: Major Players sorted in no particular order

Recent Industry Developments
- May 2025: RTX’s Raytheon won a USD 580.6 million US Navy production contract for Next Generation Jammer Mid-Band systems, which will be shared with the Royal Australian Air Force.
- April 2025: Lockheed Martin received a USD 15.9 million contract to develop SOSA-aligned airborne EW software under the Ephemeral Paragon program.
- January 2025: Boeing secured a USD 615 million contract to develop an advanced Air Force EW system.


Research Methodology Framework and Report Scope
Market Definitions and Key Coverage
Our study defines the airborne electronic warfare aircraft market as the annual value of new-build and retrofit manned and unmanned aircraft that integrate dedicated radio-frequency systems able to detect, deceive, jam, or shield assets across the electromagnetic spectrum. According to Mordor Intelligence analysts, this covers pods, internally mounted suites, antennas, and mission software delivered through platform procurements and service-life upgrades for fighters, transports, and special-mission fleets.
Scope Exclusions: Consumable expendables such as flares and chaff cartridges, ground or naval EW platforms, and standalone training simulators are outside the present scope.
Segmentation Overview
- By Capability
- Electronic Attack
- Electronic Protection
- Electronic Support
- By Platform Type
- Manned Aircraft
- Unmanned Aircraft
- By Frequency Band
- HF/ VHF
- UHF/L/S
- C/X
- Ku/Ka
- By Architecture
- Pod-mounted
- Internally Integrated
- Payload/Pod for UAV
- By Geography
- North America
- United States
- Canada
- Mexico
- Europe
- United Kingdom
- Germany
- France
- Russia
- Rest of Europe
- Asia-Pacific
- China
- Japan
- India
- South Korea
- Rest of Asia-Pacific
- South America
- Brazil
- Mexico
- Rest of South America
- Middle East and Africa
- Middle East
- Saudi Arabia
- UAE
- Israel
- Rest of Middle East
- Africa
- South Africa
- Rest of Africa
- Middle East
- North America
Detailed Research Methodology and Data Validation
Primary Research
Mordor analysts spoke with program managers, EW engineers, and procurement officials across North America, Europe, Asia-Pacific, and the Middle East. These discussions confirmed active fleet sizes, typical retrofit cost ranges, and funding outlooks, helping us fill data gaps and challenge desk-research assumptions.
Desk Research
We gathered baseline figures from respected public sources such as SIPRI defense-spending tables, US DoD Program Acquisition Costs, European Defence Agency statistics, and UN Comtrade shipment codes for radar and jammer hardware. Aircraft production and delivery counts were verified through Aviation Week's fleet database and IMTMA import logs, while contract values were traced in Dow Jones Factiva. Company 10-Ks, parliamentary briefs, and peer-reviewed IEEE papers on GaN transmitter costs refined price assumptions. The sources above are illustrative only, and many further publications were reviewed during data collection, validation, and clarification.
Market-Sizing & Forecasting
A top-down build began with country-level fighter, transport, and ISR aircraft inventories and future orders, to which we applied EW fitment penetration, average system price, and scheduled refresh intervals. Selective bottom-up checks, supplier revenue roll-ups, and sampled contract awards then adjusted totals. Key variables include real defense-budget growth, unit procurement timetables, GaN-based jammer price trends, retrofit share of spending, export approvals, and platform retirement rates. Five-year forecasts blend multivariate regression with scenario analysis around budget volatility and threat perception. Where supplier data were incomplete, regional median price proxies from primary interviews were employed.
Data Validation & Update Cycle
Analysts run variance and anomaly checks, re-contact sources when deviations exceed tolerance bands, and submit models for senior review before sign-off. Reports refresh annually, with interim updates triggered by major program awards or material budget revisions.
Why Our Airborne Electronic Warfare Baseline Commands Reliability
Published figures often differ because each firm chooses its own platform pool, amortizes upgrade labor differently, and converts currencies on distinct dates.
Key gap drivers in other studies include counting unmanned platforms alongside ships and vehicles, capitalizing one-off R&D grants, or booking multi-year contract options upfront; practices Mordor filters out through disciplined scope selection, matched-year delivery accounting, and annual refresh cadence.
Benchmark comparison
| Market Size | Anonymized source | Primary gap driver |
|---|---|---|
| USD 5.69 B (2025) | Mordor Intelligence | |
| USD 20.12 B (2025) | Global Consultancy A | Includes land and naval EW plus long-term sustainment services under aircraft header |
| USD 11.5 B (2024) | Trade Journal B | Uses contract face values without splitting multi-year deliveries or adjusting for inflation |
These comparisons show that by isolating airborne platforms, aligning recognition with actual delivery years, and cross-checking with both inventory data and supplier earnings, Mordor Intelligence delivers a transparent, replicable baseline that decision-makers can trust.


Key Questions Answered in the Report
What is the current size of the airborne electronic warfare market?
The airborne electronic warfare market was valued at USD 6.12 billion in 2026 and is projected to reach USD 8.79 billion by 2031, recording a 7.52% CAGR.
Which geographic region is growing fastest?
Asia-Pacific is forecast to expand at an 8.58% CAGR through 2031 as China, Japan, and Australia accelerate EW procurement.
Why are unmanned platforms important for airborne EW?
Unmanned aircraft deliver persistent jamming without risking pilots and now carry ultra-lightweight payloads that enable 24-hour missions, driving an 11.08% CAGR for the segment.
Which capability segment dominates spending?
Electronic attack remains the largest capability, accounting for 47.63% market share in 2025 thanks to investments in wideband escort and stand-off jamming.
How are open architectures affecting competition?
Standards such as SOSA let customers integrate best-of-breed components, reducing vendor lock-in and giving smaller firms access to programs previously controlled by large primes.
What restraint poses the greatest short-term risk?
Electromagnetic-spectrum congestion threatens near-term deployments by complicating deconfliction among coalition emitters and requires advanced spectrum management solutions.
Page last updated on:


