
Market Overview
| Study Period | 2021 - 2031 |
|---|---|
| Market Size (2026) | USD 1.89 Trillion |
| Market Size (2031) | USD 2.25 Trillion |
| Growth Rate (2026 - 2031) | 3.53 % |
| Fastest Growing Market | Middle East and Africa |
| Largest Market | Asia Pacific |
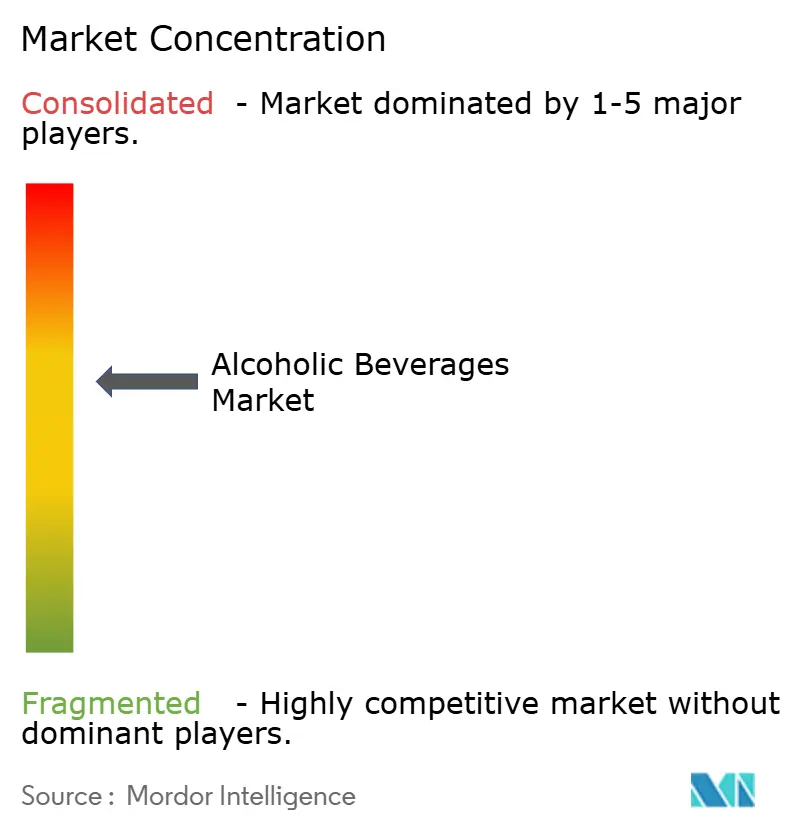
| Market Concentration | Medium |
Major Players
*Disclaimer: Major Players sorted in no particular order Image © Mordor Intelligence. Reuse requires attribution under CC BY 4.0. |
|
Alcoholic Beverages Market Analysis by Mordor Intelligence
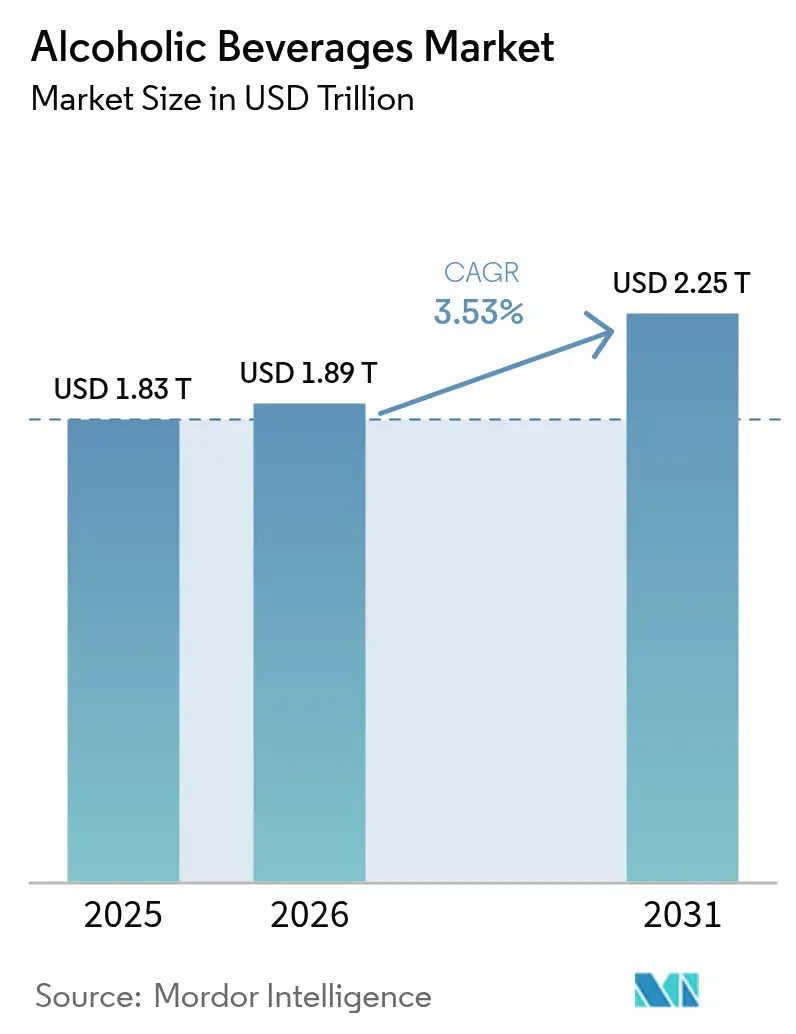
The alcoholic beverages market size is expected to grow from USD 1.83 trillion in 2025 to USD 1.89 trillion in 2026 and is forecast to reach USD 2.25 trillion by 2031 at 3.53% CAGR over 2026-2031. Premiumization, a swift tourism rebound, and a shift to omnichannel distribution drive growth in the alcoholic beverages industry. In the Asia-Pacific, a growing middle class is increasing spending on beer, wine, and spirits, boosting the alcoholic drinks market in the region. Digital platforms streamline purchases and foster direct ties between producers and consumers. Sustainability efforts, such as recyclable aluminum cans and water-positive distilleries, bolster brand equity. Regulatory updates, like new U.S. fill standards, enhance portfolio flexibility and cater to changing consumption trends. Health awareness and labeling requirements spur innovations in low- and no-alcohol products, expanding the market base without undermining core sales. As global players shed lower-margin assets and regional brands upscale premium offerings, start-ups tap into niche demands with functional formulations, intensifying competition.
Key Report Takeaways
- By product type, beer led with a 43.28% alcoholic beverages market share in 2025, while spirits are forecast to record the fastest 3.68% CAGR through 2031.
- By end user, male consumers accounted for 71.98% of the alcoholic beverages market share in 2025; female consumption is forecast to expand at a 3.93% CAGR between 2026 and 2031.
- By packaging, bottles captured 74.08% of the alcoholic beverages market share in 2025, whereas cans are projected to advance at a 4.24% CAGR to 2031.
- By distribution channel, on-trade held 50.12% of the 2025 share, yet off-trade grows faster at a 4.61% CAGR through 2031.
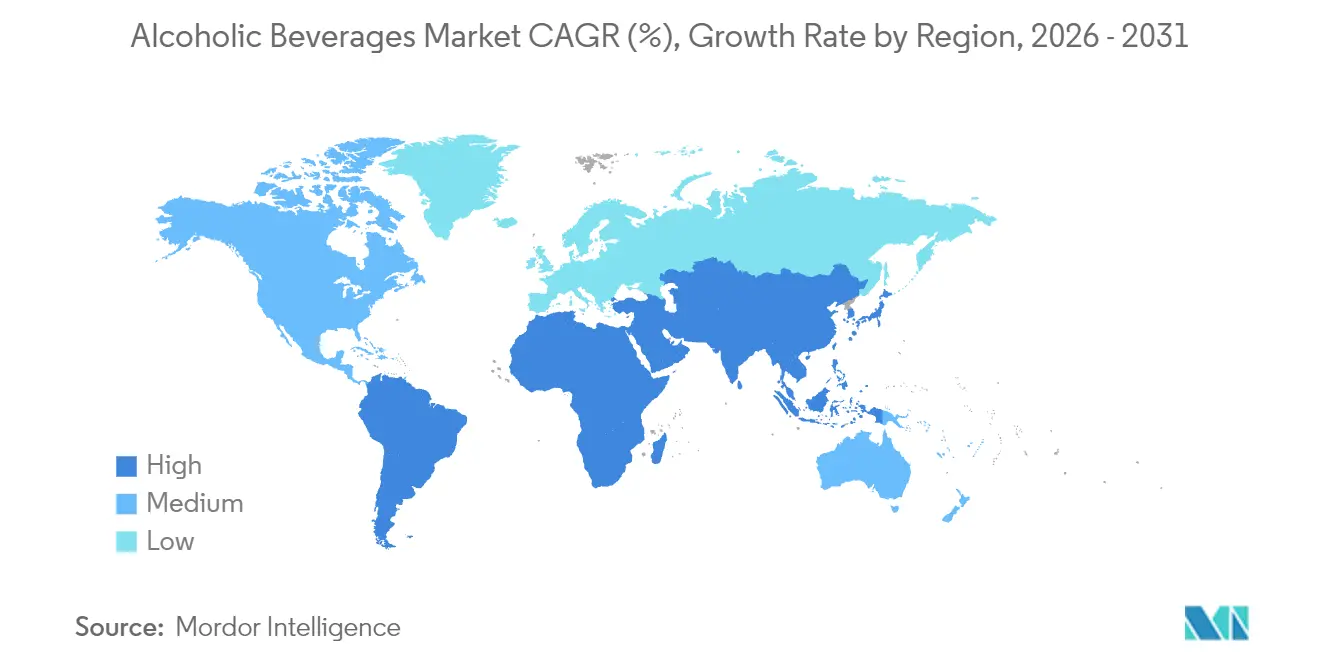
- By geography, Asia-Pacific commanded 29.21% of the alcoholic beverages market share in 2025; the Middle East and Africa region is set to register the highest 5.03% CAGR during 2026-2031.
Note: Market size and forecast figures in this report are generated using Mordor Intelligence’s proprietary estimation framework, updated with the latest available data and insights as of 2026.
Global Alcoholic Beverages Market Trends and Insights
Drivers Impact Analysis*
| Drivers | (~) % Impact on CAGR Forecasts | Geographic Relevance | Impact Timeline |
|---|---|---|---|
| Growing Tourism and Hospitality Impact Positive Growth | +0.8% | Global, with strongest impact in Asia-Pacific and Middle East | Medium term (2-4 years) |
| Rising Consumer Preference for Low Alcohol Products | +0.6% | North America and Europe, expanding to Asia-Pacific | Long term (≥ 4 years) |
| Surge in Demand for Premium Alcoholic Beverages | +1.2% | Global, led by North America and Europe | Short term (≤ 2 years) |
| Product Differentiation in Terms of Packaging And Alcohol Content | +0.4% | Global, with early adoption in developed markets | Medium term (2-4 years) |
| Expanding Social Drinking Culture | +0.7% | Asia-Pacific core, spill-over to Middle Eats and Africa | Long term (≥ 4 years) |
| Growth of Online Alcohol Sales | +0.5% | Global, accelerated in North America and Europe | Short term (≤ 2 years) |
| Source: Mordor Intelligence | |||
Growing Tourism and Hospitality Impact Positive Growth
In 2024, global international tourist arrivals nearly reached pre-pandemic levels, generating USD 1.6 trillion in visitor receipts. The Middle East stood out as the top-performing region, exceeding 2019 arrival numbers by 32%, according to the UN World Tourism Organization [1]Source: UN World Tourism Organization, “World Tourism Barometer,” unwto.org. Hotel, bar, and restaurant footfall directly translates into higher on-premise demand, boosting the alcoholic drinks market, especially for premium labels that cater to experiential travelers. Destinations that emphasize culinary experiences benefit from travelers purchasing local alcoholic specialties as souvenirs, which in turn boosts both on-premise and retail channels. With the UNWTO forecasting 3-5% growth in international arrivals during 2025, incremental volume upside remains particularly strong in Asia-Pacific resort hubs and Gulf Cooperation Council (GCC) hospitality corridors. The tourism multiplier also strengthens local supply chains, encouraging small-batch producers to collaborate with hotels and airlines, thereby embedding terroir-based narratives into the broader alcoholic beverages market
Rising Consumer Preference for Low-Alcohol Products
The World Health Organization’s 2024 Global Status Report linked alcohol to 2.6 million annual deaths and elevated cancer risks, according to the World Health Organization. In January 2025, the U.S. Surgeon General classified alcohol as the third leading preventable cause of cancer, catalyzing consumer shifts toward lower-strength beverages. Constellation Brands’ strategic investment in non-alcoholic functional start-up Hiyo underscores how incumbent leaders in the alcoholic beverages market view low-ABV extensions as category expanders rather than cannibalizers, given that a vast majority of buyers of non-alcoholic drinks still purchase traditional alcohol, supporting the broader alcoholic drinks industry. Regulatory momentum is supportive: The WHO Europe has advocated for mandatory cancer warning labels, and Ireland’s legislation mandating such labels takes effect in 2026, signaling a broader alignment between public health goals and product innovation trajectories.
Product Differentiation in Terms of Packaging and Alcohol Content
Lifecycle assessments show aluminum cans carry lower carbon footprints than glass, and they represented a significant share of metal can volume worldwide in 2024, according to the Can Manufacturers Institute. Diageo’s 90% paper Baileys prototype, created with Dry-Molded Fiber, demonstrates radical material diversification that appeals to eco-conscious consumers. The U.S. Treasury’s 2025 standards of fill add 13 new wine and 15 new spirits container sizes, encouraging portion-controlled offerings that support moderated drinking [2]Source: Alcohol and Tobacco Tax and Trade Bureau, "TTB Adds New Standards of Fill for Wine and Distilled Spirits; Eliminates Distinction Between Standards of Fill for Distilled Spirits in Cans and Other Types of Containers", ttb.gov. Smart closures equipped with NFC or QR codes authenticate origin, guide cocktail recipes, and facilitate recycling education, thus blending functional and experiential differentiation in the alcoholic beverages market.
Expanding Social Drinking Culture
Digital platforms, particularly Douyin in China, have increased casual alcohol consumption by connecting mixology trends with music and travel content, leading to higher peer-influenced adoption. The platform's algorithm promotes drink-making tutorials and lifestyle content that showcase alcoholic beverages in social settings, making consumption more appealing to younger users. Gulf Cooperation Council (GCC) countries are experiencing more open discussions about moderate alcohol consumption, while Saudi Arabia's policy changes to permit licensed alcohol outlets represent a significant shift. The Saudi government's decision marks a departure from decades of prohibition and reflects broader regional changes in alcohol regulations. These social changes directly impact the alcoholic beverages market by increasing legal distribution channels and normalizing moderate alcohol consumption among younger demographics. The shift in cultural attitudes, combined with digital influence, has created new opportunities for both domestic and international beverage companies to expand their presence in these emerging alcoholic drinks markets.
Restraints Impact Analysis*
| Restraints | (~) % Impact on CAGR Forecasts | Geographic Relevance | Impact Timeline |
|---|---|---|---|
| Stringent Government Regulations | -0.9% | Global, with varying intensity by region | Long term (≥ 4 years) |
| Health Concern Over Excessive Consumption | -0.7% | Global, strongest in developed markets | Medium term (2-4 years) |
| Religious and Cultural Restrictions | -0.3% | Middle East, parts of Asia and Africa | Long term (≥ 4 years) |
| High Competition from Non-Alcoholic Alternatives | -0.4% | North America and Europe, expanding globally | Short term (≤ 2 years) |
| Source: Mordor Intelligence | |||
Stringent Government Regulations
Regulatory complexity intensifies globally as governments balance public health concerns with economic interests, creating compliance burdens that particularly impact smaller producers and new market entrants. The U.S. TTB's proposed mandatory "Alcohol Facts" labeling requirements, including allergen disclosures and nutritional information, impose significant reformulation and labeling costs estimated between USD 6.6 million and USD 16.6 million in the first year, according to the Federal Register data. The FDA's ban on brominated vegetable oil, effective August 2024, citing safety concerns and bioaccumulation risks, demonstrates how evolving scientific understanding drives regulatory changes that require industry adaptation. Compliance costs disproportionately affect craft producers and emerging brands, potentially consolidating market share among larger players with dedicated regulatory affairs capabilities.
Health Concern Over Excessive Consumption
Public health advocacy intensifies pressure on the alcoholic beverages industry, with WHO data showing alcohol consumption causes 2.6 million deaths annually and contributes to over 200 diseases, including various cancers, according to the World Health Organization. The WHO's "Redefine Alcohol" campaign in Europe aims to reduce consumption by highlighting health risks, while only 15% of respondents knew alcohol causes breast cancer, and 39% were aware of its link to colon cancer, according to the World Health Organization. Adolescent consumption patterns raise particular concern, with 57% of 15-year-olds having tried alcohol and nearly 40% consuming it within the past 30 days, prompting targeted prevention strategies and policy measures, according to the World Health Organization [3]Source: World Health Organization, " Alcohol, e-cigarettes, cannabis: concerning trends in adolescent substance use, shows new WHO/Europe report", who.int. These health concerns drive regulatory responses, including mandatory warning labels, advertising restrictions, and taxation policies designed to reduce consumption, creating headwinds for the alcoholic beverages industry's growth while simultaneously creating opportunities for low-alcohol and functional beverage alternatives.
*Our forecasts treat driver/restraint impacts as directional, not additive. The impact forecasts reflect baseline growth, mix effects, and variable interactions.
Segment Analysis
By Product Type: Beer Maintains Dominance Amid Category Innovation
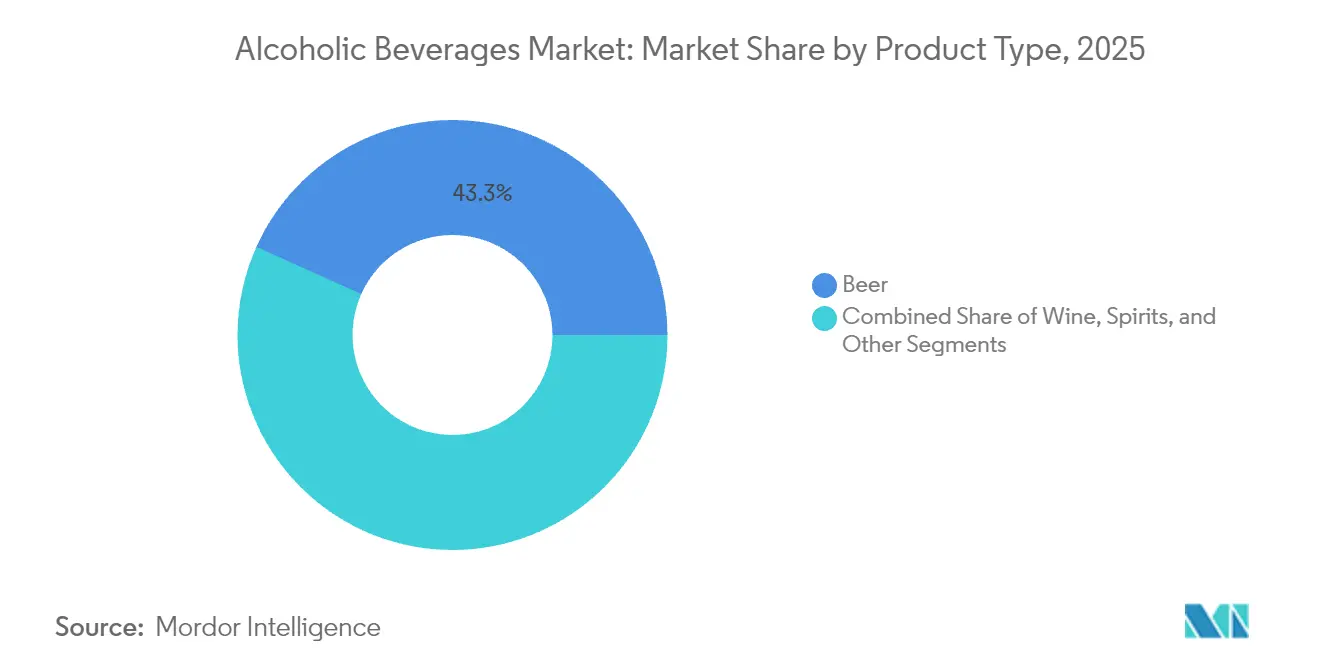
In 2025, beer holds a commanding 43.28% share of the market, buoyed by its established distribution networks, affordability, and broad consumer appeal across various occasions. Meanwhile, spirits are emerging as the fastest-growing segment, with projections indicating a 3.68% CAGR growth rate through 2031. This surge is largely attributed to the rising cocktail culture, a shift towards premium offerings, and the burgeoning trend of at-home mixology. Wine, on the other hand, enjoys stable growth, thanks to strategies centered on premiumization and a heightened interest in organic and low-intervention varietals. The "Others" category, encompassing RTD cocktails, hard seltzers, and functional alcoholic beverages, continues to captivate health-conscious and younger consumers, who are on the lookout for convenience and flavor innovation.
Across the U.S. and select regions in Europe, there's a noticeable tilt towards craft spirits and limited-edition releases. This trend not only fuels brand differentiation but also bolsters premium margins. In response, leading brands are rolling out innovations like flavored whiskies, botanical gins, and low-ABV formats, all in tune with the moderation trend. However, challenges loom large: tightening retail shelf space and a wave of consolidation among distributors pose significant hurdles for smaller brands. This scenario underscores the growing importance of robust digital marketing, direct-to-consumer channels, and immersive brand engagement experiences.



By End User: Female Consumption Accelerates Despite Male Dominance
Male drinkers constituted 71.98% of sales in 2025, mirroring historical consumption norms across most regions. Yet female uptake is forecast at a 3.93% CAGR, outpacing overall category growth as brands target nuanced taste profiles with flavored vodkas, spritz-style wines, and botanical gins. WHO adolescent studies reveal convergence: in several OECD countries, teenage girls’ alcohol and e-cigarette use now parallels that of boys, indicating a deep cultural shift.
Female-centric innovation spans pink-hued canned rosés with 8% ABV, collagen-infused sparkling wines, and elegantly portioned 187 ml spirit mixers that align with moderation goals. Marketing pivots from mass “party” imagery toward wellness, craftsmanship, and experiential storytelling, unlocking incremental volume and improving price realization. As economic empowerment advances—especially in urban India, Southeast Asia, and parts of Sub-Saharan Africa—female consumers are likely to wield outsized influence on flavor, format, and sustainability attributes that shape future iterations of the alcoholic beverages market.
By Packaging Type: Sustainability Drives Aluminum Adoption
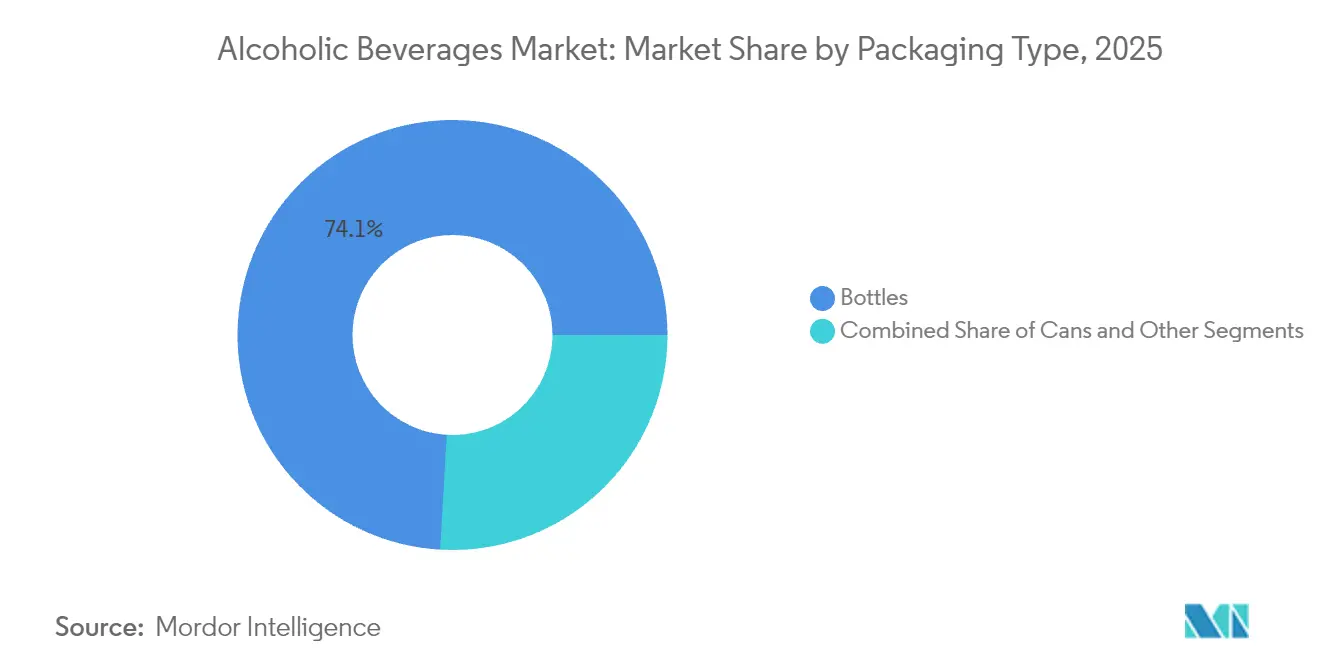
Glass bottles dominate the beverage packaging market with a 74.08% share in 2025, as consumers consistently associate them with premium quality and authenticity, particularly in the wine and spirits segments, where packaging significantly influences purchasing decisions. The preference for glass bottles remains strong across both developed and emerging markets, with manufacturers investing in lightweight designs and enhanced durability features. Metal cans are experiencing substantial growth at a 4.24% CAGR through 2031, supported by increasing environmental awareness, convenience benefits, and successful category expansion beyond traditional beer into wine, hard seltzers, and ready-to-drink cocktails.
The superior recyclability and significantly reduced carbon footprint of aluminum compared to glass strongly appeal to environmentally conscious consumers and companies actively pursuing sustainability targets. New regulations, including the European Union mandate for tethered closures beginning July 2024, increase compliance requirements while simultaneously generating increased demand for innovative packaging solutions that effectively align with stringent environmental standards and circular economy principles.
By Distribution Channel: Off-Trade Growth Accelerates Digital Transformation
On-trade venues like bars, restaurants, and hotels held a slim majority at 50.12% in 2025, buoyed by the tourism resurgence and renewed appetite for shared social experiences. Off-trade, however, will outpace at a 4.61% CAGR through 2031 as e-commerce, grocery click-and-collect, and subscription clubs solidify purchasing habits formed during lockdowns. U.S. omnichannel players report basket sizes 25-40% higher when alcohol is bundled with fresh food, highlighting cross-category synergies that challenge stand-alone liquor stores, according to the U.S. Department of Agriculture. Direct-to-consumer models democratize shelf access for small distillers, who leverage social ads and influencer mixology to build brand equity without paying slotting fees.
Regulatory tailwinds include the widening adoption of “digital age-verification wallets,” allowing frictionless ID checks at delivery, thereby addressing long-standing compliance hurdles. Specialty liquor boutiques safeguard relevance by curating rare barrel picks and micro-lot wines, hosting hybrid tasting events that blend in-person sampling with livestream education. As consumers embrace at-home cocktail rituals, demand for premium mixers, bitters, and barware co-purchases increases average order values, reinforcing off-trade’s strategic importance to the alcoholic beverages market.
Geography Analysis
Asia-Pacific captured 29.21% of the alcoholic beverages market size in 2025. Rising urban affluence, coupled with a burgeoning hospitality scene, propels premium beer and craft spirits, while wine volumes expand from a low base. The region benefits from cultural shifts toward social drinking acceptance, particularly among urban millennials, while government policies become increasingly favorable toward the alcoholic beverages industry expansion despite traditional regulatory constraints.
The Middle East and Africa are the fastest-growing territories, forecast at 5.03% CAGR, as policy liberalization opens formerly restricted markets. Saudi Arabia’s forthcoming licensing framework, slated to approve roughly 600 outlets by 2026, represents a paradigm shift that invites multinational participation and local joint ventures, according to the Saudi Ministry of Tourism. The United Arab Emirates acts as a re-export hub, importing USD 569 million in spirits in 2023 and funneling premium products throughout the GCC, according to the U.S. Department of Agriculture. Meanwhile, South African wineries leverage duty-free corridors in East Africa to expand distribution, offsetting domestic load-shedding challenges.
North America and Europe remain mature yet lucrative arenas where premiumization, craft provenance, and low-ABV experimentation underpin value expansion. WHO’s six-cluster analysis of European drinking patterns confirms entrenched cultural preferences, wine in Mediterranean markets, beer in Central Europe, while tightening health regulations push producers toward reformulated low-sugar and functional variants, according to the World Health Organization. South America offers a selective opportunity: Brazil’s resilient consumer base sustains premium spirits uptake, whereas inflationary pressures in Argentina and Colombia curb discretionary spend, prompting suppliers to emphasize affordability packs without eroding brand perception. Across all geographies, the alcoholic beverages market benefits from continuous consumer education, travel-induced palate exploration, and widening legal availability in jurisdictions easing historical restrictions.

Regulatory Landscape
Alcoholic beverages regulation is tightening around consumer information and harm-reduction measures, with labeling emerging as a key compliance area for global producers. Ireland implemented its alcohol labeling rules in 2026 under S.I. No. 249 of 2023, requiring health warnings including cancer risk, which is expected to increase packaging changeovers and SKU management complexity for suppliers serving the EU. In the United States, the Alcohol and Tobacco Tax and Trade Bureau (TTB) expanded standards of fill in 2025 by adding new container sizes for wine and distilled spirits, improving portfolio flexibility but also increasing artwork and compliance work across packaging formats.
At the multilateral level, WHO continues to advance the SAFER policy package (taxation, marketing restrictions, and availability controls), reinforcing regulatory pressure on affordability and promotion in multiple regions. In Europe, WHO Europe renewed calls in February 2025 for cancer-risk warning labels on alcohol, while the EU adopted Regulation (EU) 2026/471 with harmonized labeling provisions for non-alcoholic and reduced-alcohol wines, underscoring how policy momentum is advancing unevenly by category and member state. Parallel work at the Codex Alimentarius Committee on Food Labelling on a standalone international approach to alcoholic beverage labelling points to a pathway toward more standardized ingredient and nutrition disclosure expectations over time, raising the baseline for exports and cross-border portfolio harmonization.
Competitive Landscape
The alcoholic beverages market maintains a moderate consolidation, with global players holding significant alcoholic beverages industry share while operating alongside regional and craft producers. Companies are expanding their portfolios to meet changing consumer preferences, as demonstrated by Diageo's acquisition of Ritual Zero Proof in September 2024. This strategic move strengthened Diageo's presence in the non-alcoholic spirits segment, which has achieved a 31% CAGR in retail sales over five years.
Companies are increasingly adopting technology solutions, particularly in direct-to-consumer engagement and e-commerce. AccelPay's January 2025 acquisition of Cask & Barrel Club demonstrates this focus on expanding digital alcohol commerce across markets. The alcoholic drinks market presents substantial growth opportunities in functional alcoholic beverages, which combine traditional alcohol content with added health benefits such as vitamins, antioxidants, or natural energy boosters.
Additionally, premium low-alcohol products in the alcoholic drinks market are gaining traction among health-conscious consumers, creating opportunities for manufacturers to develop sophisticated alternatives that maintain flavor profiles while reducing alcohol content. These emerging categories represent key areas for product innovation and market expansion as consumers increasingly demand options that align with both health-conscious and premium consumption preferences.
Alcoholic Beverages Industry Leaders
-
Anheuser-Busch InBev SA/NV
-
Heineken Holding NV
-
Diageo PLC
-
Constellation Brands Inc.
-
Pernod Ricard SA
- *Disclaimer: Major Players sorted in no particular order

Market Opportunities and Future Outlook
Low- and no-alcohol extensions and portion-controlled packs are creating participation in new drinking occasions, as health awareness and labeling scrutiny shape purchase decisions. The U.S. Surgeon General advisory in January 2025 and Ireland's implementation of mandatory health warnings for 2026 are pushing brands to compete on transparency and moderation cues, alongside the U.S. TTB 2025 expansion of standards of fill that supports smaller-format offerings across wine and spirits. On the demand side, the rebound in travel-led on-trade consumption supports premium experience-led offerings, while off-trade digitalization and direct-to-consumer engagement improve discovery and trial for niche brands and functional formulations.
Producers are also putting capital into supply resilience and decarbonization-linked manufacturing, which is creating room for technology providers, packaging suppliers, and co-manufacturers that can support flexible formats (cans, RTD, and low-ABV runs). In April and May 2026, Diageo opened major new production infrastructure in Montgomery, Alabama and Littleconnell Brewery in Kildare, Ireland, followed by June 2026 when Heineken commenced operations at a new greenfield brewery in Passos, Brazil, targeted at premium demand. Initiatives such as Chivas Brothers sharing open-source heat recovery methods from the Glentauchers site, including material energy and emissions reductions, also show operational tools that can be replicated across breweries and distilleries to lower unit costs and support retailer and customer sustainability requirements. This, in turn, supports broader adoption of lightweight and recyclable packaging choices such as cans where appropriate.
Recent Industry Developments
- May 2026: Diageo officially opened the Littleconnell Brewery in County Kildare, Ireland, as part of a near EUR 1 billion investment program (2020-2029). The site was designed to run on 100% renewable electricity, supporting brewing capacity alongside decarbonization goals and reinforcing the role of Ireland in the Diageo supply footprint.
- April 2026: Diageo opened a new 360,000-square-foot manufacturing and warehousing facility in Montgomery, Alabama, backed by an investment of about USD 415 million. The facility added logistics and production capabilities, including electric boilers and automated guided vehicles, improving regional service levels and operational efficiency for spirits and RTD supply.
- September 2024: Diageo acquired Ritual Zero Proof, expanding its presence in non-alcoholic spirits. The acquisition broadened Diageo's portfolio for moderation-led occasions and supported route-to-market leverage as major players increase shelf and menu space for alcohol-free alternatives.


Research Methodology Framework and Report Scope
Market Definition and Coverage
For this methodology, the alcoholic beverages market is defined as the value of legally sold beer, wine, spirits, and other alcoholic drinks across on-trade and off-trade channels, summed at the market level and reported in USD.
Scope exclusions: Illicit alcohol, home-brewed or homemade beverages, and non-alcoholic drinks are excluded from the market totals.
Segmentation Overview
-
By Product Type
-
Beer
- Ale Beer
- Lager
- Non/Low-Alcohol Beer
- Others Beer Types
-
Wine
- Fortified Wine
- Still Wine
- Sparkling Wine
- Others Wine Types
-
Spirits
- Brandy and Cognac
- Liqueur
- Rum
- Tequilla and Mezcel
- Whiskies
- White Spirits
- Other Spirit Types
- Others
-
Beer
-
By End User
- Male
- Female
-
By Packaging Type
- Bottles
- Cans
- Others
-
By Distribution Channel
- On-Trade
-
Off-Trade
- Specialty/Liquor Stores
- Others Off Trade Channels
-
By Geography
-
North America
- United States
- Canada
- Mexico
- Rest of North America
-
Europe
- Germany
- France
- United Kingdom
- Netherlands
- Italy
- Sweden
- Poland
- Belgium
- Spain
- Rest of Europe
-
Asia-Pacific
- China
- India
- Japan
- Australia
- South Korea
- Indonesia
- Thailand
- Singapore
- Rest of Asia-Pacific
-
South America
- Brazil
- Argentina
- Chile
- Peru
- Colombia
- Rest of South America
-
Middle East and Africa
- United Arab Emirates
- South Africa
- Nigeria
- Saudi Arabia
- Morocco
- Turkey
- Rest of Middle East and Africa
-
North America
Data Sources, Market Sizing, and Validation
Desk Research
Desk work was used to set the foundation for volumes, trade flows, and category definitions before the model was built. We relied on public sources such as national statistics offices, UN Comtrade and customs trade releases, the World Bank and IMF macro series, and FAO-style agriculture and crops references where relevant for beer and wine inputs. Regulatory and taxation context was reviewed using government excise and licensing portals, along with public health agencies that publish consumption indicators by country.
To avoid sizing the market on opinions alone, company annual reports, investor presentations, and earnings call transcripts were reviewed to understand price moves, mix shift, and channel exposure. Patent databases were also checked to see directionally where packaging and product innovation were building. Paid subscriptions were used only where needed for structured company financials, news screening, and occasional shipment-level import and export signals for cross-checking large markets. The sources listed here are not exhaustive, and many other public documents were reviewed for data collection, validation, and clarification.
Primary Interviews and Surveys
Primary work was used to pressure-test category splits, price ladders, and channel dynamics that are hard to confirm from public data alone. We spoke with participants across brand owners, distributors, importers, and on-trade and off-trade operators to understand what is actually moving volumes and value, and then to confirm the reasonableness of assumptions.
Because this is a global market, inputs were checked across APAC, EMEA, and the Americas so regional differences in taxation, on-trade recovery, and premiumization could be captured consistently in the final model.
Distribution of primary research fieldwork respondents
| Company type | Respondent position | Region |
|---|---|---|
| Top tier: 27% | CXOs: 15% | APAC: 46% |
| Mid tier: 57% | Functional/Unit leaders: 29% | EMEA: 31% |
| Smaller Players: 16% | Managers: 56% | Americas: 23% |
Market-Sizing & Forecasting
Sizing started with a top-down build where country-level alcohol consumption indicators, category mix, and channel splits were used to reconstruct the demand pool, and those totals were then rolled up to regions and the global number. To keep the totals realistic, the outputs were corroborated with selective bottom-up checks such as sampled supplier revenue roll ups, distributor and retailer channel checks, and simple volume times average selling price approximations for major categories.
Key inputs used in the model included per-capita alcohol consumption trends, urbanization and income growth, on-trade versus off-trade share shifts, premium and value mix movement, and packaging and format changes that impact price realization (for example, cans versus bottles and growth of ready-to-drink formats). Where public data was missing or too delayed, gaps were handled through proxy indicators like trade flows for spirits and wine, plus expert-confirmed mix assumptions that were kept stable unless a clear trigger was observed.
Forecasts were developed using scenario analysis, where base, conservative, and high cases were built around expected inflation and excise movements, consumption normalization in on-trade, and the pace of premiumization, and then narrowed using what primary respondents expected by region and category. The final forecast path was chosen only after the time series looked consistent with recent cycle behavior and with expected channel recovery patterns.
Data Validation & Update Cycle
Outputs were validated through multiple checks so the totals do not rely on a single data stream. Model results were compared against independent signals such as reported alcohol revenue trends from large public companies, trade and customs indicators for major importing markets, and consumption series that can indicate whether volume assumptions are drifting away from reality.
When large variances appeared, the assumptions were revisited and, where needed, primary respondents were re-contacted to confirm whether the change was real or caused by timing, pricing, or channel mix effects. A multi-step analyst review is followed before sign-off so calculation logic, unit consistency, and currency conversions are clean. Reports are refreshed annually, with interim updates when material events occur, and a final pre-delivery pass is completed to reflect the latest public and primary inputs.
Mordor Intelligence's Alcoholic Beverages Market Size Compared Against Other Published Estimates
Published market values for alcoholic beverages can look far apart because the scope is not always the same, and because price and channel assumptions are handled differently across studies. Differences also show up when one estimate is closer to retail value, while another is closer to producer sales, and then currency timing and inflation treatment further widen the spread.
The main gap comes from whether taxes and retail markups are included in the value, where Mordor Intelligence keeps the sizing tied to the beverage categories and channel structure stated in the study and avoids mixing in broader retail price layers that vary heavily by country and year.
Benchmark comparison
| Source | Market Size | Gaps in Research Methodology |
|---|---|---|
| Mordor Intelligence | USD 1.83 T (2025) | |
| Industry Publisher A | USD 1.81 T (2025) | This estimate appears to use a broader, less explained set of assumptions for channel pricing and category boundaries, so the same country totals can land lower when premium mix and on-trade recovery are treated conservatively. |
| Global Publisher B | USD 2.56 T (2025) | A higher value can result when the model leans closer to retail selling prices with taxes and markups embedded, and when faster price progression is assumed across markets without consistent checks against consumption and trade signals. |
The comparison indicates that the spread is mainly explained by what gets counted in value, especially around tax and markup treatment, and by how quickly prices are stepped up year to year. By keeping assumptions traceable to observable consumption, channel mix, and pricing signals, the final number stays easier to reproduce and to update when new public data becomes available.


Key Questions Answered in the Report
What is the current size of the alcoholic beverages market?
The alcoholic beverages market is valued at USD 1.89 trillion in 2026 and is forecast to rise to USD 2.25 trillion by 2031, reflecting a 3.53% CAGR during 2026-2031.
Which product category holds the largest alcoholic beverages market share?
Beer retained the lead with 43.28% of 2025 global revenue, supported by entrenched distribution and broad consumer acceptance.
Which region is growing fastest in the alcoholic beverages market?
The Middle East and Africa region is expected to expand at a 5.03% CAGR between 2026 and 2031, owing to tourism investments and regulatory liberalization.
What role does e-commerce play in alcoholic beverage sales?
Off-trade channels are set to grow at 4.61% CAGR to 2031, driven by the rise of e-commerce, which enables greater convenience, personalized shopping experiences, and growth in subscription-based alcohol delivery models.
Page last updated on:




