
Acrylic Acid Market Size and Share
Market Overview
| Study Period | 2025 - 2031 |
|---|---|
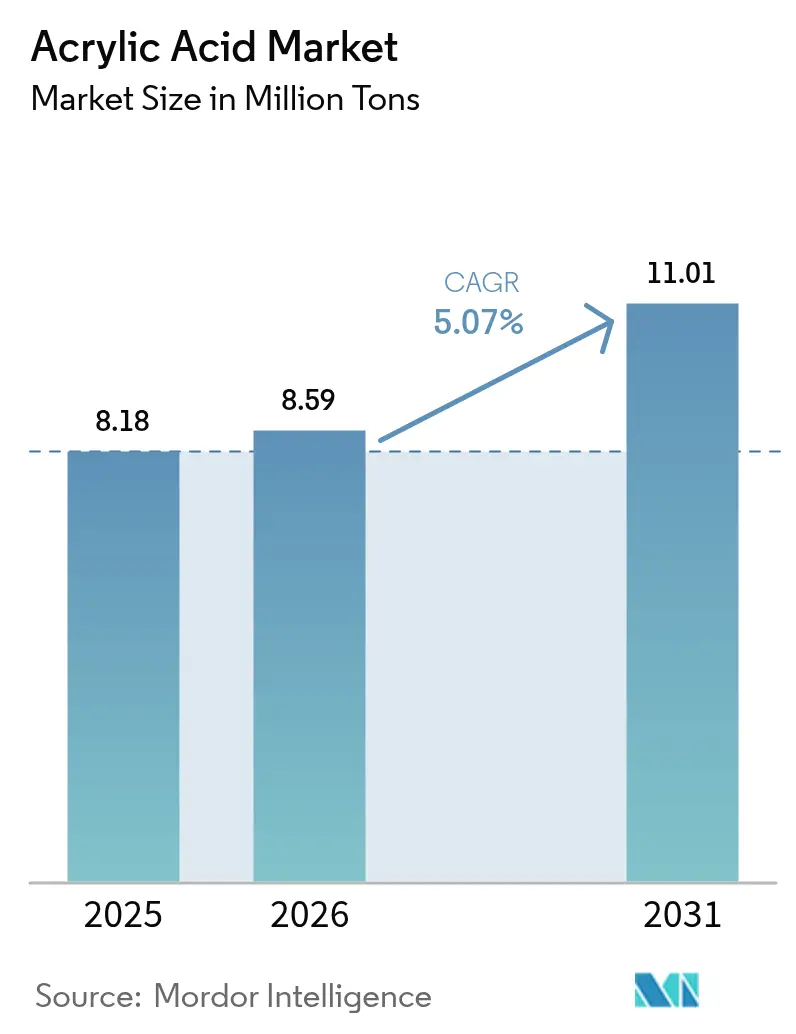
| Market Volume (2026) | 8.59 Million tons |
| Market Volume (2031) | 11.01 Million tons |
| Growth Rate (2026 - 2031) | 5.07% CAGR |
| Fastest Growing Market | Asia Pacific |
| Largest Market | Asia Pacific |
| Market Concentration | High |
Major Players *Disclaimer: Major Players sorted in no particular order Image © Mordor Intelligence. Reuse requires attribution under CC BY 4.0. | |
Acrylic Acid Market Analysis by Mordor Intelligence
The Acrylic Acid Market size is expected to grow from 8.18 million tons in 2025 to 8.59 million tons in 2026 and is forecast to reach 11.01 million tons by 2031 at 5.07% CAGR over 2026-2031. Sustained demand from super-absorbent polymers, water-borne architectural coatings, and specialty adhesives anchors this growth trajectory. Ongoing substitution of solvent-borne chemistries, demographic shifts toward premium hygiene products, and infrastructure programmes that specify low-VOC coatings all reinforce volume expansion across mature and emerging economies. Feedstock diversification into bio-routes and propane-based technologies mitigates propylene volatility, while vertical integration strategies protect margins. Competitive positioning increasingly hinges on carbon-footprint transparency, certified bio-content, and the ability to supply high-purity grades for electronics and medical applications.
Key Report Takeaways
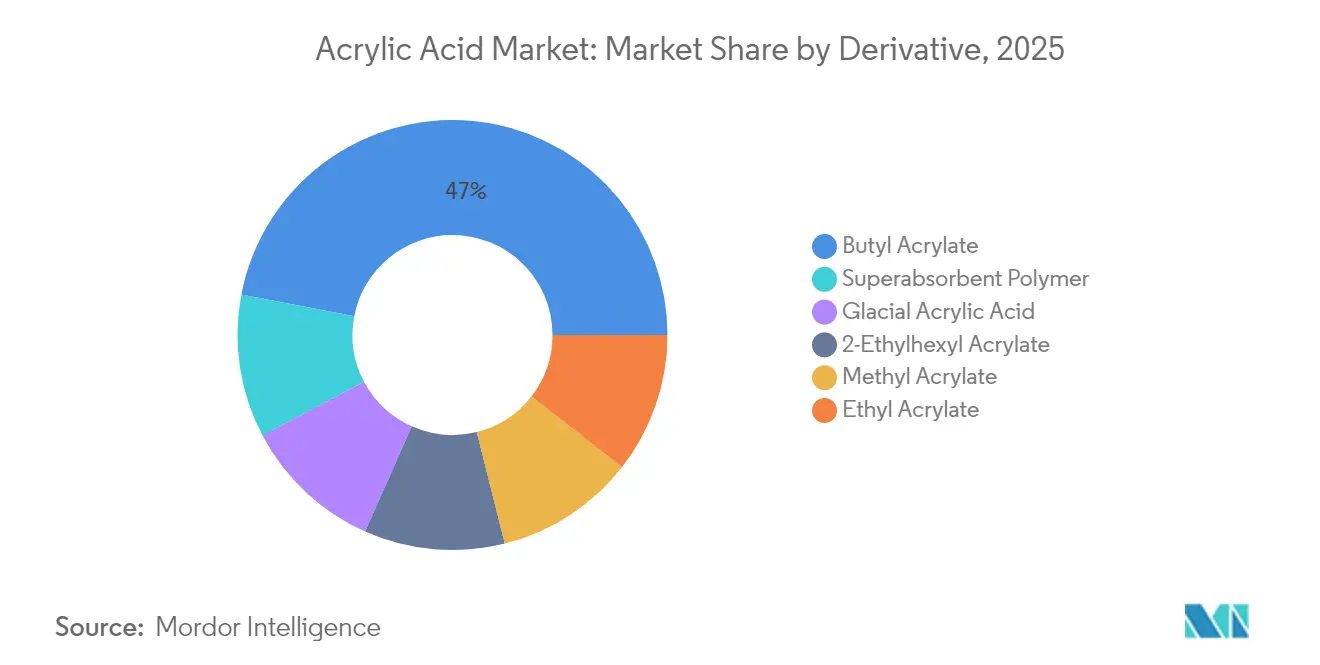
- By derivative, butyl acrylate led with 46.98% of acrylic acid market share in 2025, while Super-absorbent polymers are projected to expand at a 5.53% CAGR through 2031.
- By application, paints and coatings accounted for 35.46% of the acrylic acid market size in 2025, and adhesives and sealants are expected to record the fastest growth at 7.01% CAGR to 2031.
- By purity grade, technical grade held 88.74% volume in 2025, whereas glacial grade advances at a 7.18% CAGR to 2031.
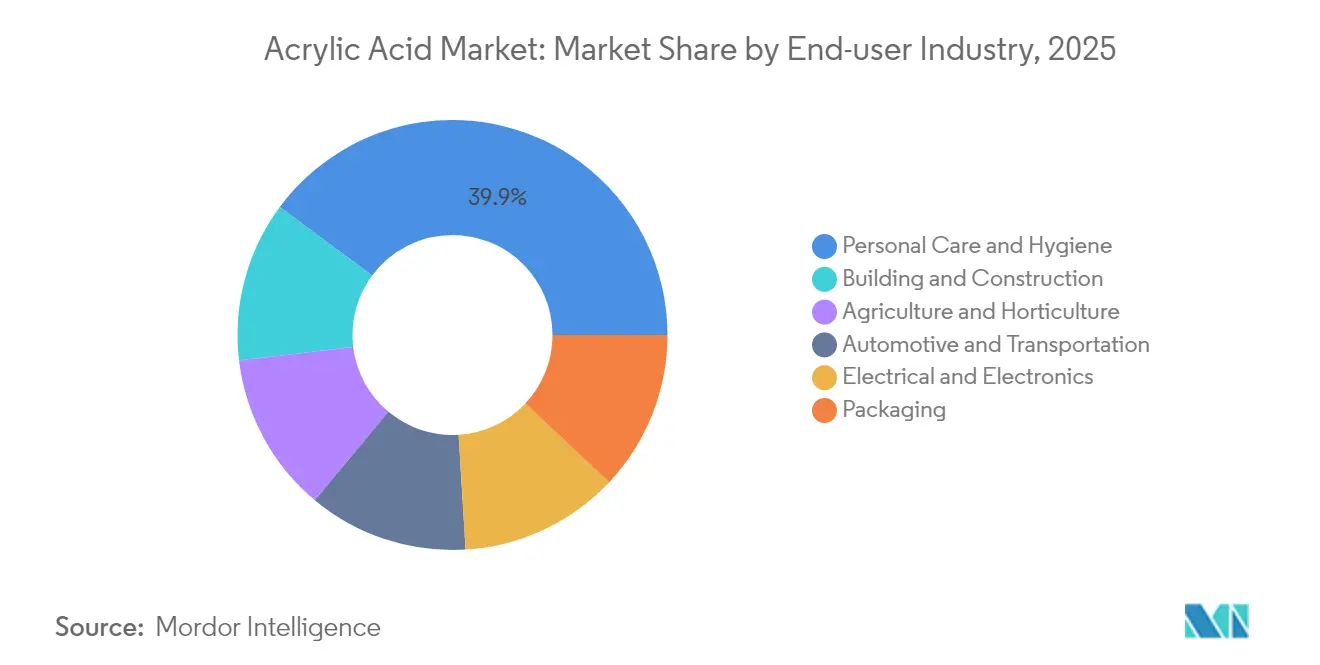
- By end-user industry, personal care and hygiene contributed 39.85% of demand in 2025 and is expected to grow at a 5.48% CAGR to 2031.
- By geography, Asia-Pacific contributed 52.10% of global volume in 2025, expanding at 5.36% CAGR to 2031.
Note: Market size and forecast figures in this report are generated using Mordor Intelligence’s proprietary estimation framework, updated with the latest available data and insights as of 2026.
Global Acrylic Acid Market Trends and Insights
Drivers Impact Analysis*
| Drivers | (~) % Impact on CAGR Forecast | Geographic Relevance | Impact Timeline |
|---|---|---|---|
| Super-absorbent polymer demand up-trend | +1.2% | Global, concentrated in Asia-Pacific and North America | Medium term (2-4 years) |
| Expansion of waterborne architectural coatings | +0.9% | North America and EU, expanding to APAC | Long term (≥ 4 years) |
| Rising hygiene mandates in emerging Asia | +0.8% | APAC core, spill-over to MEA | Short term (≤ 2 years) |
| Commercialisation of bio-acrylic acid routes | +0.6% | Global, led by North America and EU | Long term (≥ 4 years) |
| Surge in electronics-grade pressure-sensitive adhesives | +0.5% | Global, concentrated in APAC electronics hubs | Medium term (2-4 years) |
| Source: Mordor Intelligence | |||


Super-Absorbent Polymer Demand Up-Trend
Global demographic ageing and rising disposable incomes lift hygiene-product penetration, intensifying consumption of polyacrylate-based super-absorbents. Agricultural adoption broadens the acrylic acid market as growers use the polymers to enhance soil water retention in arid regions. Research into biodegradable cross-linkers lessens end-of-life concerns while preserving absorption capacity. Volume growth remains most pronounced in Asia-Pacific, where infant and adult incontinence products scale rapidly. Leading resin suppliers introduce microwave-based recycling for methyl methacrylate, closing the loop for cast-acrylic waste. Manufacturers also refine catalytic processes to cut energy intensity, underpinning long-term cost competitiveness.
Expansion Of Water-Borne Architectural Coatings
Governmental VOC regulations stimulate a lasting shift from solvent-borne to water-borne systems, cementing acrylic dispersions as the binder of choice. BASF’s new Dutch production line elevates regional capacity without CO₂ increases, signalling a commitment to sustainable scale-up. In the Gulf Co-operation Council states, acrylic resin already commands more than 40% coating formulations, buoyed by large-scale infrastructure builds that require fast-drying, corrosion-resistant finishes. The acrylic acid market benefits as water-borne chemistries need higher binder solids to match legacy performance, materially lifting monomer pull-through. Packaging conversions from plastic to paper substrates further amplify dispersion demand.
Rising Hygiene Mandates in Emerging Asia
Public-health campaigns, halal certification requirements, and supportive e-commerce channels converge to accelerate premium diaper and feminine-care consumption. Indonesian production of biomass-derived acrylic acid demonstrates a local response to faith-based certification as well as feedstock diversification. Governments link sanitation upgrades to measurable reductions in waterborne disease, reinforcing long-run demand for absorbent hygiene products. Rapid urbanisation elevates per-capita spending on personal-care staples, sustaining double-digit growth pockets despite macroeconomic cycles. The acrylic acid market gains additional tailwinds from value-added adult incontinence segments that favour high-performance, ultra-thin cores.
Commercialisation of Bio-Acrylic Acid Routes
LG Chem’s 100 tons/year fully plant-based line validates the commercial feasibility of microbial fermentation pathways. Identical performance enables direct drop-in use, prompting brand owners to specify bio-grades for cosmetics and home-care products. Life-cycle assessment transparency grows in procurement tenders, giving early movers pricing leverage. Technology licensors forecast triple-digit capacity growth over the decade, positioning bio-routes as a structural supply pillar rather than a niche offering. The acrylic acid market thereby decouples part of its raw-material risk from crude-derived propylene.
Restraints Impact Analysis*
| Restraints | (~) % Impact on CAGR Forecast | Geographic Relevance | Impact Timeline |
|---|---|---|---|
| Health and toxicity concerns of AA vapours | -0.7% | Global, stricter in North America and the EU | Short term (≤ 2 years) |
| Propylene price volatility | -0.5% | Global, acute in Asia-Pacific | Medium term (2-4 years) |
| Supply risk from ageing propylene oxide assets | -0.3% | Global, concentrated in North America and EU legacy facilities | Long term (≥ 4 years) |
| Source: Mordor Intelligence | |||
Health and Toxicity Concerns of AA Vapours
Regulatory agencies tighten exposure thresholds, compelling producers to invest in closed-loop loading, advanced scrubbers, and personal protective equipment. The European Commission cites respiratory irritation risks, while NIOSH recommends a 2 ppm TWA[1]National Institute for Occupational Safety and Health, “Acrylic Acid,” cdc.gov. Australia’s National Pollutant Inventory records site emissions to guide licensing limits. WHO and EPA guidance shape multinational policy, adding layers of compliance that elevate fixed costs[2]U.S. Environmental Protection Agency, “Provisional Toxicity Values for Acrylic Acid,” epa.gov. Downstream converters, particularly adhesive plants, must redesign ventilation to meet lowered indoor-air targets. Short-term capacity utilisation can dip as retrofits proceed, tempering acrylic acid market growth in highly regulated regions.
Propylene Price Volatility
Interruptions at ageing propylene oxide assets and refinery rationalisations squeeze monomer margins, prompting firms to accelerate propane dehydrogenation and bio-route investments. Cracker integration or offtake agreements hedge exposure, but spot markets remain prone to double-digit swings that distort quarterly earnings. Producers in Asia-Pacific face amplified risk given the region’s wider import dependency for chemical-grade propylene. Feedstock turbulence encourages customers to seek long-term supply contracts with integrated vendors, consolidating volume with major players. The acrylic acid market thus experiences episodic destocking cycles whenever propylene spikes, particularly across price-sensitive coating derivatives.
*Our forecasts treat driver/restraint impacts as directional, not additive. The impact forecasts reflect baseline growth, mix effects, and variable interactions.
Segment Analysis
By Derivative: Versatile Butyl Acrylate Defends Volume Supremacy as SAP Accelerates
Butyl acrylate contributed 46.98% of 2025 shipments on the strength of broad coating, adhesive, and sealant usage. Its balance of flexibility, weatherability, and cost efficiency secures formulation loyalty across the construction and packaging industries. However, demographic trends that lift hygiene standards stoke super-absorbent polymer (SAP) demand, giving SAP derivatives the highest 5.53% CAGR through 2031. SAP producers exploit acrylic acid’s capacity to form highly cross-linked networks that absorb liquids exceeding several hundred times their own weight. Specialty streams such as methyl acrylate enjoy steady niche orders for rapid-cure transmission-coating systems, whereas ethyl acrylate supports textile and leather finishing requiring deep fibre penetration. Two-ethylhexyl acrylate remains the tackifier of choice for pressure-sensitive adhesive labels. Glacial acrylic acid underpins electronics and pharmaceutical intermediates, where 99%+ purity ensures minimal trace metals.


By Application: Performance Adhesives Pull Ahead of Legacy Coatings
Paints and coatings retained 35.46% volume in 2025 thanks to ongoing infrastructure spending, yet adhesives and sealants display a 7.01% CAGR that edges out traditional coating increments. High-clarity, UV-resistant acrylic pressure-sensitive adhesives dominate electronic display lamination and exterior automotive trim, accelerating monomer uptake. Sanitary products leverage advances in cross-link density to reduce core thickness while maintaining absorption metrics, thereby lowering logistics costs. Surfactant applications tap acrylic acid’s amphiphilic property set to improve detergency across concentrated laundry formats. Textile treatments incorporate acrylic derivatives for durable water repellency and anti-soiling finishes that survive multiple wash cycles. Consequently, the acrylic acid market realigns toward high-value bonding solutions that satisfy miniaturisation in electronics and net-zero body-weight targets in automotive.
By Purity Grade: Technical Grade Retains Volume Edge while Glacial Grades Surge
Technical grade (~94% purity) served 88.74% of 2025 demand, largely feeding high-tonnage paints, adhesives, and SAP plants where cost considerations dominate. Nonetheless, glacial grade (more than or equal to 99% purity) advances at a 7.18% CAGR through 2031 as electronics, semiconductor encapsulation, and pharmaceutical actives mandate extremely low ion and metal content. Semiconductor fabs specify ultra-high-purity monomer for photo-resist and underfill formulations, elevating margins significantly over bulk grades. Downstream clients validate supply chains by auditing distillation and ion-exchange polishing trains, tightening entry barriers for new producers.
By End-User Industry: Personal Care Maintains a Rare Balance of Scale and Momentum
Personal care and hygiene dominated 39.85% global offtake in 2025 and will still pace the field with 5.48% CAGR to 2031. Brand owners push thinner, more discreet diaper cores and eco-framed feminine hygiene articles, both of which rely on super-absorbent polymer innovation. Building and construction employ acrylic dispersions in façade coatings that marry crack-bridging flexibility with low VOC compliance.
Automotive and transportation increasingly specify acrylic structural adhesives and thermal-management compounds for electric-vehicle battery packs. Electrical and electronics sectors demand high-purity grades for optically clear adhesive lamination and potting compounds that protect delicate circuitry. Packaging benefits from waterborne acrylic barriers, enabling fibre-based substrates to replace single-use plastics, while agriculture deploys SAP granules to cut irrigation frequency and boost seed germination.
Geography Analysis
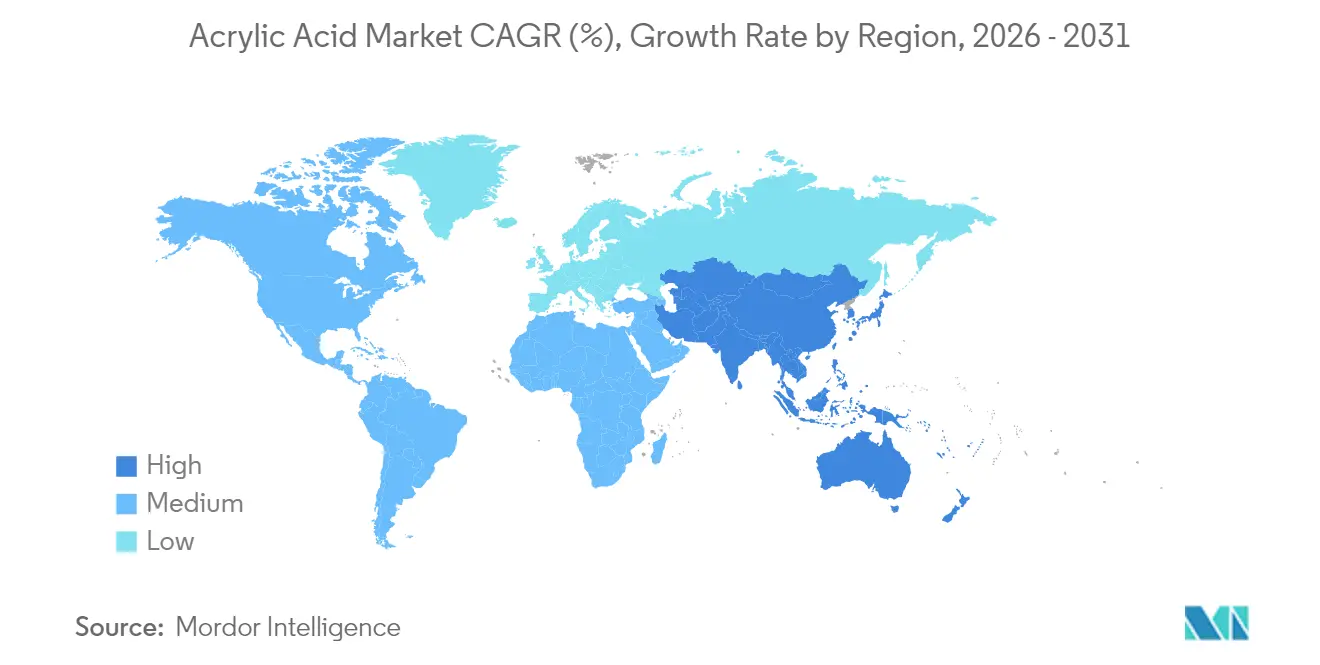
Asia-Pacific accounted for 52.10% of global volume in 2025 and is projected to expand at a 5.36% CAGR to 2031. Regional producers capitalise on efficient cracker-to-ester integration, yet downstream consumption rises even faster as urbanisation, hygiene mandates, and infrastructure build intensify. China guides its chemical-industry roadmap toward higher-value chains, encouraging firms such as Wanhua to broaden into acrylic esters under governmental self-sufficiency drives.
North America maintains a resilient supply outlook anchored by integrated Gulf Coast complexes. US producers benefit from shale-advantaged propylene yet face environmental disclosure obligations that spur investment in bio-routes and carbon accounting. Electrical and electronics demand for ultra-high-purity glacial grades supports incremental debottlenecking.
Europe advances sustainability leadership through mandatory scope-3 reporting and circular-economy directives. The Middle East and Africa record the smallest base but witness a pronounced uptick in capacity planning as petrochemical producers capture value through derivative integration. Kuwait Petroleum’s equity entry into Wanhua underscores Gulf entities’ strategy to access Asian demand corridors. Collectively, geographic dynamics elevate the acrylic acid market as a cornerstone feedstock across differentiated economic stages.

Value Chain Analysis
Acrylic acid value chains typically start with propylene, or alternative routes such as propane-based and bio-based intermediates, and then move through catalytic oxidation to produce acrylic acid (technical and glacial grades). From there, converters turn the monomer into derivatives including acrylate esters such as butyl acrylate and 2-ethylhexyl acrylate, along with super-absorbent polymers used across coatings, adhesives, and hygiene applications.
The supply base is concentrated around integrated producers and large-scale site operators, including BASF, Arkema, Dow, NIPPON SHOKUBAI CO., LTD., LG Chem, and major Chinese suppliers such as Shanghai Huayi and Satellite Chemical. Co-location of upstream monomer, esterification, and SAP units reduces logistics intensity and improves feedstock utilization. Distribution typically relies on bulk contract volumes for large downstream converters, with spot sales adding volatility when logistics tighten. In 2026, regional tightness and logistics constraints were linked to sharp price swings, with bottlenecks centered on feedstock cost pass-through, storage and transport availability, and plant reliability. Producer actions such as BASF price increases for glacial acrylic acid in the United States in 2026 show how energy, raw materials, and freight costs can transmit quickly through the chain, influencing buyer procurement behavior and supporting longer-term supply arrangements with integrated vendors.
Competitive Landscape
Global acrylic acid production remains highly consolidated. LG Chem disrupts through 100% bio-based monomer commercialisation, aligning with consumer-goods companies’ renewable-content pledges. Chinese entrants such as Wanhua employ advantaged propylene supply and state-backed financing to construct world-scale reactors, intensifying rivalry. Strategy centres on feedstock optionality, certified bio-content, and application-specific innovation. Process licensors offer bundled catalyst and evaporative crystallisation packages that shrink energy intensity by double digits. Digital twins optimise reactor uptime, while predictive maintenance reduces unscheduled shutdowns that previously destabilised the acrylic acid market supply.
Acrylic Acid Industry Leaders
Arkema
LG Chem
BASF
Dow
NIPPON SHOKUBAI CO., LTD.
- *Disclaimer: Major Players sorted in no particular order


Market Opportunities and Future Outlook
Decarbonization-linked procurement and certified mass-balance programs open opportunities for differentiated acrylic acid and derivative offerings, particularly where brand owners and converters specify lower-carbon monomers for hygiene, packaging, and coatings. The shift is evident in 2025 and 2026 as companies move from certification pledges to operational coverage, including Arkema expanding ISCC PLUS certification across its acrylic monomer facilities globally (including Carling, Clear Lake, Taixing, and Bayport). NIPPON SHOKUBAI CO., LTD. also reported ISCC PLUS certification at its US group companies for acrylic acid and superabsorbent polymers, while LG Chem scaling plant-based acrylic acid output supports positioning where carbon-footprint transparency is becoming a bid requirement.
On the supply and portfolio side, opportunities center on asset optimization, reliability, and placement in higher-purity and higher-value chains rather than volume-only exposure. China continues to add world-scale capacity, including Tianjin Bohai Chemical commissioning a 160,000 tons/year acrylic acid unit in June 2026 within a larger new materials project, and BASF advancing its integrated Zhanjiang Verbund acrylics complex through mechanical completion in July 2025. Ownership and focus shifts also influence how monomer participation evolves, including Synthomer moving to divest its Czech-based acrylate monomers business to Mutares (announced June 2026, with closing targeted for end-Q3 2026), which can change sourcing, tolling, and regional supply security strategies for buyers and suppliers.
Recent Industry Developments
- June 2026: Tianjin Bohai Chemical commissioned a 160,000 tons/year acrylic acid unit under a 2.25 billion yuan new materials project after a successful trial run in mid-June. The start-up adds large-scale supply in China and strengthens local integration options for downstream acrylates and SAP, shifting regional trade flows and procurement leverage.
- July 2025: BASF achieved mechanical completion of the glacial acrylic acid and butyl acrylate plants at its Zhanjiang Verbund site in China, moving the acrylics complex into commissioning and start-up. The integrated site design supports feedstock and utilities efficiencies and increases BASF ability to serve Asia-Pacific coatings, adhesives, and hygiene demand with a shorter supply chain.
- April 2024: BASF signed a Letter of Intent with Youyi Group to supply butyl acrylate from the Zhanjiang Verbund site. The agreement framework links new Chinese capacity to downstream consumption planning and supports offtake visibility as large integrated projects ramp up.


Research Methodology Framework and Report Scope
Market Definition and Coverage
For this study, the acrylic acid market covers demand and supply of acrylic acid used as a chemical building block, with market sizing expressed in volume terms (tons) across major producing and consuming regions.
Scope exclusions: We exclude internal plant transfers that are not linked to external sales, as well as downstream polymer and formulated product revenues where acrylic acid is only an input.
Segmentation Overview
- By Derivative
- Methyl Acrylate
- Butyl Acrylate
- Ethyl Acrylate
- 2-Ethylhexyl Acrylate
- Glacial Acrylic Acid
- Superabsorbent Polymer
- By Application
- Paints and Coatings
- Adhesives and Sealants
- Sanitary Products
- Surfactants
- Textiles
- Other Applications
- By Purity Grade
- Technical Grade (~94 %)
- Glacial Grade (more than or equal to 99%)
- Ultra-high Purity (Electronics)
- By End-user Industry
- Personal Care and Hygiene
- Building and Construction
- Automotive and Transportation
- Electrical and Electronics
- Packaging
- Agriculture and Horticulture
- By Geography
- Asia-Pacific
- China
- India
- Japan
- South Korea
- Australia
- Indonesia
- Malaysia
- Thailand
- Vietnam
- Rest of Asia-Pacific
- North America
- United States
- Canada
- Mexico
- Europe
- Germany
- United Kingdom
- France
- Italy
- Spain
- Nordic Countries
- Turkey
- Russia
- Rest of Europe
- South America
- Brazil
- Argentina
- Colombia
- Rest of South America
- Middle-East and Africa
- Saudi Arabia
- United Arab Emirates
- Qatar
- Egypt
- Nigeria
- South Africa
- Rest of Middle-East and Africa
- Asia-Pacific
Data Sources, Market Sizing, and Validation
Desk Research
Desk work started with public production and trade signals to understand how much acrylic acid is being made and moved across borders, and how this has shifted over time. We relied on sources such as national statistics offices and customs portals, UN Comtrade, USITC trade data, the International Energy Agency for energy and feedstock context, and peer-reviewed chemical engineering and catalysis literature for process and yield benchmarks.
After that, company annual reports, investor presentations, and plant-level press releases were used to map capacity additions, shutdowns, and utilization swings. In this market, those utilization changes often line up with short-term supply constraints and can affect regional balances. A paid subscription for company financials and news, plus a shipment-level import and export database, helped cross-check trade directions, product descriptions, and timing when public tables were delayed or aggregated. These desk sources are not exhaustive, and many other public documents were also referenced for data collection, validation, and clarification.
Primary Interviews and Surveys
Primary work focused on validating run rates, utilization, and typical price movement patterns across key regions, since acrylic acid pricing is sensitive to propylene and other feedstock costs and to short supply periods driven by outages. We spoke with producers, distributors, and large downstream buyers, then used follow-up calls to sanity check assumptions on regional supply balance and how contract versus spot pricing behaves when outages tighten availability.
Global coverage was maintained so regional shocks, such as maintenance cycles or export shifts, were not overweighted from a single viewpoint. Final model inputs were adjusted only when multiple respondent views aligned with observable desk signals.
Distribution of primary research fieldwork respondents
| Company type | Respondent position | Region |
|---|---|---|
| Top tier: 29% | CXOs: 19% | APAC: 47% |
| Mid tier: 50% | Functional/Unit leaders: 35% | EMEA: 33% |
| Smaller Players: 21% | Managers: 46% | Americas: 20% |
Market-Sizing & Forecasting
The core sizing model is built using a top-down approach where capacity, utilization, and net trade are used to reconstruct regional availability, which is then reconciled to estimated consumption by major end-use pull. Once that backbone was stable, we corroborated it with selective bottom-up checks, including sampled producer volumes, distributor channel checks, and typical tons consumed per downstream application. Adjustments were made only where the gaps were clearly explained.
Key inputs tracked in the model include announced and operating acrylic acid capacity by region, utilization and downtime patterns, propylene and other relevant feedstock cost direction, regional import and export volumes, and observable demand indicators from hygiene and coatings activity that typically pull acrylic derivatives. For forecasting, scenario analysis was used around supply additions, shutdown timing, and trade policy shifts, and the scenario weights were aligned to expert consensus from primary discussions. Where bottom-up checks could not cover smaller flows, we filled gaps through region-level allocation rules tied to trade shares and historical utilization bands, so the totals remain repeatable and auditable.
Data Validation & Update Cycle
Outputs were checked against independent signals such as capacity change announcements, trade totals, and known maintenance calendars. Any sharp year-to-year jump was flagged for review before sign-off. When a variance could not be explained through a clear event, the assumption was revisited, and respondents were re-contacted to confirm whether the change was real or timing-related.
A multi-step analyst review is followed so the final number is consistent across regions, units, and conversions, and the logic can be traced back to the same set of drivers. Reports are refreshed annually, with interim updates when material events occur. A final pre-delivery pass is completed so clients receive the latest view available at the time of release.
Mordor Intelligence's Acrylic Acid Market Size Compared Against Other Published Estimates
Published sizes for acrylic acid often do not match because some sources report value, others report volume, and many also vary on what they treat as in-scope trade and how they smooth short-term price swings. Differences also come from the timing of currency conversion, the use of spot versus contract pricing, and whether plant downtime and utilization are validated with real market checks.
A refresh-led gap is common in this market because acrylic acid prices can move quickly with propylene and outage news. The month and exchange-rate window used for ASP building can shift the same physical demand into a different USD total, which is why Mordor Intelligence anchors the estimate to annually refreshed volume fundamentals. Currency timing and price logic are applied only after those checks are consistent.
Benchmark comparison
| Source | Market Size | Gaps in Research Methodology |
|---|---|---|
| Mordor Intelligence | USD 8.59 M (2026) | |
| Global Consultancy A | USD 13.66 B (2023) | Uses a value-based view with its own pricing curve and base-year choices, and the number is sensitive to the selected average price window and FX conversion timing rather than being anchored to a volume-first balance. |
| Industry Publisher B | USD 9.98 B (2026) | Publishes a USD figure for the same year but may apply a different ASP progression method across regions and may not fully normalize temporary supply outages that can inflate realized prices in short periods. |
Overall, the spread in published figures is mainly explained by unit choice (tons versus USD), the exact price and currency windows used, and how tightly utilization and trade checks are enforced before finalizing totals. By keeping the steps traceable from capacity and trade to consumption, and only then layering pricing assumptions, the final estimate stays practical to reproduce and easier to compare across years.


Key Questions Answered in the Report
What is the current size of the acrylic acid market?
The acrylic acid market size is 8.59 million t in 2026 and is projected to reach 11.01 million t by 2031.
Which derivative holds the largest share?
Butyl acrylate leads, representing 46.98% of global volume in 2025.
Which region dominates consumption?
Asia-Pacific accounts for 52.10% of worldwide demand owing to strong hygiene and infrastructure activity.
Why are bio-based grades gaining traction?
Certified bio-content lowers product carbon footprints and meets brand-owner sustainability targets, fostering rapid adoption in Europe and North America.
What is driving the fast growth of adhesives?
Electronics miniaturisation and automotive lightweighting favour acrylic adhesives that combine clarity, UV stability and mechanical strength, producing a 7.01% CAGR through 2031.
Page last updated on:






