
Acetone Market Size and Share
Market Overview
| Study Period | 2020 - 2031 |
|---|---|
| Market Size (2026) | USD 7.71 Billion |
| Market Size (2031) | USD 10.6 Billion |
| Growth Rate (2026 - 2031) | 6.58 % |
| Fastest Growing Market | Asia Pacific |
| Largest Market | Asia Pacific |
| Market Concentration | Medium |
Major Players *Disclaimer: Major Players sorted in no particular order Image © Mordor Intelligence. Reuse requires attribution under CC BY 4.0. | |
Acetone Market Analysis by Mordor Intelligence
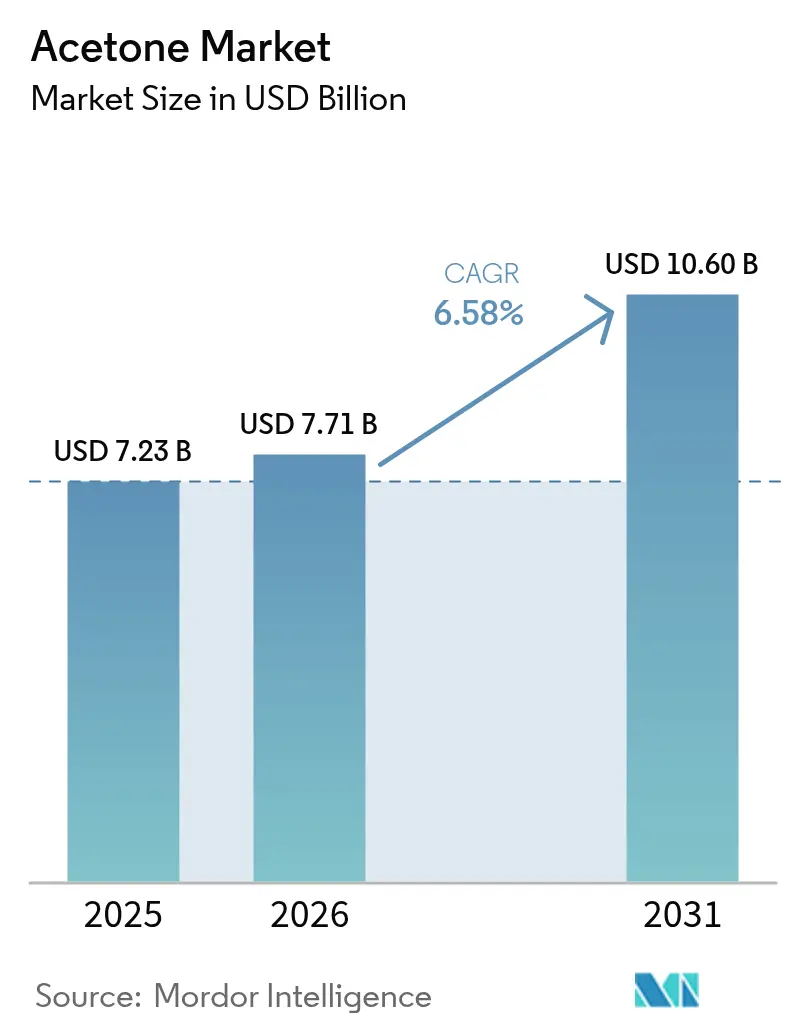
The Acetone market size is expected to grow from USD 7.23 billion in 2025 to USD 7.71 billion in 2026 and is forecast to reach USD 10.6 billion by 2031 at 6.58% CAGR over 2026-2031. This market size trajectory is supported by acetone’s expanding role as a VOC-exempt solvent, a feedstock for methyl methacrylate (MMA) and bisphenol A (BPA) co-production, and a high-purity medium for pharmaceutical manufacturing. Electric vehicle lightweighting, personal care demand in emerging economies, and post-COVID pharmaceutical capacity additions are accelerating volume growth. At the same time, bio-acetone technologies are eroding the dominance of cumene-based supply chains, while regulatory pressures on BPA and refinery rationalizations tighten traditional feedstock availability. Competitive dynamics remain moderate as vertically integrated majors secure raw materials and downstream outlets, even as biotechnology start-ups demonstrate carbon-negative acetone routes that could re-set industry cost curves.
Key Report Takeaways
- By application, solvents led with a 42.82% revenue share in 2025, whereas methyl methacrylate is projected to advance at a 7.12% CAGR through 2031.
- By end-use industry, paints, coatings, and adhesives accounted for 37.35% of 2025 sales, while cosmetics and personal care are expanding at a 6.95% CAGR.
- By production process, the cumene route held 82.95% of the acetone market share in 2025, even as bio-fermentation is growing at 7.92% CAGR.
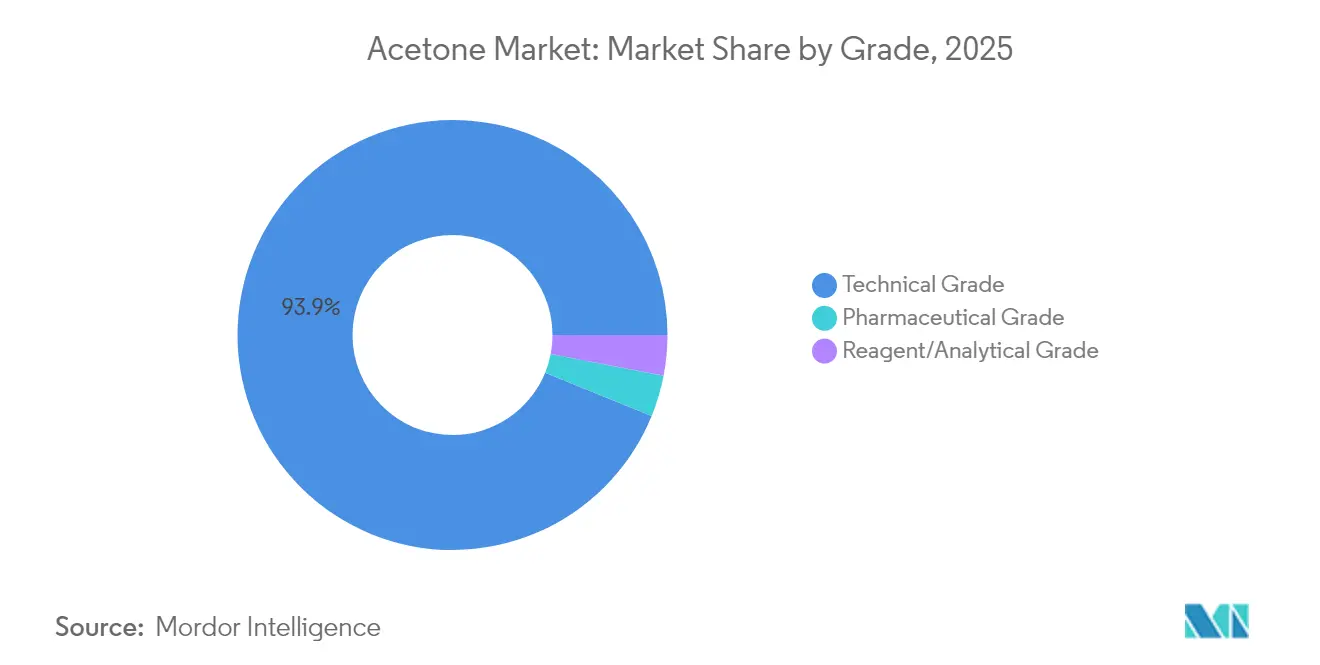
- By grade, technical quality dominated volume with 93.85%, whereas pharmaceutical grade is rising at a 7.45% CAGR on the back of API demand.
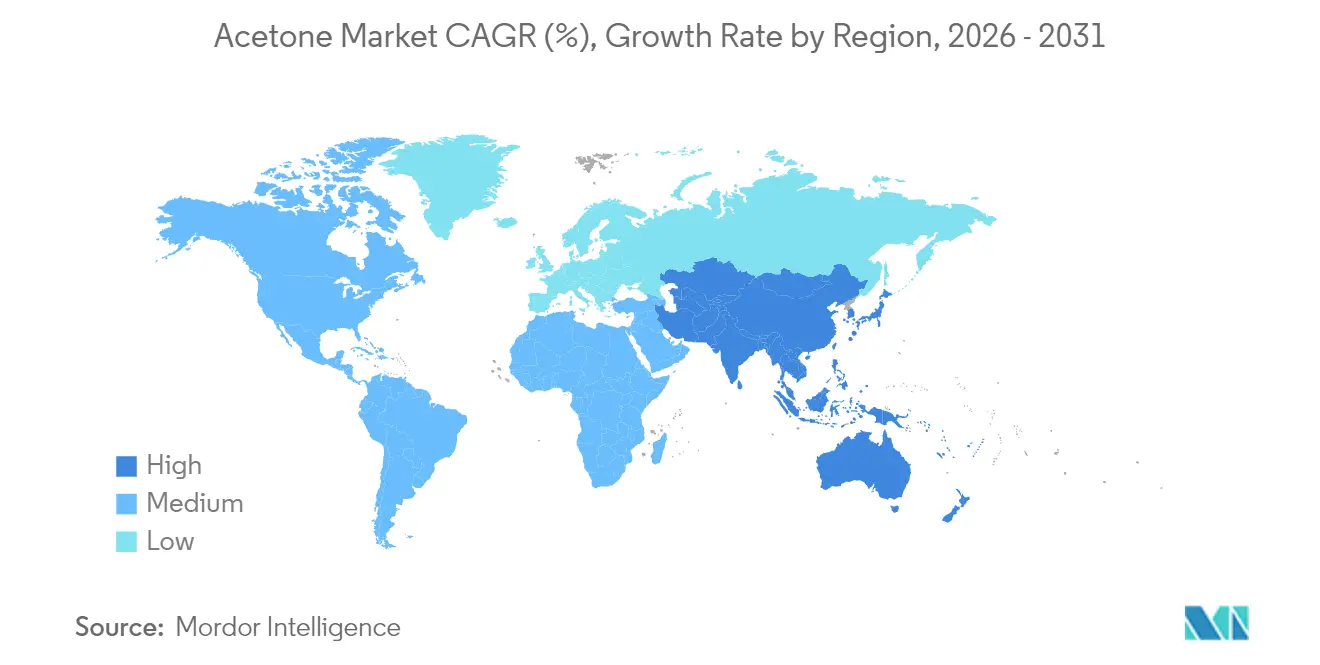
- By geography, Asia Pacific captured 42.18% of global sales in 2025 and is poised to grow at a 7.25% CAGR to 2031.
Note: Market size and forecast figures in this report are generated using Mordor Intelligence’s proprietary estimation framework, updated with the latest available data and insights as of 2026.
Market Trends and Insights
Drivers Impact Analysis of Acetone Market*
| Driver | (~) % Impact on CAGR Forecast | Geographic Relevance | Impact Timeline |
|---|---|---|---|
| Surging demand for MMA-based acrylic sheets in EV light-weighting | +1.80% | Global, with concentration in China, North America, and Europe | Medium term (2-4 years) |
| Rising polycarbonate consumption in consumer electronics | +0.90% | Asia Pacific core, spill-over to North America and Europe | Short term (≤ 2 years) |
| Expansion of personal-care solvent demand in Southeast Asia | +0.70% | Southeast Asia, with early gains in Thailand, Vietnam, and Indonesia | Medium term (2-4 years) |
| Growing pharmaceutical API solvent requirements post-COVID | +0.60% | Global, with emphasis on India, China, and North America | Long term (≥ 4 years) |
| Bio-acetone cost parity via waste-glycerol fermentation | +0.50% | North America and Europe, with pilot projects in Asia Pacific | Long term (≥ 4 years) |
| Source: Mordor Intelligence | |||
Surging Demand for MMA-Based Acrylic Sheets in EV Lightweighting
Electric vehicle makers are replacing glass and metal with MMA-based acrylic sheets to cut curb weight, which multiplies acetone demand because MMA consumes roughly 0.5 pounds of acetone per pound produced. The average North American auto contained USD 4,371 worth of chemistry in 2023, underscoring the material intensity of modern vehicles[1]American Chemistry Council, “2023 Automotive Chemicals Economic Impact,” americanchemistry.com . Stricter CAFE fuel-economy rules heighten the appeal of acrylic glazing over heavier substrates. Mitsubishi Chemical Group has advanced microwave-assisted PMMA recycling, creating a closed-loop premium that further strengthens downstream pull on the acetone market.
Expansion of Personal-Care Solvent Demand in Southeast Asia
Rising incomes and urbanization in Southeast Asia are reshaping beauty routines, making acetone a preferred solvent for nail polish removers and cosmetic blends. The chemical’s rapid evaporation and low dermal irritation suit premium formulations. Local producers capitalize on acetone’s VOC-exempt status, avoiding the stricter emission fees faced by alternative solvents and enhancing cost competitiveness across Thailand, Vietnam, and Indonesia.
Growing Pharmaceutical API Solvent Requirements Post-COVID
API manufacturers have built new capacity to secure supply resilience after COVID-19. Acetone’s high purity and established pharmacopeia listings make it a go-to crystallization medium. Its low boiling point allows efficient solvent recovery, cutting waste and aligning with sustainability targets. Regulatory adoption of process analytical technology (PAT) favors solvents with robust data packages, boosting demand for pharmaceutical-grade acetone.
Bio-Acetone Cost Parity via Waste-Glycerol Fermentation
Waste glycerol streams from biodiesel are now purified to over 80% glycerol, enabling cost-effective fermentation toward acetone at near-parity with petro-routes. LanzaTech’s carbon-negative pathway reports greater than 99% recovery and high-purity output, offering scope to displace cumene feed entirely. Policy signals such as the US target to source 30% of chemicals from biomanufacturing by 2040 underpin long-term scale-up opportunities.
Restraints Impact Analysis of Acetone Market*
| Restraint | (~) % Impact on CAGR Forecast | Geographic Relevance | Impact Timeline |
|---|---|---|---|
| Tightening BPA regulations by EU & ECHA | -0.80% | Europe, with potential spillover to North America and Asia Pacific | Short term (≤ 2 years) |
| Refinery closures curbing cumene feedstock supply | -0.40% | North America and Europe, with secondary impacts in Asia Pacific | Medium term (2-4 years) |
| Emerging VOC limits on solvent use | -0.30% | Global, with stricter implementation in developed markets | Long term (≥ 4 years) |
| Source: Mordor Intelligence | |||
Tightening BPA Regulations by EU & ECHA
The EU enforced broad BPA restrictions in January 2025 for food-contact articles, reducing phenol-acetone co-production volumes and removing a notable outlet for acetone in Europe. Producers must pivot to MMA, solvents, or bio-routes to cushion the demand gap. Parallel debates in North America and parts of Asia may duplicate regulatory limits, compounding pressure on cumene-based operations.
Emerging VOC Limits on Solvent Use
While acetone is VOC-exempt under most rules, evolving aerosol and petro-facility standards create layered compliance duties for formulators. The EPA pushed back new aerosol coating VOC thresholds to January 2027 to refine test protocols[2]Federal Register, “National Volatile Organic Compound Emission Standards for Aerosol Coatings,” federalregister.gov . Canada forecasts 488,000 t cumulative VOC cuts from oil facilities by 2045, costing industry USD 1.2 billion[3]Government of Canada, “Regulations Respecting Reductions in the Release of Volatile Organic Compounds,” canada.ca . Downstream users invest in closed-loop emissions systems, raising capital hurdles for small firms.
*Our forecasts treat driver/restraint impacts as directional, not additive. The impact forecasts reflect baseline growth, mix effects, and variable interactions.
Acetone Market Segment Analysis
By Application:
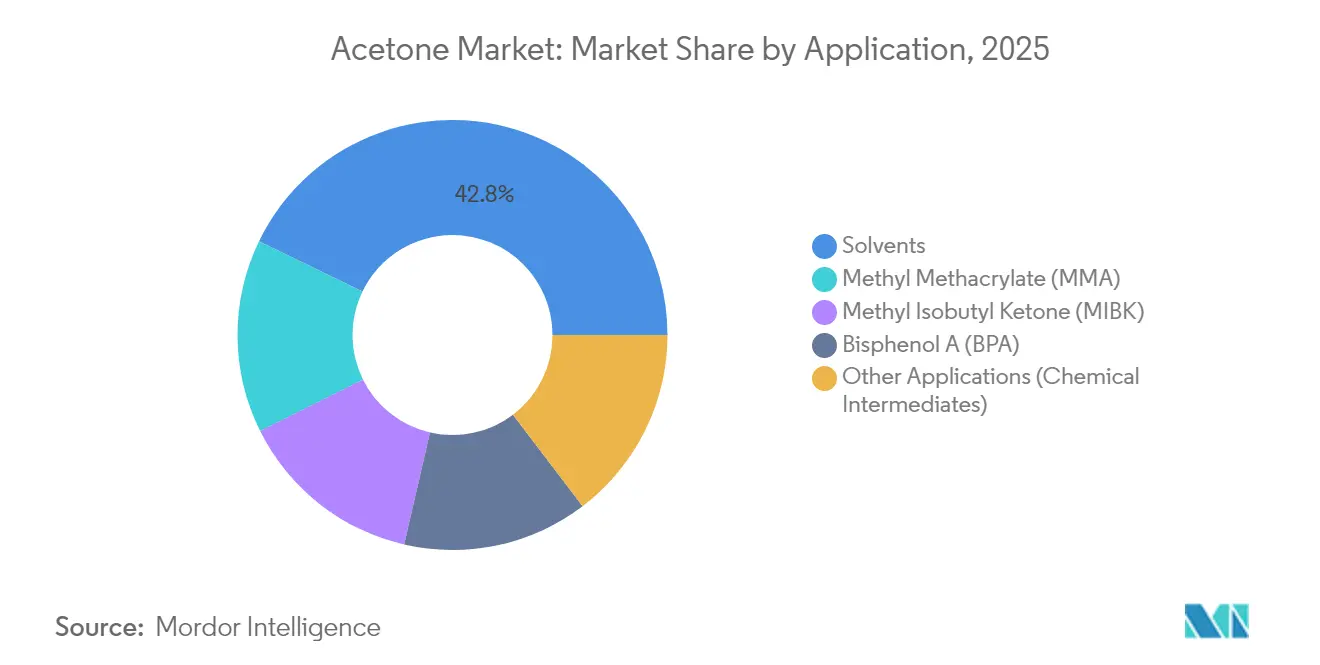
Solvents Sustain Leadership while MMA AcceleratesSolvents held 42.82% of 2025 revenues, supported by acetone’s rapid evaporation and exemption from most VOC caps, especially in paints and adhesives. MMA is the fastest riser at 7.12% CAGR as acrylic glazing replaces glass in electric vehicles and construction. The bisphenol A segment faces regulatory drag, yet consumer electronics sustain some BPA volume through polycarbonate use. Methyl isobutyl ketone and specialty intermediates provide niche growth by leveraging acetone’s versatile reactivity.
Supply-side changes are equally stark. Automotive lightweighting magnifies MMA pull, whereas microwave PMMA recycling from Mitsubishi Chemical Group creates circular demand loops that lengthen acetone market opportunity windows. Solvent blenders prize acetone for miscibility across polarities, permitting lower VOC coatings that meet tougher emission caps without costly reformulation. Overall, application mix diversification shields the acetone market from single-segment shocks even as BPA curbs unfold.



By End-Use Industry:
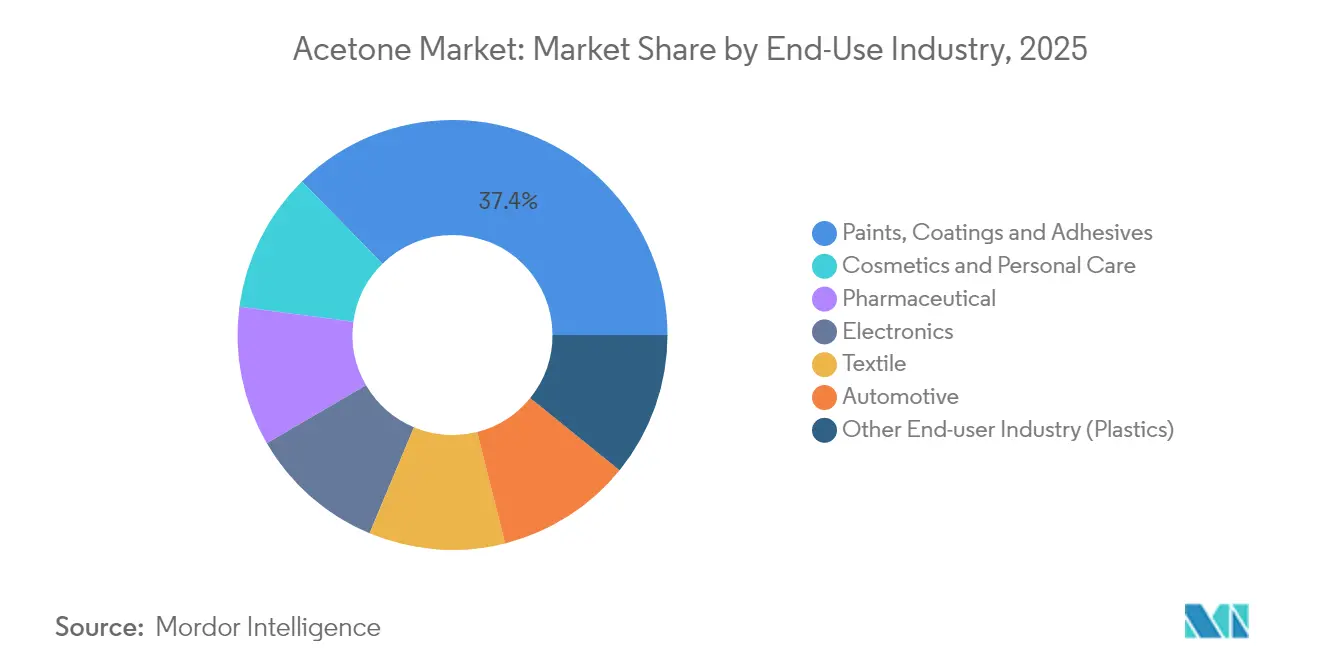
Personal Care Outpaces Established SegmentsPaints, coatings, and adhesives consumed 37.35% of acetone in 2025 due to broad industrial adoption, yet cosmetics and personal care post the highest 6.95% CAGR to 2031. Southeast Asia’s rising middle class fuels nail polish and skincare volumes, where acetone’s low irritation profile is prized. Electronic devices channel acetone through polycarbonate resins, locking in stable demand. Automotive applications grow through MMA-based acrylic panels, while pharmaceuticals expand alongside new API plants in Asia.
Stable demand diversity bolsters resilience. Personal care formulators exploit acetone’s dual miscibility to pair water and oil actives in a single product, raising formulation flexibility. In North America and Europe, professional salon chains adopt acetone-rich removers that cut service times, boosting repeat purchase cycles. Industrial end users maintain baseline volume through architectural coatings that need fast dry times.
By Production Process:
Fermentation Chips Away at Cumene DominanceThe cumene route supplied 82.95% of global output in 2025 by leveraging mature integration with phenol units. Fermentation methods, however, grow at 7.92% CAGR on the back of waste glycerol and syngas substrates. Isopropanol oxidation offers balancing flexibility for companies that already manufacture IPA, while direct propylene oxidation is pursued in technology pilots but remains niche.
INEOS deployed a heat-integrated design at its Marl complex to slice emissions in half compared to prior cumene benchmarks. In contrast, LanzaTech’s waste-gas fermentation delivers carbon-negative acetone at greater than 99% recovery, signaling the scale-up path for bio-routes. Policy incentives and consumer demand for low-carbon products imply a gradual realignment of the acetone market toward mixed feedstock portfolios.
By Grade:
Pharmaceutical Purity Commands Premium MarginsTechnical grade product met 93.85% of 2025 demand given its cost advantage in coatings, inks, and construction. Pharmaceutical grade expands at 7.45% CAGR as India and China add API reactors that rely on high-purity solvents. Reagent and analytical grades represent small but stable outlets tied to research spending.
API facilities favor acetone because it leaves minimal residues and allows efficient solvent recovery, aligning with green chemistry metrics. Continuous-flow reactors intensify throughput, and acetone’s predictable boiling point supports steady-state operation without equipment corrosion. Upgraded distillation trains let operators recycle acetone multiple cycles, amplifying effective supply without proportional raw material intake.
Geography Analysis
APAC Acetone Market
Asia Pacific captured 42.18% of 2025 volume owing to China’s vast phenol–acetone and BPA base and Southeast Asia’s expanding niche chemicals clusters. The region is projected to post a 7.25% CAGR to 2031 as local demand outstrips OECD growth. Government chemical industry roadmaps emphasize self-sufficiency and higher value products, steering capital into integrated refineries that can toggle between fuels and petrochemicals amid margin swings. China processed 14.8 million b/d of crude in 2023, underscoring feedstock availability for downstream acetone units.
North America and Europe Acetone Market
North America enjoys a strong automotive and aerospace lightweighting pull, although refinery closures narrow the propylene supply for cumene. Europe faces the sharpest regulatory scrutiny on BPA but offsets some volume loss through sustainable production investments. INEOS’s Marl facility exemplifies strategy that pairs feedstock control with carbon-cuts to future-proof acetone supply.
South America and MEA Acetone Market
South America’s industrialization, especially in Brazil, invites new imports as local capacity remains limited. State incentives to build chemical parks around ethanol feedstocks could spur fermentation projects over the forecast period. In the Middle East and Africa, low-cost naphtha and LPG underpin greenfield petrochemical complexes that include phenol–acetone integration, providing export-oriented supply but limited domestic pull.

Regulatory Landscape
Acetone is regulated as an industrial chemical and hazardous substance across major jurisdictions, with compliance focused on registration, classification and labeling, and worker exposure controls. In the European Union, acetone is managed under REACH (Regulation (EC) No 1907/2006) and CLP (Regulation (EC) No 1272/2008), which shape producer and importer obligations for dossiers, labeling, and safe-use communication across the supply chain.
Trade and workplace rules also influence market flows and operating practices. In the United States, acetone is listed on the TSCA Inventory, OSHA maintains a permissible exposure limit of 1,000 ppm (8-hour TWA), and trade remedies were reaffirmed in February 2026 when US authorities confirmed continuation of antidumping duty orders covering imports from Belgium, Singapore, South Africa, South Korea, and Spain, reinforcing compliance and cost considerations for import-dependent buyers and distributors.
Value Chain Analysis
The acetone value chain is anchored in petrochemical feedstocks and integrated phenol economics. Upstream, benzene and propylene are converted to cumene and then to cumene hydroperoxide, which is cleaved to phenol and acetone in a fixed co-product relationship. This linkage limits stand-alone acetone supply responses when downstream phenol and BPA demand shifts. Alternative production includes isopropanol oxidation (where IPA integration provides flexibility) and emerging bio-based fermentation routes using waste-derived substrates.
Midstream operations include purification and grading, dominated by technical grade with smaller volumes of higher-purity pharmaceutical and analytical grades, followed by bulk storage, tank-truck/rail/marine logistics, and regional distribution to formulators and chemical manufacturers. Downstream demand centers on solvents, including paints, coatings, and adhesives, as well as MMA and other intermediates, with buying patterns influenced by local VOC frameworks and quality requirements. Cross-border trade is a key balancing mechanism given Asia-Pacific concentration, and trade actions such as the February 2026 US administrative review activity on acetone from South Korea highlight how policy can redirect flows for major regional suppliers and US import channels.
Competitive Landscape
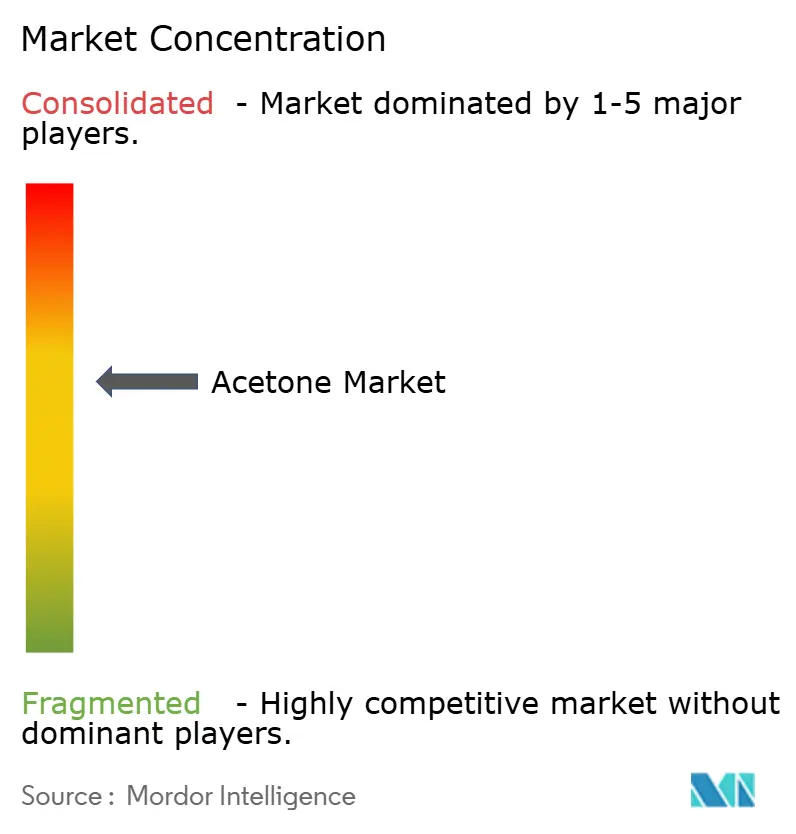
The acetone market displays moderately consolidated concentration. BASF, INEOS, and Mitsui Chemicals anchor global supply with integration from cumene through downstream acrylic monomers. BASF introduced bio-based ethyl acrylate with 40% certified bio content to capture premium demand for sustainable ingredients. INEOS expanded capacity by 750 kt of cumene in Germany while shrinking facility emissions through energy integration.
Start-ups such as LanzaTech add competitive tension by offering carbon-negative bio-acetone using waste gases at an industrial scale. M&A appetite cooled in 2024, yet nearly half of chemical executives plan to accelerate dealmaking to secure specialty assets and green technologies. Pharmaceutical-grade solvent supply and bio-feedstock platforms remain sought-after targets.
Technology innovation centers on circularity. Mitsubishi Chemical Group’s PMMA recycling recovers monomer feed that loops back to acetone-derived MMA, creating cradle-to-cradle pull on supply. Process optimizations such as advanced heat integration, improved catalysts, and closed-loop solvent management bolster cost positions while ensuring regulatory compliance, sustaining incumbent leadership even as new entrants chip away at margins.
Acetone Industry Leaders
BASF SE
INEOS
Mitsui Chemicals Inc.
Moeve
Formosa Chemicals & Fibre Corp.
- *Disclaimer: Major Players sorted in no particular order
Acetone Market Companies Covered in this Report
- Altivia
- BASF SE
- Borealis GmbH
- Deepak
- Formosa Chemicals & Fibre Corp.
- Honeywell International Inc.
- INEOS
- Kumho P&B Chemicals
- LG Chem
- Mitsui Chemicals Inc.
- Moeve
- PTT Phenol Co. Ltd.
- SABIC
- Shell plc
- Ufaorgsintez (Bashneft)

Market Opportunities and Future Outlook
A key whitespace is separating acetone supply from phenol co-product constraints through low-carbon and alternative-route production, while keeping product quality aligned with high-spec uses. Industrial and research activity around electrochemical, catalytic, and fermentation-based pathways supports this direction, including a June 2026 commercial order for an anion exchange membrane (AEM) electrolyzer system (Power to Hydrogen for SINTEF) tied to green acetone production via CO2 fermentation. This gives buyers a clearer commercialization path for differentiated, lower-emission solvent and intermediate inputs, especially where brand and regulatory pressure favors traceable sustainability claims.
Regional trade and capacity shifts also create opportunities for logistics, distribution, and customer re-sourcing. China continued large-scale capacity additions, with total acetone capacity reaching 4.328 million tons by end-2025 and domestic production estimated at 1.833 million tonnes for H1 2026, supporting greater availability for export-oriented trade. In contrast, S&P Global reported prolonged tightness in the US acetone market in June 2026 as trade flows shifted, indicating scope for suppliers with advantaged feedstocks, reliable import access, and on-spec material availability for solvent and MMA chains.
Recent Industry Developments in Acetone Market
- June 2026: S&P Global reported prolonged tightness in the US acetone market as global trade flows shifted. The update highlighted uneven regional balances, which shaped purchasing strategies for solvent and MMA supply chains and increased the premium on reliable logistics and diversified sourcing.
- June 2025: INEOS Phenol announced it would permanently cease phenol production at its Gladbeck site in Germany, which also impacts acetone output given the co-product nature of the phenolic chain. The decision pointed to the role of European energy costs and CO2-related policy in regional capacity rationalization and import dependence.
- January 2025: Mitsui Chemicals launched an initiative with Nan Ya Plastics to supply biomass-based acetone. The initiative expanded commercially available lower-carbon acetone options and supported downstream customers seeking to reduce product footprints without changing solvent functionality.


Acetone Market Report Scope and Research Methodology
Market Definition and Coverage
For this study, the acetone market is defined as the value generated from selling acetone across grades and production routes, counted at the point of sale for end-use and intermediate consumption across major regions.
Scope exclusions: We exclude internal transfers that do not reflect a market transaction, and we exclude downstream derivative product values where acetone is only an input.
Segments Covered in This Report
- By Application
- Methyl Methacrylate (MMA)
- Bisphenol A (BPA)
- Solvents
- Methyl Isobutyl Ketone (MIBK)
- Other Applications (Chemical Intermediates)
- By End-Use Industry
- Cosmetics and Personal Care
- Electronics
- Automotive
- Pharmaceutical
- Paints, Coatings and Adhesives
- Textile
- Other End-user Industry (Plastics)
- By Production Process
- Cumene Process
- Isopropanol Oxidation
- Direct Propylene Oxidation
- Bio-based Fermentation
- By Grade
- Technical Grade
- Pharmaceutical Grade
- Reagent/Analytical Grade
- By Geography
- Asia-Pacific
- China
- India
- Japan
- South Korea
- ASEAN
- Rest of APAC
- North America
- United States
- Canada
- Mexico
- Europe
- Germany
- United Kingdom
- France
- Italy
- Russia
- Rest of Europe
- South America
- Brazil
- Argentina
- Rest of South America
- Middle East and Africa
- Saudi Arabia
- United Arab Emirates
- South Africa
- Rest of Middle East and Africa
- Asia-Pacific
Data Sources, Market Sizing, and Validation
Desk Research
Desk research helped us set the base structure of supply, demand, and trade flows before any assumptions were finalized. We referenced public sources such as the USGS and similar geological and mineral statistics portals, USITC trade data, UN Comtrade, World Bank macro indicators, and customs or statistics bureau releases from key producing and consuming countries.
To make the numbers usable for a market model, we also reviewed company annual reports, investor presentations, regulatory and safety publications, and industry association materials that discuss solvents and petrochemical value chains. Where public disclosures had gaps on plant ownership, capacity status, or trade patterns, we used paid subscriptions for company financials and shipment-level import-export screening, then checked the direction of movement against public datasets. The desk sources listed above are illustrative, and we also used other public references to collect and clarify data points and confirm consistency across series.
Primary Interviews and Surveys
Primary interviews and surveys were used to pressure test the desk-built model, especially around grade mix, pricing behavior, and the split between solvent use and chemical-intermediate demand. We spoke with producers, distributors, downstream users, and technical experts across APAC, EMEA, and the Americas, so regional supply tightness and demand shifts could be reflected in the assumptions. When responses differed, follow-ups were used to align on practical ranges for utilization, import dependence, and typical contract versus spot pricing behavior.
Distribution of primary research fieldwork respondents
| Company type | Respondent position | Region |
|---|---|---|
| Top tier: 30% | CXOs: 13% | APAC: 46% |
| Mid tier: 53% | Functional/Unit leaders: 36% | EMEA: 36% |
| Smaller Players: 17% | Managers: 51% | Americas: 18% |
Market-Sizing & Forecasting
Sizing was built using a top-down and bottom-up approach, where regional acetone demand was reconstructed from downstream consumption indicators and then reconciled with supply side signals. On the top-down side, we linked acetone usage to key demand pools such as MMA and BPA production, solvent demand intensity in paints and coatings, and the level of activity in personal care and pharma manufacturing, then translated those volumes into value using region-appropriate price series.
To keep totals grounded, selective bottom-up checks were run using capacity and utilization snapshots, trade balances, and sampled price spreads across grades. This helped correct for periods where local pricing diverged from global trends. Inputs that most often moved the model were operating rates at phenol acetone units, regional net imports, propylene and benzene cost movements that feed into price setting, grade mix shifts (technical versus higher purity), and observed seasonality in coatings and consumer product output. For forecasting, scenario analysis was used to test how different utilization and trade assumptions change the price-volume outcome, and the final outlook was aligned to the ranges shared by industry participants for capacity additions and demand growth.
Data Validation & Update Cycle
Model outputs were cross-checked against independent signals such as regional trade direction, implied consumption per downstream output, and whether price movements tracked feedstock and operating-rate changes. When variances appeared, we reviewed them in multiple steps, first at the analyst level and then in an internal review where assumptions, conversions, and unit consistency were re-checked before sign-off.
If a large mismatch showed up, for example when demand implied by downstream production exceeded regional supply plus net imports, the team re-contacted sources and reworked the specific driver rather than adjusting the total loosely. Reports are refreshed annually, and interim updates are done when material events occur, such as major plant outages, new capacity start-ups, or sharp shifts in trade policy. Before delivery, a final pass is completed so the view reflects the latest available public data and market feedback.
Mordor Intelligence's Acetone Market Sizing Compared With Other Published Estimates
Published acetone market sizes can differ even when the same year is shown, because firms vary the point of valuation, the way they convert volume to value, and how strongly they check those inputs against trade and operating data. Differences also come from how grades are treated, whether spot prices are blended with contract levels, and how quickly assumptions are refreshed after a price swing.
The main gap comes from how value is built from volume, where Mordor Intelligence ties pricing to regional grade mix and validates implied consumption against capacity, utilization, and net trade, instead of applying a single global average price across all end uses.
Benchmark comparison
| Source | Market Size | Gaps in Research Methodology |
|---|---|---|
| Mordor Intelligence | USD 7.71 B (2026) | |
| Global Consultancy A | USD 7.74 B (2026) | Often uses a global level price and a broad volume series, which can understate regional price dispersion when grade mix and contract structures differ by geography. |
| Industry Publisher B | USD 6.87 B (2025) | Uses an earlier base year and may keep price and demand assumptions anchored to prior-year averages, which can miss step changes from outages, trade re-routing, or feedstock-led price resets. |
The table shows that the spread is largely explained by the year chosen and by how regional pricing and grade mix are handled in the value conversion. With clear volume drivers and practical cross-checks, the estimate stays traceable to observable supply-demand signals and can be repeated when new capacity and trade data are released.


Key Questions Answered in the Report
What is the current value of the acetone market?
The acetone market is valued at USD 7.71 billion in 2026 and is projected to reach USD 10.6 billion by 2031.
Which application segment is growing fastest?
Methyl methacrylate applications lead growth, registering a 7.12% CAGR to 2031 due to electric vehicle lightweighting needs.
Why is Asia Pacific dominant in acetone demand?
Asia Pacific holds 42.18% of global volume because of China’s large phenol–acetone base and rapid industrial expansion in Southeast Asia.
How are bio-fermentation routes impacting supply?
Bio-acetone from waste glycerol and syngas is growing at 7.92% CAGR, offering carbon-negative profiles and reducing reliance on cumene.
Which grade of acetone sees the highest premium?
Pharmaceutical grade commands premium pricing and is expanding at 7.45% CAGR due to strict purity requirements in API manufacturing.
Page last updated on:


 Your data is secure and never sold or shared.


