Acrylonitrile Market Size and Share
Market Overview
| Study Period | 2021 - 2031 |
|---|---|
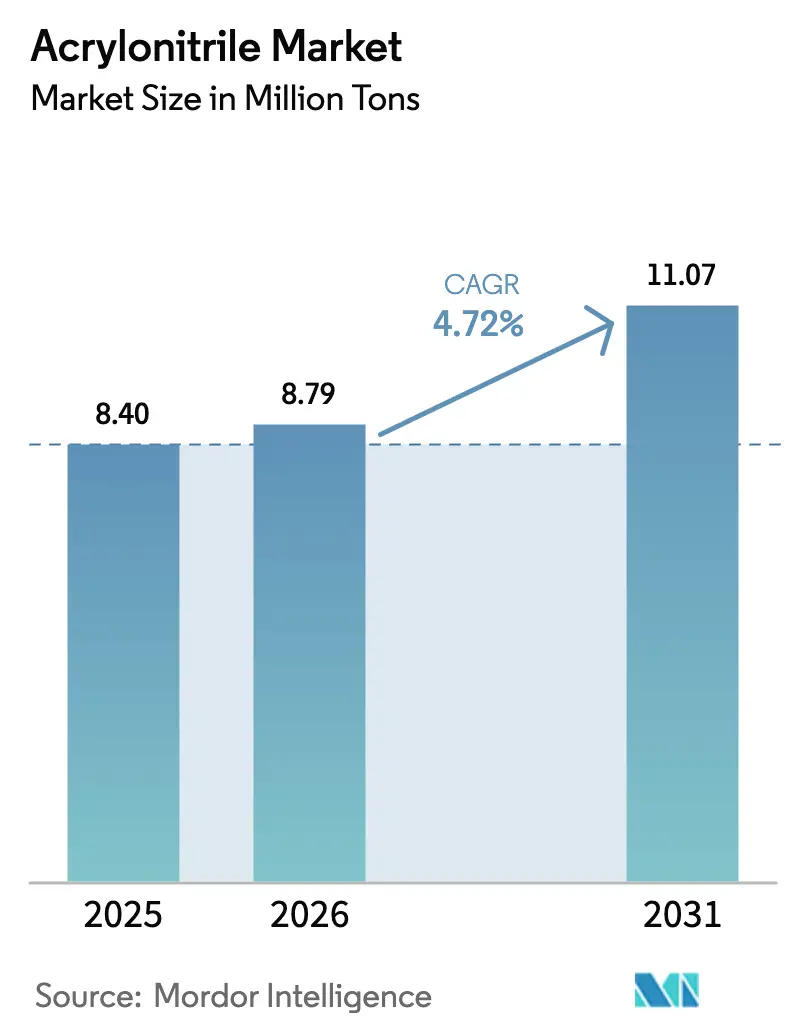
| Market Volume (2026) | 8.79 Million tons |
| Market Volume (2031) | 11.07 Million tons |
| Growth Rate (2026 - 2031) | 4.72% CAGR |
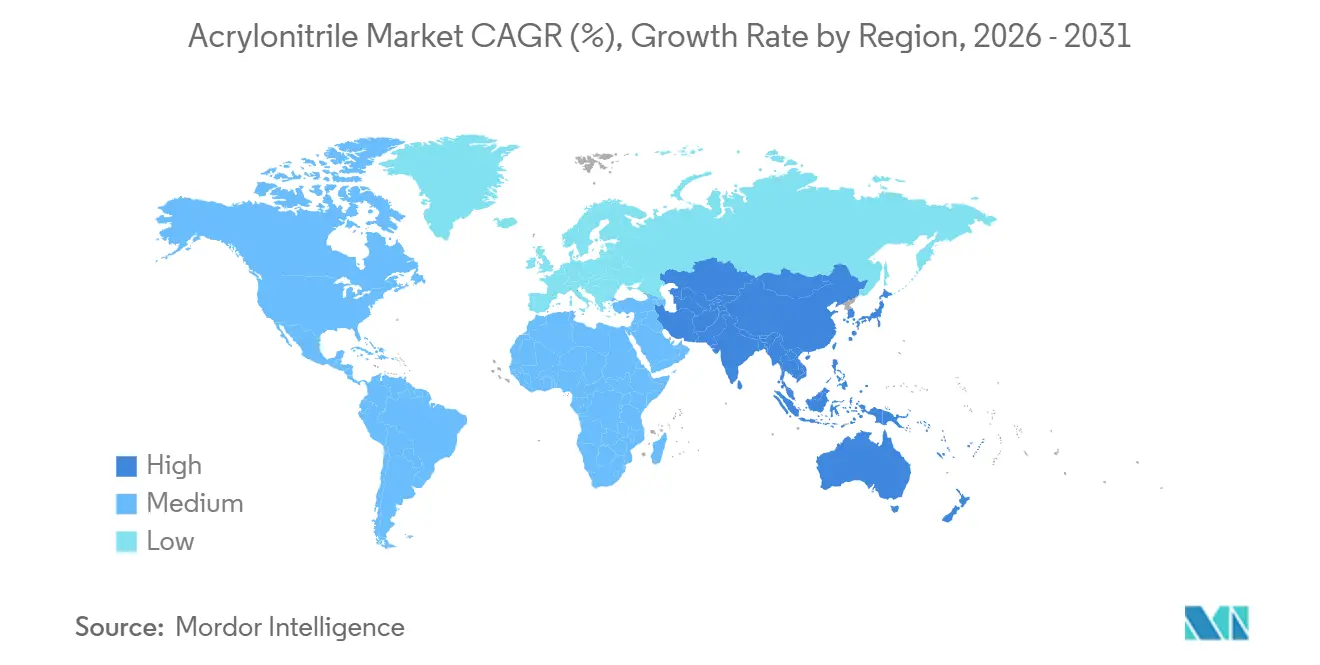
| Fastest Growing Market | Asia Pacific |
| Largest Market | Asia Pacific |
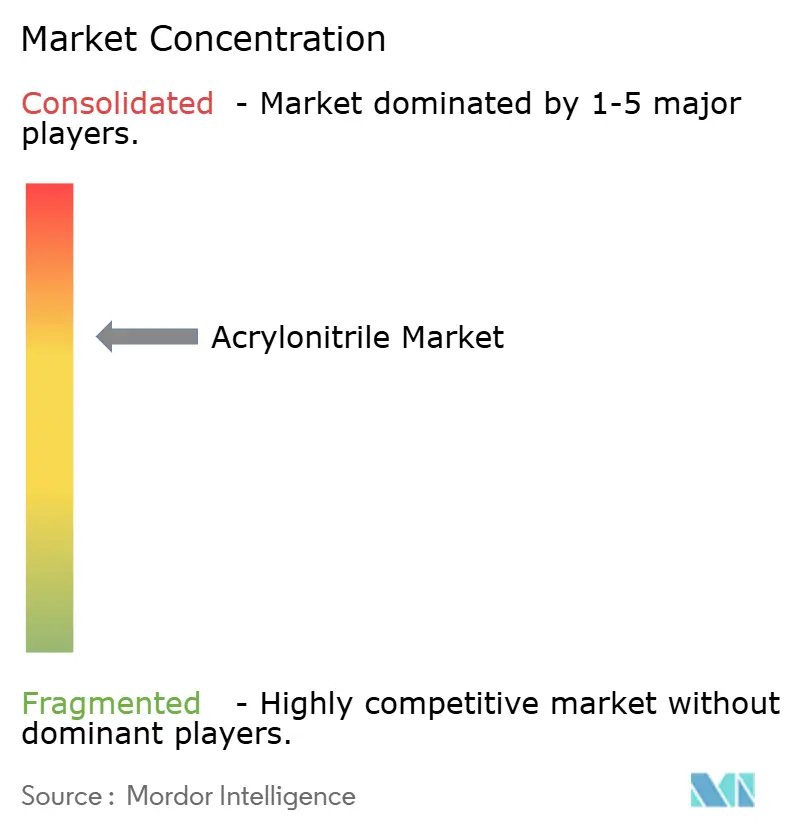
| Market Concentration | Medium |
Major Players *Disclaimer: Major Players sorted in no particular order Image © Mordor Intelligence. Reuse requires attribution under CC BY 4.0. | |
Acrylonitrile Market Analysis by Mordor Intelligence
The Acrylonitrile Market size was valued at 8.40 Million tons in 2025 and is estimated to grow from 8.79 Million tons in 2026 to reach 11.07 Million tons by 2031, at a CAGR of 4.72% during the forecast period (2026-2031). Robust vehicle-lightweighting programs, rapid 5G infrastructure rollouts, and a pivot toward bio-based intermediates are expanding the acrylonitrile market, even as propylene feedstock swings and tighter European toxicity thresholds raise cost-control hurdles. Ammoxidation technology’s cost leadership positions it as the process of choice for most capacity additions, while renewable routes gain interest from automakers and electronics brands that have publicly stated Scope 3 decarbonization targets. Asia-Pacific remains the anchor for new investments because Chinese and Indian producers enjoy proximity to downstream ABS, SAN, and acrylic-fiber converters as well as regional demand for high-temperature nitrile elastomers. Competitive differentiation during 2026–2031 will center on vertical feedstock integration, catalyst efficiency, and the ability to supply certified “low-carbon” grades that command premiums in automotive and electronics supply chains.
Key Report Takeaways
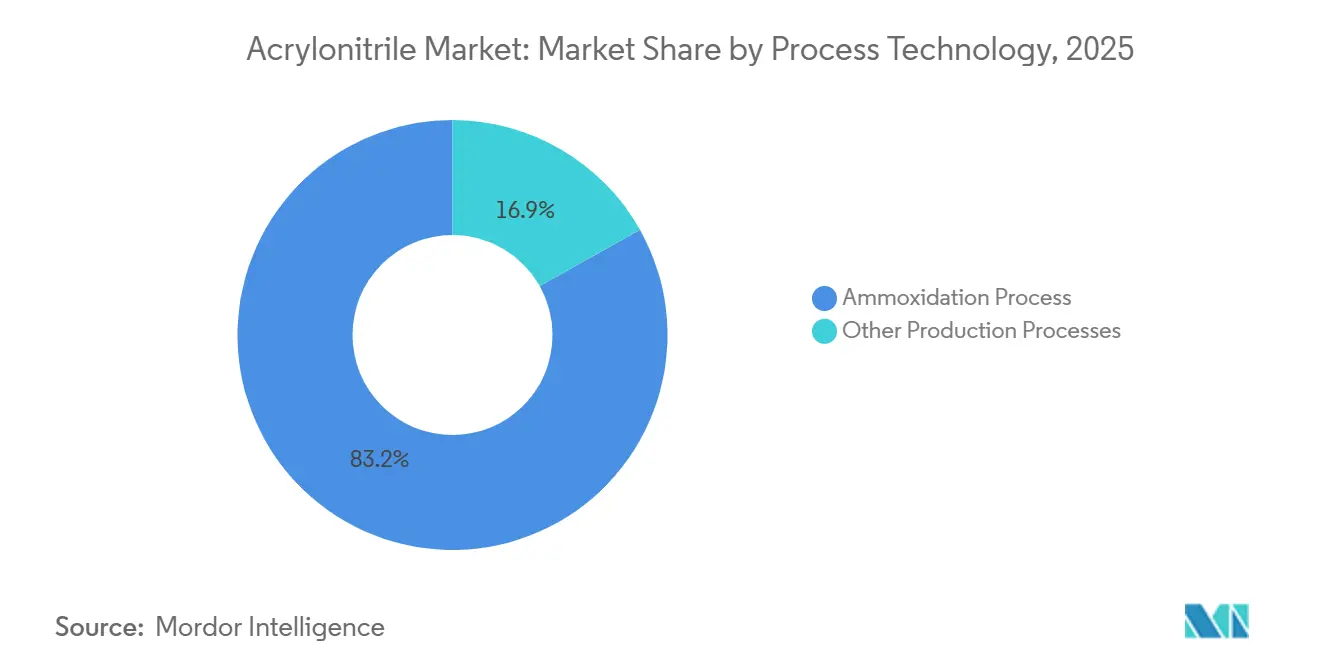
- By process technology, ammoxidation held 83.15% of the acrylonitrile market share in 2025, and is also expected to post the fastest 5.12% CAGR through 2031.
- By application, ABS and SAN led with 37.06% share of the acrylonitrile market in 2025, and are projected to expand at a 5.48% CAGR through 2031.
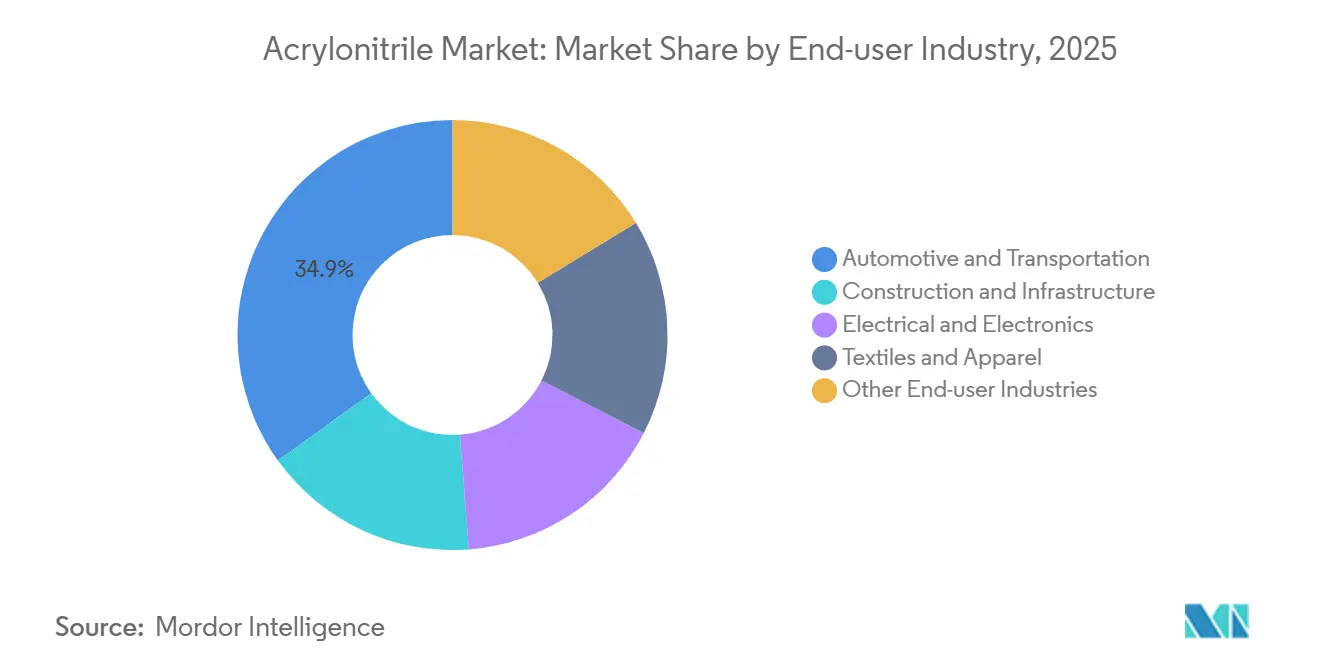
- By end-use industry, automotive and transportation accounted for 34.93% share of the acrylonitrile market size in 2025; electrical and electronics is advancing at a 5.85% CAGR between 2026 and 2031.
- By geography, Asia-Pacific commanded 69.81% of the acrylonitrile market share in 2025 and is forecast to grow at a 5.53% CAGR through 2031.
Note: Market size and forecast figures in this report are generated using Mordor Intelligence’s proprietary estimation framework, updated with the latest available data and insights as of January 2026.
Global Acrylonitrile Market Trends and Insights
Driver Impact Analysis*
| Driver | (~) % Impact on CAGR Forecast | Geographic Relevance | Impact Timeline |
|---|---|---|---|
| Rising ABS demand in automotive and construction | +1.50% | Global, concentrated in Asia-Pacific and North America | Short term (≤ 2 years) |
| Growing acrylic-fiber consumption in textiles | +0.40% | Asia-Pacific core, particularly China and India | Medium term (2-4 years) |
| Expansion of acrylamide for industrial water treatment | +0.30% | Global, emerging markets in APAC and MEA | Medium term (2-4 years) |
| EU bio-chemical incentives accelerating renewable ACN pilots | +0.80% | Europe, spill-over to North America | Medium term (2-4 years) |
| Surge in electronics-grade SAN for 5G hardware casings | +1.20% | Asia-Pacific core, North America | Short term (≤ 2 years) |
| Emerging sodium-ion battery precursor demand | +0.50% | China, early pilots in India | Long term (≥ 4 years) |
| Source: Mordor Intelligence | |||
EU Bio-Chemical Incentives Accelerating Renewable ACN Pilots
The European Commission’s Chemical Industry Action Plan, published in July 2025, sets explicit funding priorities for renewable pathways in high-volume intermediates. OCI now ships bio-ammonia to AnQore’s Econitrile line, enabling a documented ~60% lifecycle-emissions cut compared with conventional ammoxidation[1]AnQore, “Econitrile: Renewable Acrylonitrile for a Low-Carbon Future,” anqore.com. NREL researchers further validated a 98% conversion yield from 3-hydroxypropionic acid, a milestone that narrows the cost gap between fossil and renewable routes. Automotive OEMs that publish Scope 3 dashboards are beginning to specify renewable acrylonitrile in ABS compounds, a shift that could boost premium-grade demand once bio-ammonia availability scales beyond the current sub-500,000 t/y ceiling. Implementation speed is now constrained by green-hydrogen project timing, but medium-term momentum remains favorable as EU incentive structures reward low-carbon intermediates.
Surge in Electronics-Grade SAN for 5G Hardware Casings
Network-equipment manufacturers require housings that combine low dielectric loss, flame retardancy, and UV stability. Electronics-grade SAN, formulated with 28–32% acrylonitrile, meets these criteria and is displacing polycarbonate blends in outdoor 5G radio units supplied by Ericsson and Huawei[2]Ericsson, “5G Radio Unit Material Specifications,” ericsson.com. The higher monomer content directly lifts acrylonitrile uptake by roughly 15-20% per unit compared with general-purpose SAN grades. Regional supply chains gain redundancy because integrated players in South Korea and Japan can tailor recipes to meet UL 94 V-0 without post-compounding additives. Product life-cycle analyses show that SAN casings outlast polyolefin alternatives in demanding outdoor conditions, thereby lowering replacement costs for telecom operators. As base-station density rises, the associated pull-through effect on acrylonitrile market volumes will be most pronounced in Asia-Pacific’s high-population corridors.
Emerging Sodium-Ion Battery Precursor Demand
Sodium-ion chemistries are being commercially piloted in grid-storage and entry-level EV packs, with CATL targeting initial series production in 2026. Polyacrylonitrile-derived carbon nanofibers function as high-surface-area anode scaffolds capable of delivering 293 mAh/g, approaching the capacity of hard-carbon benchmarks while offering superior rate capability. Each gigawatt-hour of sodium-ion capacity could consume 200–300 t of PAN precursor, translating into 500–900 t of acrylonitrile feedstock after conversion losses. Although global impact remains modest through 2028, a 10% sodium-ion share of worldwide battery output by 2031 would equate to incremental demand exceeding 100,000 t/y, similar to the entire nitrile-butadiene rubber segment. Early-stage offtake agreements between Chinese fiber spinners and battery cell makers signal an emerging demand pool that specialty-grade producers aim to secure.
Rising ABS Demand in Automotive and Construction
Global ABS consumption for vehicle applications reached 5.7 million t in 2025. Automakers use ABS compounds in battery housings and instrument panels because the material maintains impact strength after multiple recycling loops, a property that polypropylene alloys cannot match without expensive compatibilizers. Tesla’s Model Y, Ford’s F-150 Lightning, and BYD’s Han sedan now specify recycled-content ABS in underbody shields, illustrating circular-economy alignment. Construction demand also rises where fire-safe building codes require flame-retardant thermoplastics in plumbing and electrical conduit. BASF’s bio-sourced Terluran ECO, containing 30% renewable content today and aiming for 50% by 2027, illustrates how sustainability credentials reinforce material selection for LEED-oriented developers. These structural drivers underpin the strongest volume tailwinds across core acrylonitrile derivatives.
Restraint Impact Analysis*
| Restraint | (~) % Impact on CAGR Forecast | Geographic Relevance | Impact Timeline |
|---|---|---|---|
| Stringent toxicity regulations and REACH compliance costs | -0.70% | Europe, selective impact in North America | Short term (≤ 2 years) |
| Propylene price volatility linked to steam-cracker outages | -1.00% | Global, acute in North America and Europe | Short term (≤ 2 years) |
| Engineering plastics substitution by polyolefin alloys | -0.60% | North America and Europe, selective in Asia-Pacific | Medium term (2-4 years) |
| Limited skilled workforce for high-pressure ammoxidation units | -0.40% | Global, particularly acute in Asia-Pacific expansion zones | Medium term (2-4 years) |
| Source: Mordor Intelligence | |||
Propylene Price Volatility Linked to Steam-Cracker Outages
Propylene feedstock accounts for roughly 65% of cash costs in standard ammoxidation. Unplanned cracker shutdowns in the US Gulf Coast during 2025 cut regional on-purpose propylene output and lifted spot prices above quarterly contract floors. European refiners simultaneously leaned on U.S. naphtha imports to replace embargoed Russian feed, tightening trans-Atlantic propylene balances and creating abrupt price spikes that smaller acrylonitrile producers struggle to hedge. These dynamics weaken the purchasing power of downstream ABS and acrylic-fiber converters, which are forced to carry higher inventories or accept exposure to floating indices that erode profitability during demand troughs. Until steam-cracker reliability improves and regional de-bottlenecking projects reach mechanical completion in late 2027, the acrylonitrile market will face periodic cost-push pressure.
Engineering Plastics Substitution by Polyolefin Alloys
Automotive interior suppliers now trial polypropylene alloys reinforced with elastomeric modifiers or talc fillers in door panels, center consoles, and HVAC housings. These alloys deliver acceptable performance up to about 100°C at a raw-material cost advantage that can exceed USD 400 per t compared with standard ABS. Technology guides from global injection-molders already list acrylonitrile-styrene-acrylate (ASA) and talc-filled PP as equivalent drop-ins for several ABS-based components. Recyclers also report that ABS can tolerate up to 4 wt% polypropylene contamination before impact properties decay, effectively lowering the hurdle for mixed-stream re-use and, in turn, de-risking substitution. If polyolefin alloys capture 5% of automotive thermoplastic volumes by 2030, overall acrylonitrile demand growth could lose up to 0.5 percentage points annually.
*Our forecasts treat driver/restraint impacts as directional, not additive. The impact forecasts reflect baseline growth, mix effects, and variable interactions.
Segment Analysis
By Process Technology: Ammoxidation Maintains Cost Leadership Amid Renewable Pilots
Ammoxidation accounted for 83.15% of the acrylonitrile market share in 2025, and continued brownfield upgrades place the pathway on a steady 5.12% CAGR through 2031. The legacy Sohio process converts propylene and ammonia over bismuth-molybdate catalysts at single-pass yields near 85%, a benchmark that newer propane or bio-routes have yet to match. INEOS completed an energy-efficiency revamp at its Seal Sands unit in 2024, confirming that incremental heat-integration and catalyst-cooling tweaks can lift site-specific yields by up to 3%. Renewable pilots, led by AnQore’s Econitrile line using OCI-supplied bio-ammonia, achieve roughly 60% lower lifecycle emissions, an attribute that automotive OEMs can translate into Scope 3 reductions. That said, bio-ammonia availability remains under 500,000 t/y, and propane ammoxidation still requires higher capex owing to oxygenate-resistant metallurgy. As a result, the conventional process will dominate absolute volume additions until bio-feedstock logistics improve.
Parallel advances in forced dynamic operation, in which reactor temperatures cycle to mitigate catalyst sintering, show laboratory yield bumps but need field validation at scale. Catalyst suppliers are simultaneously pursuing molybdenum-tellurium formulations that boost selectivity yet introduce volatility concerns when operating above 430°C. Integrated producers with captive propylene are best positioned to fund these innovations, reinforcing the structure where top-tier players command the lion’s share of incremental supply.


By Application: ABS and SAN Resins Accelerate, Acrylic Fiber Stabilizes
ABS and SAN resins represented 37.06% of the acrylonitrile market size in 2025 and are forecast to grow at a 5.48% CAGR through 2031 as electric-vehicle battery casings, 5G radio housings, and thin-wall consumer electronics escalate demand. The higher acrylonitrile content in electronics-grade SAN enlarges monomer pull-through per unit, while recycled-content ABS variants such as Trinseo’s Pulse ECO gain traction with OEMs publishing carbon dashboards. Acrylic fiber, once the dominant outlet, now confronts polyester competition in mass-market apparel; however, niche sweater yarns and technical textiles preserve a baseline demand that stabilizes global acrylic fiber volumes near 5 million t/y. Water-treatment acrylamide shows a positive trajectory because emerging-market industrial sites face tighter discharge limits; enzyme-catalyzed routes cut production energy and enable ultra-low-monomer grades that utilities prefer. Nitrile-butadiene rubber maintains a 42-46% acrylonitrile content for oil-resistant seals and is posting above-trend growth where high-temperature elastomers are needed in geothermal and hydrogen pipeline projects.
Sustainability credentials increasingly sway buyer decisions. BASF’s Terluran ECO, containing 30% bio-feedstock, already meets LEED pilot credits for reduced embodied carbon, and the plan to raise bio-content to 50% by 2027 would embed further competitive separation. In consumer electronics, the switch to halogen-free flame-retardant SAN grades supports corporate commitments to eliminate restricted substances without compromising device weight targets. Across applications, the design community’s growing familiarity with recycled and bio-based formulations is helping lock in premium pricing, thereby underpinning the value proposition of sustainable acrylonitrile derivatives.
By End-Use Industry: Automotive Dominates, Electronics Moves to the Fast Lane
Automotive and transportation captured 34.93% of the acrylonitrile market size in 2025. Battery-electric models rely on ABS housings that remain dimensionally stable across rapid-charge thermal cycles, and leading brands already specify 30–50% recycled content to satisfy internal carbon intensity thresholds. Lightweight underbody shields and interior trims further consolidate ABS penetration because polypropylene alloys require costly compatibilizers to match multi-impact durability. In contrast, the electrical and electronics sector is set to advance at the fastest 5.85% CAGR through 2031 as 5G macro-cell deployments and edge-computing nodes proliferate. SAN’s low dielectric constant underpins its selection for outdoor radio casings, and its UV stability cuts maintenance in harsh climates. Construction uses (plumbing, ducting, and conduit) continue to grow in emerging markets adopting stricter fire-safety codes.
Textile applications face headwinds from polyester substitution, but premium sweater yarns and technical fabrics keep demand relatively stable. Water-treatment polymers gain relevance as industrial discharge rules tighten in India, ASEAN, and Latin America. Oil-and-gas operators specify higher acrylonitrile-content NBR for seals and gaskets able to withstand aggressive fluids in enhanced-oil-recovery sites. The cumulative effect is a gradual tilt toward higher-value, higher-specification outlets that can absorb premium pricing for low-carbon or recycled feedstocks.

Geography Analysis
Asia-Pacific held 69.81% acrylonitrile market share in 2025 and is projected to post a 5.53% CAGR through 2031. China alone added 1.31 million t/y of capacity during 2025, bringing national nameplate capacity above 5.7 million t/y. Major start-ups include Zhejiang Petrochemical’s 660,000 t/y Daishan Plant 2 and PetroChina’s 260,000 t/y Jilin unit, both integrated with downstream ABS, acrylic fiber, and carbon-fiber precincts. India remains structurally short, operating a single 41,000 t/y plant at Hazira, Gujarat; that imbalance, coupled with government Production-Linked Incentives, is spurring proposals for at least 200,000 t/y of new capacity post-2027. Japan and South Korea continue to lead in catalyst design and specialty SAN grades, though domestic demand is flat due to mature automotive and appliance sectors. Regional growth hinges on electric-vehicle penetration, 5G equipment build-out, and expanding textile exports from South Asia.
North America and Europe jointly account for just over one-fifth of global consumption. US Gulf Coast propylene volatility, aggravated by refinery turnarounds, constrained acrylonitrile operating rates in 2025. INEOS maintains strategic flexibility with 450,000 t/y at Green Lake, Texas, and 300,000 t/y in Cologne, Germany, underscoring the importance of vertical feedstock integration. European producers brace for the April 2026 occupational exposure limit of 1.0 mg/m³ under REACH, a compliance cost that could prompt smaller converters to exit or consolidate. The EU Chemical Industry Action Plan simultaneously funnels grants toward renewable acrylonitrile pilots, a dynamic that favors incumbents able to retrofit bio-ammonia inputs without massive capex.
The Middle East, Africa, and South America together are positioned for above-average growth. SABIC’s 420,000 t/y Al-Jubail unit leverages low-cost propane-rich feed and is evaluating downstream carbon-fiber precursor ventures. Turkey’s Petkim serves both European and Middle Eastern customers, although utilization is sensitive to regional political risk. Brazil’s vehicle production rebound supports ABS demand for interior trims, and local packaging converters are shifting toward flame-retardant ABS for appliance housings. Africa’s modest base makes it a focus for water-treatment acrylamide, particularly in mining-intensive economies where stricter discharge laws now apply.

Competitive Landscape
The Acrylonitrile market is moderately concentrated. INEOS, SABIC, Sinopec, and PetroChina exploit captive propylene to smooth margin volatility, while mid-sized specialty players seek niches in bio-based grades or ultra-low-residual acrylamide. Regional fragmentation persists as smaller producers serve captive acrylic-fiber or ABS plants. These companies face steeper compliance and energy costs, which may accelerate consolidation once REACH exposure limits take effect and as European carbon border adjustment mechanisms raise the cost of high-emission imports.
Acrylonitrile Industry Leaders
INEOS
Ascend Performance Materials
PetroChina
China Petrochemical Corporation
Asahi Kasei Corporation
- *Disclaimer: Major Players sorted in no particular order

Recent Industry Developments
- May 2025: Ascend Performance Materials began commercial output of high-purity acrylonitrile at its Chocolate Bayou plant after installing new purification technology.
- June 2024: Trillium Renewable Chemicals selected INEOS Nitriles’ Green Lake site in Texas for Project Falcon, the first demonstration plant converting plant-based glycerol into acrylonitrile.


Research Methodology Framework and Report Scope
Market Definitions and Key Coverage
Our study views the acrylonitrile market as all merchant-grade liquid acrylonitrile obtained mainly through the ammoxidation of propylene and sold for captive or third-party use in acrylic fiber, ABS/SAN resins, nitrile-butadiene rubber, acrylamide, carbon fiber precursors, and allied chemical intermediates.
Scope exclusion: experimental bio-based acrylonitrile volumes that remain at pilot scale through 2025 are not included.
Segmentation Overview
- By Process Technology
- Ammoxidation Process
- Other Production Processes
- By Application
- Acrylic Fiber
- Acrylonitrile Butadiene Styrene (ABS)/Styrene-Acrylonitrile Resin (SAN)
- Acrylamide
- Nitrile-Butadiene Rubber
- Other Applications
- By End-use Industry
- Automotive and Transportation
- Construction and Infrastructure
- Electrical and Electronics
- Textiles and Apparel
- Other End-user Industries (Water and Waste-water Treatment, Packaging and Consumer Goods, etc.)
- By Geography
- Asia-Pacific
- China
- India
- Japan
- South Korea
- Rest of Asia-Pacific
- North America
- United States
- Canada
- Mexico
- Europe
- Germany
- United Kingdom
- France
- Italy
- Russia
- Rest of Europe
- South America
- Brazil
- Argentina
- Rest of South America
- Middle East and Africa
- Saudi Arabia
- South Africa
- Rest of Middle East and Africa
- Asia-Pacific
Detailed Research Methodology and Data Validation
Primary Research
Mordor analysts interviewed North American and Asian acrylonitrile producers, ABS compounders, textile-grade acrylic fiber spinners, and carbon-fiber precursor buyers. Discussions focused on plant utilization, quarterly contract pricing, and emerging propane-based routes, letting us validate secondary indicators, close data gaps, and fine-tune regional demand splits.
Desk Research
We started with public data sets such as UN Comtrade trade codes for HS 292610, the U.S. EPA Toxics Release Inventory, Eurostat PRODCOM, and industry statistics from Plastics Europe and the World Textile Information Network, which map demand in downstream fibers and plastics. Company 10-K filings, investor decks, and press releases were screened through Dow Jones Factiva, while capacity additions were verified via D&B Hoovers plant records. Petrochemical feedstock balances from the International Energy Agency helped us align propylene availability with regional output potential. These references illustrate our wider reading and are not exhaustive.
Market-Sizing & Forecasting
We initiated a top-down reconstruction from national production and trade flows (kilotons), which are then reconciled with selective bottom-up checks such as sampled average selling price multiplied by producer shipment volume and channel feedback on derivative off-take. Key variables in our model include propylene benchmark prices, global ABS resin output, acrylic-fiber mill runs, light-vehicle builds, wastewater polymer demand, and announced carbon-fiber capacity. Forecasts apply a multivariate regression blended with ARIMA smoothing to project each driver, while scenario analysis handles feedstock volatility. Where bottom-up data were incomplete, midpoint imputation anchored to peer plant statements bridged the gap.
Data Validation & Update Cycle
Every draft passes variance and anomaly checks against historical ratios, and senior reviewers sign off only after discrepancies fall within tolerance. We refresh the full data set annually; interim updates trigger when a capacity addition, force majeure, or regulatory shift moves market balance meaningfully. A final cross-check is performed just before delivery so clients receive the latest view.
Why Mordor's Acrylonitrile Baseline Commands Reliability
Published figures often differ because firms mix value and volume units, roll derivatives in or out, or lock forecasts to outdated feedstock scenarios.
Key gap drivers include: some providers convert volumes to USD using spot prices without regional discounts, others fold carbon-fiber precursor value into the base chemical total, and a few retain 2023 as their base year while our study moves to a 2024 baseline and updates yearly.
Benchmark comparison
| Market Size | Anonymized source | Primary gap driver |
|---|---|---|
| 8.79 million tons (2025) | Mordor Intelligence | |
| USD 12.31 billion (2025) | Global Consultancy A | reports revenue not volume and bundles downstream ABS compounding values |
| USD 12.13 billion (2025) | Regional Consultancy B | base year 2023 and uses average spot price rather than contract benchmarks |
| USD 14.97 billion (2025) | Industry Association C | includes carbon-fiber intermediates plus bio-based pilot output and refreshes every two years |
Taken together, the comparison shows that our volume-led, annually refreshed approach, supported by clearly traceable variables and first-hand validation, delivers a balanced baseline that decision-makers can reproduce and trust.


Key Questions Answered in the Report
What volume growth is expected for the acrylonitrile market by 2031?
The acrylonitrile market is projected to expand from 8.79 million tons in 2026 to 11.07 million tons by 2031, reflecting a 4.72% CAGR.
Which technology will drive most acrylonitrile capacity additions?
Conventional propylene ammoxidation remains the volume workhorse, retaining 83.15% share in 2025 and advancing at 5.12% CAGR through 2031 thanks to its proven cost leadership.
Why is Asia-Pacific the dominant region for acrylonitrile?
The region combines new capacity, over 1.3 million t/y added in China during 2025, with fast-growing downstream ABS, SAN and fiber demand, yielding a 69.81% share and a projected 5.53% CAGR to 2031.
How are sustainability trends influencing acrylonitrile derivatives?
OEM decarbonization targets are lifting demand for bio-based acrylonitrile and recycled-content ABS and SAN resins, enabling premium pricing and differentiated supply agreements.
What is the biggest short-term risk to acrylonitrile producers?
Volatile propylene prices linked to steam-cracker outages can erode margins, especially for non-integrated producers in North America and Europe.
Page last updated on:


