Ethyl Acetate Market Size and Share
Market Overview
| Study Period | 2021 - 2031 |
|---|---|
| Market Volume (2026) | 4.16 Million tons |
| Market Volume (2031) | 5.14 Million tons |
| Growth Rate (2026 - 2031) | 4.32% CAGR |
| Fastest Growing Market | North America |
| Largest Market | Asia-Pacific |
| Market Concentration | Medium |
Major Players *Disclaimer: Major Players sorted in no particular order Image © Mordor Intelligence. Reuse requires attribution under CC BY 4.0. | |
Ethyl Acetate Market Analysis by Mordor Intelligence
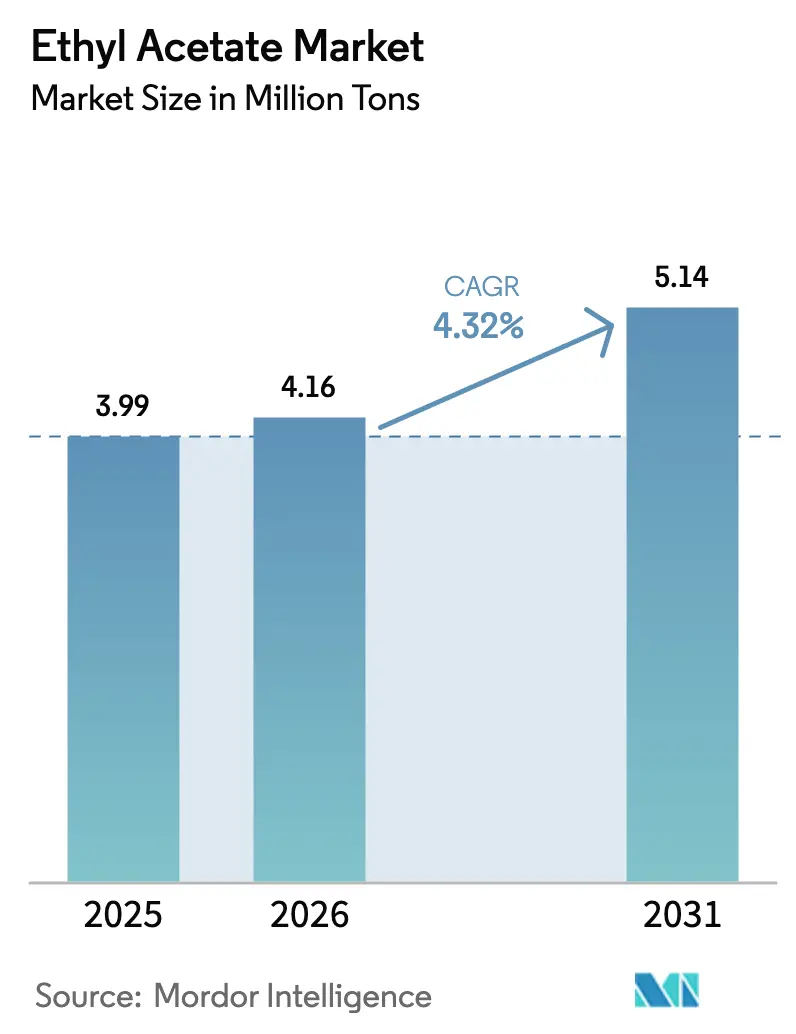
The Ethyl Acetate Market size is projected to expand from 3.99 million tons in 2025 and 4.16 million tons in 2026 to 5.14 million tons by 2031, registering a CAGR of 4.32% between 2026 to 2031. This expansion reflects rising pharmaceutical output, a rebound in automotive OEM coatings, and the substitution of high-VOC solvents under tightening European rules. Asia-Pacific commands more than 70% of current volume, underpinned by China’s large production base and India’s surging generic-drug exports, while North America posts the fastest regional CAGR at nearly 5.91% through 2031 on the back of reshoring and bio-based capacity additions. Petro-based supply still accounts for about 90.23% of output, yet bio-based variants are growing at more than 6.37% a year as net-zero commitments by producers such as Celanese, SEKAB, and Godavari Biorefineries translate into ISCC PLUS-certified volumes. Paints and coatings remain the single-largest application, absorbing just over half of global demand, but adhesives and sealants show the fastest application growth as flexible-packaging lamination rises with e-commerce logistics.
Key Report Takeaways
- By source, petro-based retained 90.23% of ethyl acetate market share in 2025, whereas bio-based is projected to advance at a 6.37% CAGR to 2031.
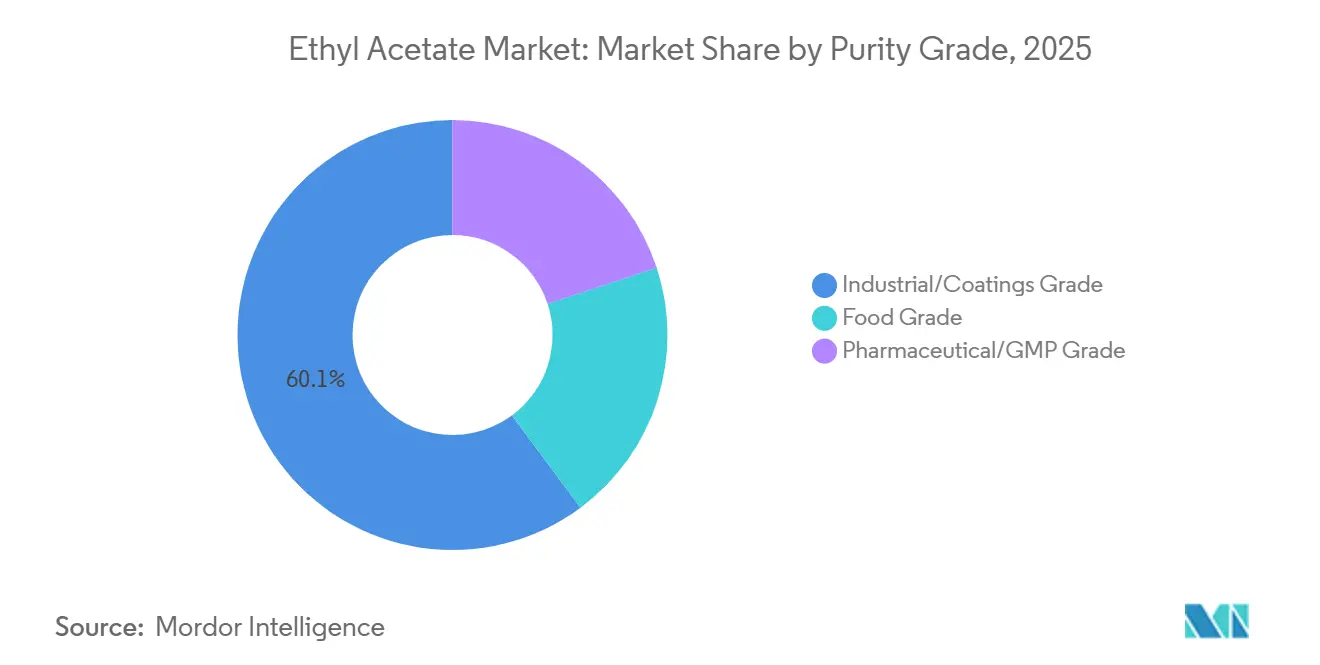
- By purity, industrial/coatings-grade held a 60.14% share of the ethyl acetate market size in 2025, while pharmaceutical/GMP-grade is on track to grow at a 5.36% CAGR through 2031.
- By application, paints and coatings led with 53.24% of ethyl acetate market share in 2025; adhesives and sealants are poised to expand at a 5.29% CAGR to 2031.
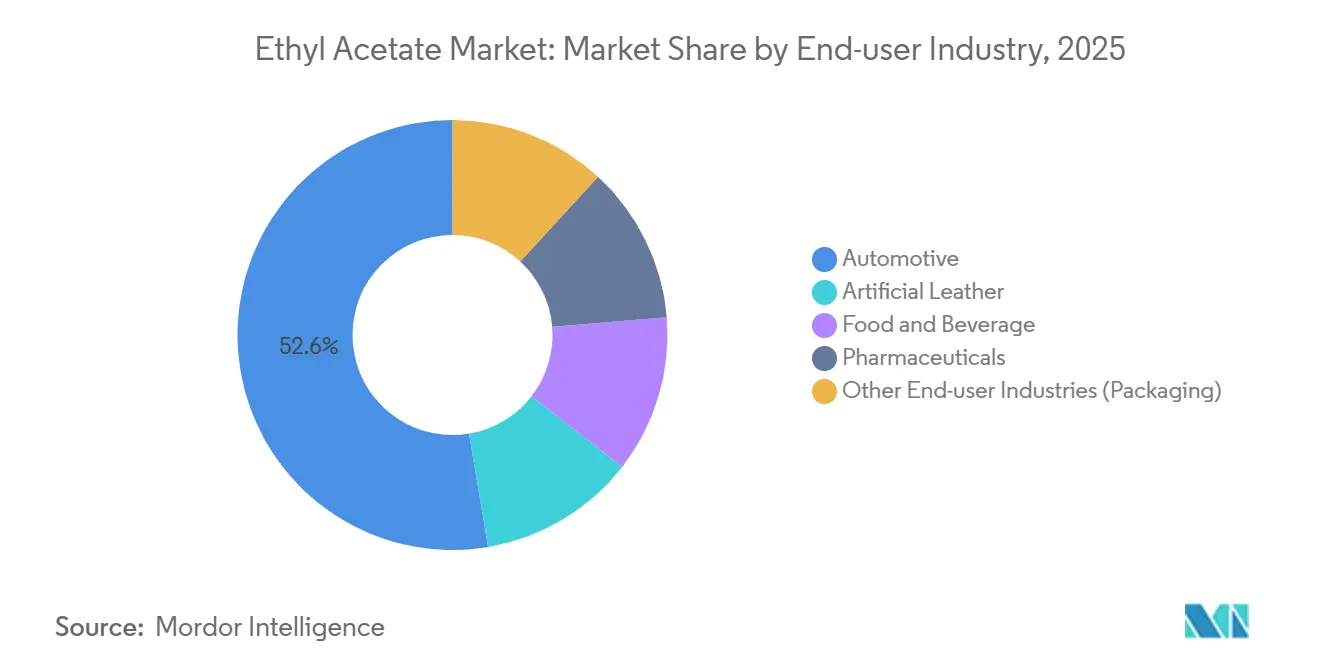
- By end-user industry, automotive accounted for 52.65% of the ethyl acetate market size in 2025, while food and beverage is forecast to progress at a 5.12% CAGR to 2031.
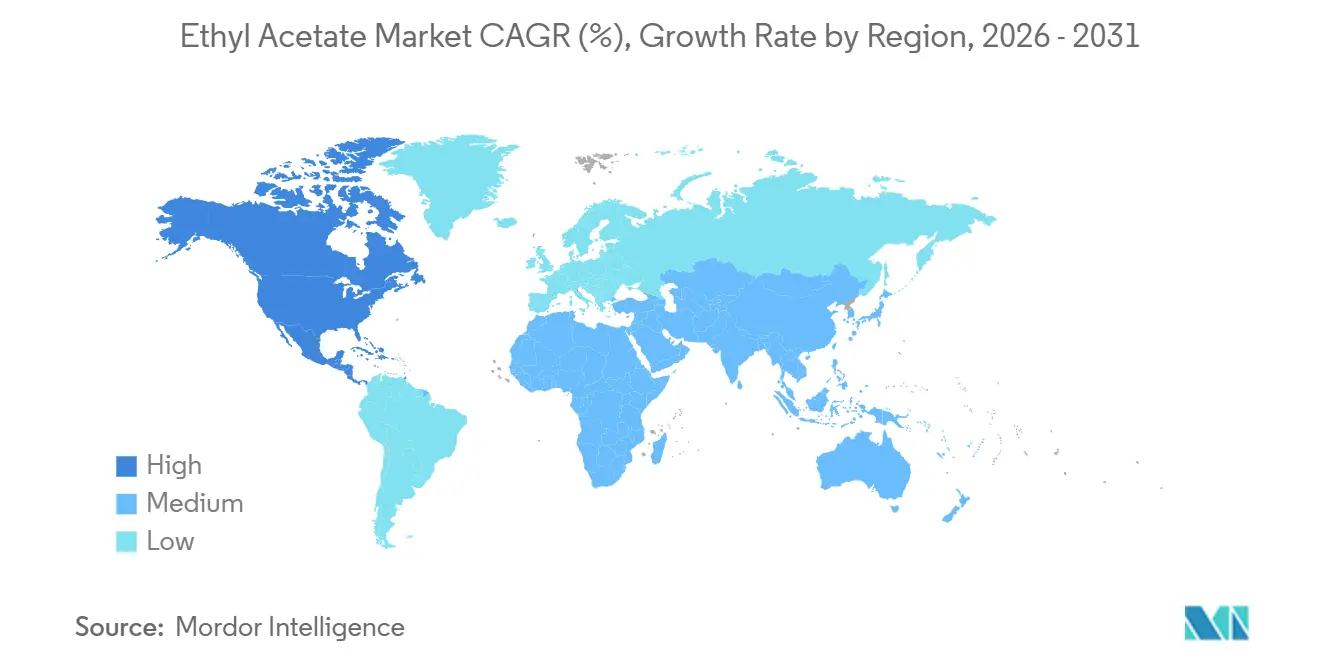
- By geography, Asia-Pacific commanded 73.15% of ethyl acetate market share in 2025; North America is expected to register the highest regional CAGR of 5.91% through 2031.
Note: Market size and forecast figures in this report are generated using Mordor Intelligence’s proprietary estimation framework, updated with the latest available data and insights as of January 2026.
Global Ethyl Acetate Market Trends and Insights
Drivers Impact Analysis*
| Driver | (~) % Impact on CAGR Forecast | Geographic Relevance | Impact Timeline |
|---|---|---|---|
| Rising Demand in Solvent Applications | +1.0% | Global, with concentration in Asia-Pacific and North America | Medium term (2-4 years) |
| Growth of the Pharmaceutical Sector | +0.8% | Global, led by India, China, and North America | Long term (≥ 4 years) |
| EU Shift to Low-VOC Solvents Boosting Offset-Printing Inks | +0.5% | Europe (Germany, UK, France, Italy, NORDIC), spillover to North America | Short term (≤ 2 years) |
| Increasing Demand for Personal-Care Products | +0.4% | Global, with strongest growth in Asia-Pacific and North America | Medium term (2-4 years) |
| Net-Zero Roadmaps Accelerating Bio-Based Ethyl-Acetate Purchases | +0.5% | North America, Europe, selective APAC adopters (Japan, South Korea) | Long term (≥ 4 years) |
| Source: Mordor Intelligence | |||


Rising Demand in Solvent Applications
Industrial solvent usage sets the baseline for ethyl acetate market growth as paints, coatings, adhesives, and general process applications consume large volumes. Architectural-coating recovery in North America and infrastructure spending in India and Southeast Asia keep bulk demand resilient. Eastman’s Chemical Intermediates division reported a 15% sequential revenue jump in Q3 2024, citing higher acetyls availability after maintenance work and firmer selling prices, a signal that integrated producers are tightening supply–demand balances. E-commerce packaging expansion amplifies consumption of polyurethane and acrylic laminating adhesives, where ethyl acetate provides the primary solvent in multilayer films. Automotive refinish volumes are normalizing as vehicle fleets age, supporting additional solvent offtake in both North America and Europe. The progressive shift away from methyl ethyl ketone to ethyl acetate in certain coating formulations, driven by lower toxicity and regulatory acceptance, is adding incremental demand.
Growth of the Pharmaceutical Sector
Pharmaceutical manufacturing absorbs ethyl acetate as an extraction medium, reaction solvent, and chromatography eluent. GMP-grade specifications mandate single-site production, batch quarantine, and validated impurity profiling, which raise entry barriers and support premium pricing. India’s generic-drug exports surpassed USD 50 billion in 2024, boosting demand for pharmaceutical-grade ethyl acetate in antibiotic purification, steroid extraction, and tablet-coating processes. FDA regulation 21 CFR 182.60 lists the solvent as GRAS, validating its use in excipients and taste-masking formulations under cGMP regimes[1]U.S. Food & Drug Administration, “21 CFR 182.60—Ethyl Acetate,” fda.gov . ICH Q3C residual-solvent testing keeps removal thresholds tight, sustaining sales of high-purity grades. Celanese’s vertically integrated Kingsport, Tennessee complex supplies pharmaceutical customers with traceable, cGMP-compliant solvent, illustrating how feedstock control can secure a durable competitive edge.
EU Shift to Low-VOC Solvents Boosting Offset-Printing Inks
Directive 2004/42/EC caps VOC emissions from decorative coatings, while Directive 1999/13/EC restricts wider industrial solvent release. These measures are prompting European ink formulators to phase out toluene and xylene in favor of ethyl acetate, which satisfies performance requirements without breaching VOC ceilings. Offset-printing inks for flexible packaging now incorporate 25–30% ethyl acetate, up from roughly 20% two years ago, to maintain drying speed on high-throughput presses. Germany and France, which host extensive packaging and commercial-printing clusters, lead this transition. Directive 2009/32/EC further clears ethyl acetate for food-use extraction, allowing its deployment in food-contact packaging inks. Post-Brexit guidance published in April 2025 preserved the solvent’s approved status in the United Kingdom, locking in market continuity.
Increasing Demand for Personal-Care Products
Personal-care segments such as nail polish removers, fragrances, and hair-spray formulations rely on ethyl acetate for its pleasant odor, rapid evaporation, and favorable safety profile. Rising disposable income in Asia-Pacific is encouraging consumption of higher-end cosmetics that specify low-odor solvent systems. North American brands are reformulating away from denatured alcohol blends toward ester solvents to deliver a milder user experience, a shift that also benefits ethyl acetate volumes. Ingredient transparency campaigns in Europe underline the solvent’s relatively benign toxicity record, elevating its attractiveness over more restrictive alternatives. The premium cosmetic segment, which emphasizes clean-label messaging, views bio-based ethyl acetate as additive to brand equity, creating an intersection with sustainability drivers.
Restraints Impact Analysis*
| Restraint | (~) % Impact on CAGR Forecast | Geographic Relevance | Impact Timeline |
|---|---|---|---|
| Conversion To Water-Borne Adhesives in Europe | -0.5% | Europe (Germany, France, Italy, UK, NORDIC), spillover to North America | Medium term (2-4 years) |
| Volatile Acetic-Acid Feedstock Prices in North America | -0.4% | North America, secondary effects in Latin America | Medium term (2-4 years) |
| Global Oversupply from Recent Chinese Capacity Additions | -0.9% | Global, with acute impact in Asia-Pacific and export-dependent Middle East | Short term (≤ 2 years) |
| Source: Mordor Intelligence | |||
Conversion to Water-Borne Adhesives in Europe
European packaging converters have steadily introduced water-borne systems to comply with stringent VOC ceilings. Germany and France have rolled out corporate sustainability frameworks that rank solvent reduction as a top priority, persuading adhesive formulators to trial water-borne or high-solids chemistries. Although solvent-borne lamination still dominates flexible packaging, especially where high bond strength and fast cure speed are critical, a gradual migration to water-borne technologies is under way in end-use cases such as label-stock assembly and certain carton-sealing lines. The learning curve involves adapting to longer drying times and higher energy consumption for water removal, which presently caps penetration rates. North American converters are monitoring European developments and could adopt similar specifications once regulatory pressure converges.
Volatile Acetic-Acid Feedstock Prices in North America
Acetic acid represents roughly half of ethyl acetate production cost in Fischer-esterification routes, exposing non-integrated producers to margin swings. Contract values rose early in 2025 as Gulf Coast suppliers implemented price increases, citing higher downstream demand and impending methanol cost inflation. While integrated players such as Celanese and Eastman absorb feedstock shocks within group portfolios, merchant ethyl acetate converters must pass through increases or accept thinner spreads. U.S. ethane output climbed to a record 2.8 million barrels per day in 2024, maintaining low ethane values that benefit integrated producers but distort competitive parity for standalone acetic acid buyers[2]U.S. Energy Information Administration, “U.S. Ethane and Acetyls Market Data,” eia.gov . Potential trade tariffs on Chinese chemical imports could amplify volatility, as both acetic acid and finished ethyl acetate flows would reroute under new cost structures.
*Our forecasts treat driver/restraint impacts as directional, not additive. The impact forecasts reflect baseline growth, mix effects, and variable interactions.
Segment Analysis
By Source: Bio-Based Variants Gain Traction Despite Petro Dominance
Petro-based maintained 90.23% of worldwide output in 2025 because entrenched Fischer-esterification assets enjoy scale and feedstock cost advantages. Nonetheless, bio-based is expanding at a 6.37% CAGR through 2031 as brand-owner net-zero mandates translate into purchase orders for ISCC PLUS and USDA-certified solvent grades. SEKAB’s newly certified bio-acetic acid stream gives European coatings customers mass-balance documentation, while Viridis Chemical services North American buyers with 100% bio-based product. Godavari Biorefineries trimmed steam use to 2.5 tons per ton of solvent and upgraded sustainability credentials, which sharpens the cost curve for renewable supply.
Celanese launched its ECO-B line with up to 43% bio-content, expanding options for partial drop-in replacement in established petro-based chains. Although Asia-Pacific retains a price-centric procurement culture that favors petro-routes, European and North American policies are nurturing a differentiated niche that could account for double-digit percentage shares by 2031 if certification premiums stay inside historical bounds.


By Purity Grade: Pharmaceutical GMP Standards Drive Premium Segment
Industrial/coatings grade supplied 60.14% of global demand in 2025 and remains the workhorse for high-volume coatings, inks, and adhesives. The ethyl acetate market size attributable to pharmaceutical/GMP grade is however enlarging at a 5.36% clip thanks to API manufacturing growth in India and China. USP and Ph.Eur. assays above 99% purity, strict impurity limits, and batch traceability justify price uplifts that exceed 20% over industrial grades. Eastman’s Longview operations illustrate best-practice with validated test methods, residual-solvent assays, and ISO-compliant documentation, all prerequisites for regulatory inspections.
Food-grade solvent fills a smaller but strategically important niche, covering coffee and tea decaffeination under FDA 21 CFR 173.228, with GRAS status reinforcing acceptability for flavor extraction. European rules under Directive 2009/32/EC echo this clearance. Future growth in food-grade demand rides on rising decaf coffee consumption in Asia-Pacific and the scaling of flavor extraction for plant-based proteins where solvent efficiency and recoverability matter.

By Application: Adhesives and Sealants Outpace Mature Coatings
Paints and coatings captured 53.24% of 2025 volume, benefiting from recovering automotive OEM production and infrastructure-led architectural demand in emerging economies. Yet adhesives and sealants are expanding faster at 5.29% CAGR as flexible-packaging lamination grows alongside booming e-commerce corrugated usage. In gravure and flexographic presses, ethyl acetate’s moderate evaporation rate balances high-speed printing with substrate versatility, reinforcing its position in solvent-borne ink recipes.
The transition to water-borne adhesive chemistries in Europe tempers long-run solvent growth, but high-performance multilayer films still rely on solvent-based polyurethane systems where barrier integrity and heat resistance remain non-negotiable. Other rising outlets include process solvents in pharmaceutical synthesis, pigment dispersion for advanced dyes, and personal-care products such as nail-polish removers that capitalize on the solvent’s low toxicity and pleasant odor.

By End-user Industry: Food and Beverage Emerges as Growth Leader
Automotive retained a hefty 52.65% share in 2025, absorbing solvent through OEM paint shops, refinish channels, and interior-adhesive applications. However, food and beverage is the fastest-expanding end-user industry at 5.12% CAGR as global decaffeination capacity scales and flavor extraction becomes vital to reformulating low-alcohol beverages. FDA and EU regulations frame ethyl acetate as safe for such uses, supporting its dominance over supercritical CO₂ or methylene chloride in medium-size plants where capital intensity is a concern.
Pharmaceuticals continue to buy premium GMP solvent for synthesis steps where low residuals are critical, while artificial-leather producers use ethyl acetate in polyurethane coatings for footwear and upholstery. Packaging and electronics represent smaller slices, but steady demand in cleaning formulations and photoresist stripping adds baseline volume that smooths cyclicality in larger segments.
Geography Analysis
Asia-Pacific accounted for 73.15% of 2025 tonnage thanks to China’s gigantic 4.30 million-ton installed base and India’s thriving API export industry. Despite chronic oversupply, regional consumption growth stays above 4% as infrastructure build-outs support coatings demand. North America records the fastest regional CAGR at 5.91% through 2031, a function of automotive supply-chain reshoring and new bio-based projects such as Viridis Chemical’s Nebraska plant, which benefits from ISCC PLUS certification.
Europe grapples with margin pressure from water-borne adhesive uptake and heavy environmental compliance costs, yet offset-printing ink reformulation and pharmaceutical demand stabilize solvent pull. Middle-East producers face harsher economics; Sipchem’s decision to idle its Saudi unit highlights how export-oriented plants struggle when Asian prices dip. South America and Africa post steady but modest gains, with investment concentrated in flexible-packaging converters serving regional food-processing industries.

Competitive Landscape
Global supply is moderately concentrated, yet ongoing Chinese capacity creep has nudged the country’s CR3 ratio from 43.7% in 2023 to 38.4% in 2024, indicating fragmentation. Vertical integration into acetic acid remains the critical success factor. Celanese commissioned a 1.3-million-ton acetic-acid unit at Clear Lake, Texas in 2023, cementing raw-material security for downstream ester plants. Daicel continues to run Japan’s only domestic acetic-acid line, with roughly half of output consumed internally for cellulose acetate and solvents. Eastman’s Kingsport and Longview sites provide a similar hedge; feedstocks and energy account for about 45% of its Chemical Intermediates cost base.
INEOS Acetyls is debottlenecking Chinese and Korean assets while studying a Gulf Coast greenfield that could come onstream before 2028. Its Prometheus project at Hull aims to cut plant CO₂ by 80% through hydrogen fuel switching. Bio-based specialists see white-space openings: SEKAB expanded bio-acetic acid in 2025, Godavari Biorefineries lowered steam intensity and added BONSUCRO certification, and Viridis Chemical leverages its 100% renewable footprint to serve North American OEMs. Process innovations center on energy efficiency and circular solvent recovery, yet enzymatic or fully green-chemistry routes have not displaced Fischer esterification.
Ethyl Acetate Industry Leaders
Celanese Corporation
Daicel Corporation
INEOS
Jiangsu Baichuan High-Tech New Materials Co., Ltd.
Yip’s Chemical Holdings Limited
- *Disclaimer: Major Players sorted in no particular order


Recent Industry Developments
- March 2025: Sipchem suspended production at its 100,000-ton ethyl acetate plant in Jubail, Saudi Arabia, citing the need to enhance profitability due to weak export pricing. The plant had an annual production capacity of 100,000 metric tons of ethyl acetate.
- October 2024: Laxmi Organic Industries Ltd. expanded its ethyl acetate production capacity by an additional 70 KTA, as the utilization rate had reached 90% to address increasing customer demand. The project involved an investment of INR 90.5 crore, which was financed through a combination of internal accruals, debt, and equity.


Research Methodology Framework and Report Scope
Market Definitions and Key Coverage
Our study defines the ethyl acetate market as all industrial and pharmaceutical grade molecules obtained from the esterification of acetic acid with ethanol and traded in bulk or packaged form for use as solvents, intermediates, and flavoring agents.
Scope Exclusion: Volumes or revenues from other acetates such as butyl acetate or ethyl lactate, downstream blend formulations, and captive in-process recycling are kept outside the scope.
Segmentation Overview
- By Source
- Petro-based
- Bio-based
- By Purity Grade
- Industrial/Coatings Grade
- Food Grade
- Pharmaceutical/GMP Grade
- By Application
- Paints and Coatings
- Flexible-Packaging Inks
- Adhesives and Sealants
- Pigments and Dyes
- Process Solvents
- Other Applications (Flavor and Fragrance Enhancers, Inks)
- By End-user Industry
- Automotive
- Artificial Leather
- Food and Beverage
- Pharmaceuticals
- Other End-user Industries (Packaging)
- By Geography
- Asia-Pacific
- China
- India
- Japan
- South Korea
- ASEAN Countries
- Rest of Asia-Pacific
- North America
- United States
- Canada
- Mexico
- Europe
- Germany
- United Kingdom
- France
- Italy
- NORDIC Countries
- Rest of Europe
- South America
- Brazil
- Argentina
- Rest of South America
- Middle-East and Africa
- Saudi Arabia
- United Arab Emirates
- South Africa
- Nigeria
- Rest of Middle-East and Africa
- Asia-Pacific
Detailed Research Methodology and Data Validation
Primary Research
Mordor analysts interview producers, coatings formulators, ink converters, and chemical distributors across Asia-Pacific, North America, Europe, and the Middle East; these conversations confirm utilization rates, contract price bands, and substitution trends that static documents cannot reveal.
Desk Research
We draw first on openly reported datasets such as UN Comtrade shipment codes 291531, Eurostat PRODCOM C-4104, and US EIA solvent balances; then we overlay capacity and price insights found in European Solvents Industry Group briefs. Company 10-K filings, investor presentations, and patent analytics accessed through Questel clarify player footprints, while D&B Hoovers and Dow Jones Factiva supply plant start-up timelines and spot pricing. The sources listed here are illustrative; many additional public records and specialized databases informed subsequent steps.
Market-Sizing & Forecasting
A top-down reconstruction converts country-level production plus imports minus exports into apparent demand; after which sampled ex-works prices multiplied by surveyed volumes give a bottom-up reasonableness check. Model drivers include the acetic acid feedstock index, automotive coatings output, pharmaceutical production growth, bio-based capacity additions, and East Asian export rebate levels. Multivariate regression combined with scenario analysis projects their influence to 2030; where supplier roll-ups disagree, regional penetration factors derived from primary calls bridge the gap.
Data Validation & Update Cycle
Outputs pass two analyst reviews; variance flags above three percent trigger re-work. Reports refresh annually, with interim updates when major plant outages, policy shifts, or price shocks occur. A final pass just before publication ensures clients receive the newest view.
Why Mordor's Ethyl Acetate Baseline Commands Reliability
Published estimates often diverge because firms choose different units, bundle captive use unevenly, or refresh data on different calendars. We outline the main gap drivers below.
Scope contrasts (volume versus value), inclusion of captive solvent loops, and dated Chinese capacity lists explain most differences. Mordor counts only merchant-grade material, converts currencies with IMF annual averages, and updates every twelve months; this narrows volatility and keeps our baseline dependable for planning.
Benchmark comparison
| Market Size | Anonymized source | Primary gap driver |
|---|---|---|
| 4.09 million tons (2025) | Mordor Intelligence | - |
| USD 4.70 billion (2024) | Global Consultancy A | Reports value and bundles captive flavors and adhesives |
| 5.15 million tons (2023) | Specialist Volume Tracker B | Uses older base year and omits Middle East export flows |
These contrasts show that, once scope, units, and refresh cadence are harmonized, Mordor's disciplined approach provides the most balanced, transparent baseline for decision-makers.


Key Questions Answered in the Report
What is the current volume of the ethyl acetate market?
The ethyl acetate market stands at 4.16 million tons in 2026 and is expected to reach 5.14 million tons by 2031.
Which application segment is expanding the fastest?
Adhesives and sealants are forecast to grow at a 5.29% CAGR through 2031.
How large is Asia-Pacific’s share of global demand?
Asia-Pacific held 73.15% of global volume in 2025.
Why are bio-based grades gaining attention?
Corporate net-zero targets and ISCC PLUS or USDA certificates allow buyers to cut Scope 3 emissions while maintaining solvent performance.
Page last updated on:


