Propionic Acid Market Size and Share
Market Overview
| Study Period | 2021 - 2031 |
|---|---|
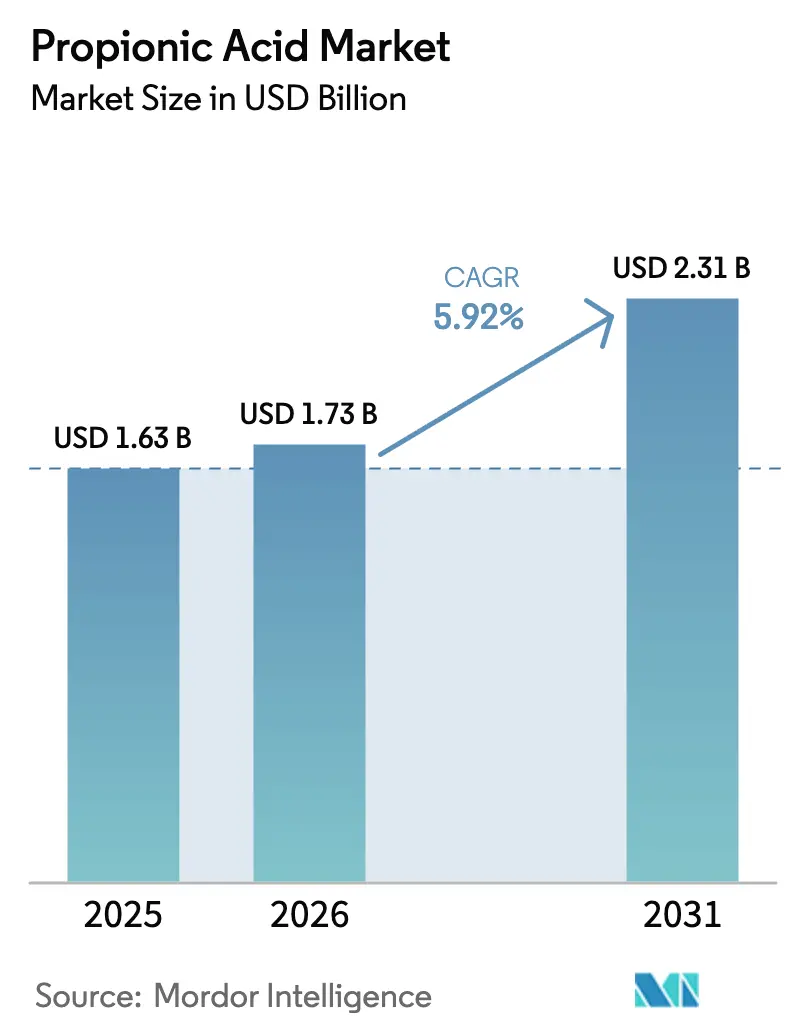
| Market Size (2026) | USD 1.73 Billion |
| Market Size (2031) | USD 2.31 Billion |
| Growth Rate (2026 - 2031) | 5.92% CAGR |
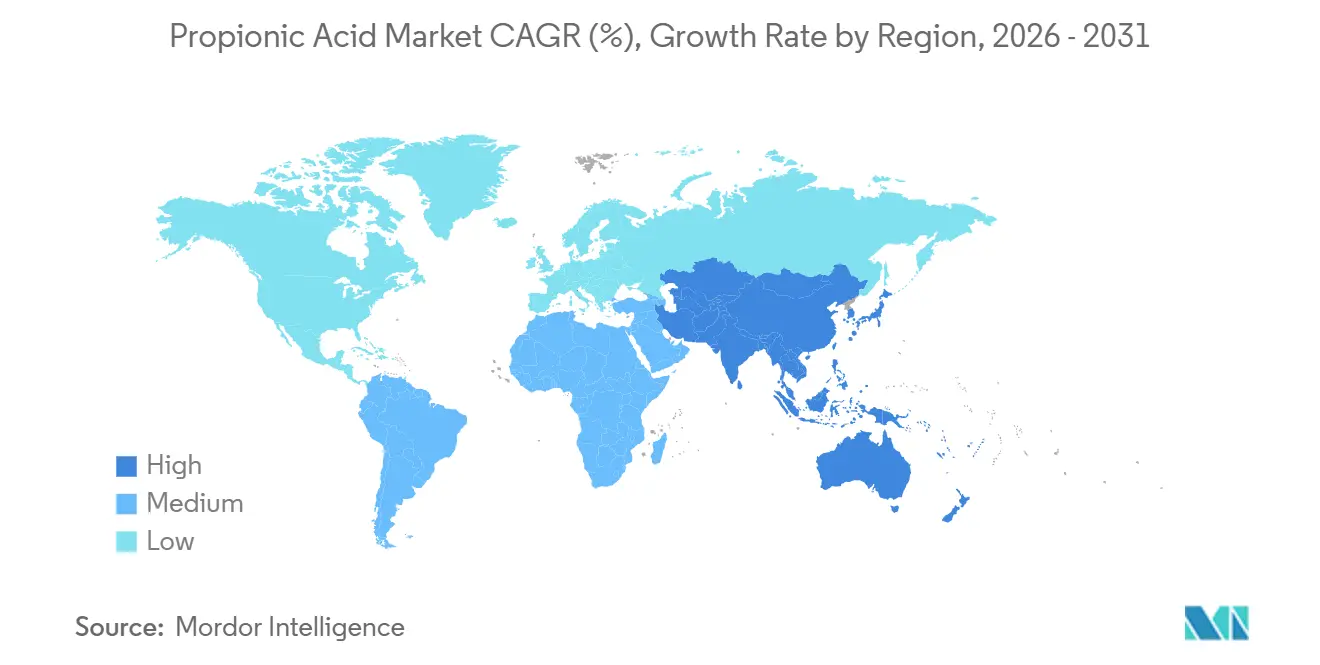
| Fastest Growing Market | Asia Pacific |
| Largest Market | Europe |
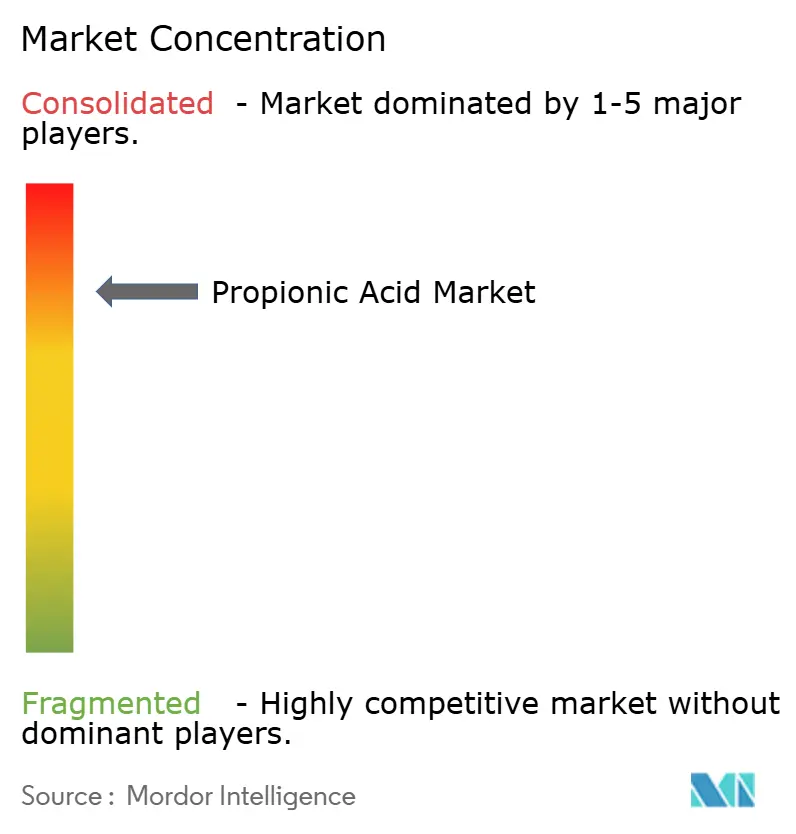
| Market Concentration | High |
Major Players *Disclaimer: Major Players sorted in no particular order Image © Mordor Intelligence. Reuse requires attribution under CC BY 4.0. | |
Propionic Acid Market Analysis by Mordor Intelligence
The Propionic Acid Market size was valued at USD 1.63 billion in 2025 and is estimated to grow from USD 1.73 billion in 2026 to reach USD 2.31 billion by 2031, at a CAGR of 5.92% during the forecast period (2026-2031). The propionic acid market is benefiting from the global pivot away from antibiotic growth promoters, growing demand for shelf-stable packaged foods, and steady uptake of bio-attributed production routes. Feed preservatives and bakery applications are anchoring volume, while specialty uses such as cellulose acetate propionate are capturing premium margins. Europe dominates the current value, but the propionic acid market is gaining momentum in the Asia-Pacific region as urbanization drives bread consumption and intensive livestock operations. Cost-competitive petrochemical synthesis still supplies most output, yet fermentation is advancing as food brands pursue Scope-3 emission cuts.
Key Report Takeaways
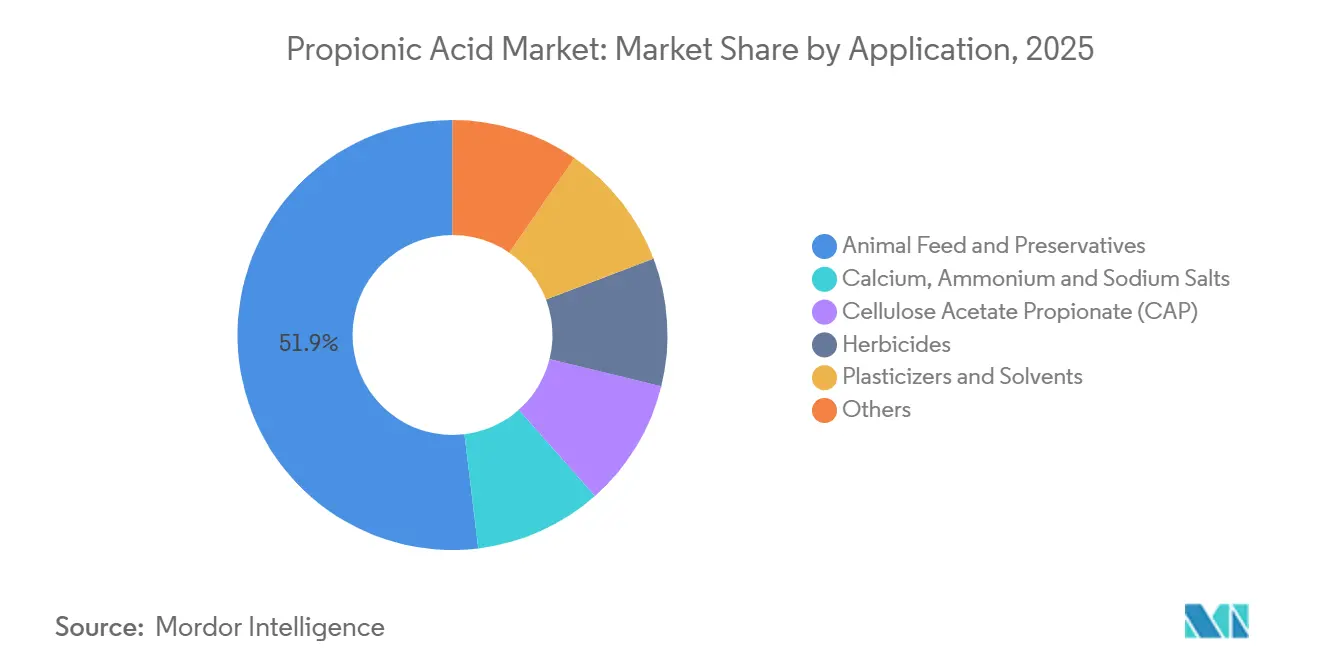
- By application, animal feed and food preservatives accounted for 51.92% of the propionic acid market share in 2025, and cellulose acetate propionate is forecast to grow at a 6.49% CAGR to 2031.
- By end-user industry, agriculture led with 56.98% revenue share in 2025, and pharmaceuticals are expected to expand at a 6.02% CAGR through 2031.
- By production route, petrochemical synthesis held a 92.34% share in 2025, and bio-based fermentation is projected to rise at a 6.19% CAGR to 2031.
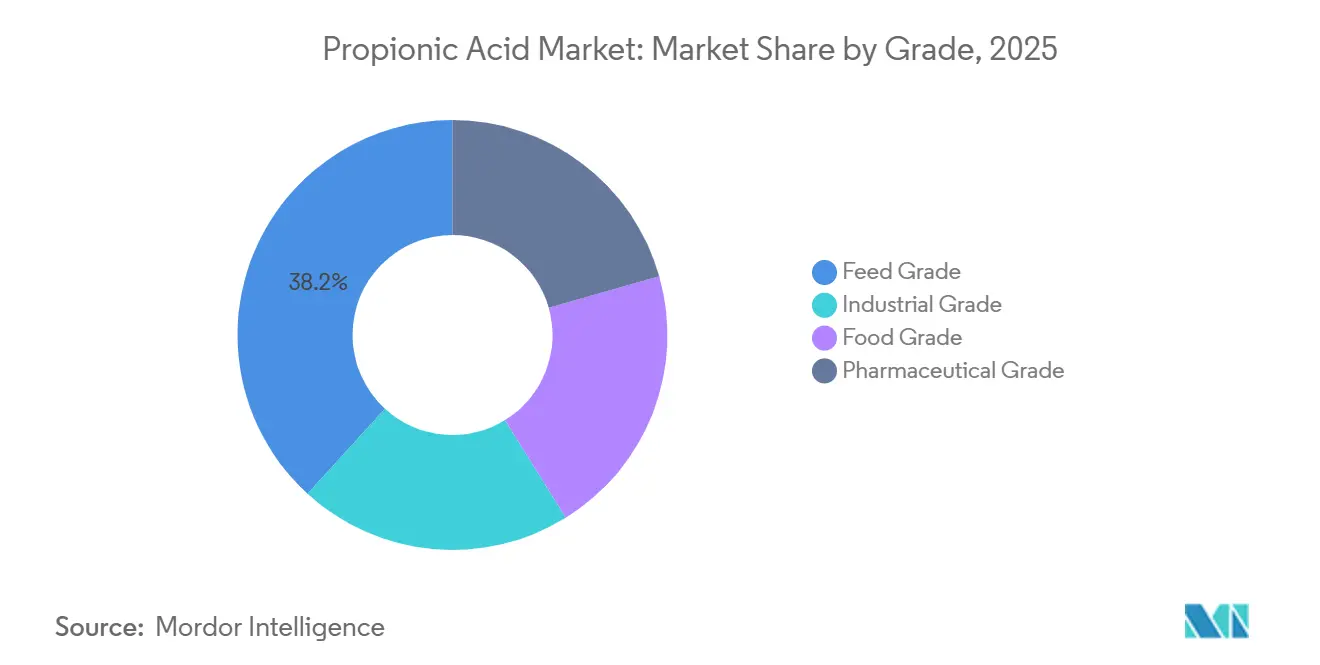
- By grade, feed variants commanded a 38.22% share in 2025, and the pharmaceutical grade is set to advance at a 6.14% CAGR up to 2031.
- By geography, Europe led with a 49.83% share in 2025, and Asia-Pacific is anticipated to register a 6.34% CAGR during the forecast period.
Note: Market size and forecast figures in this report are generated using Mordor Intelligence’s proprietary estimation framework, updated with the latest available data and insights as of January 2026.
Global Propionic Acid Market Trends and Insights
Drivers Impact Analysis*
| Drivers | (~) % Impact on CAGR Forecast | Geographic Relevance | Impact Timeline |
|---|---|---|---|
| Expanding demand for grain and silage preservatives | +1.4% | Global, with peak adoption in APAC and South America | Medium term (2-4 years) |
| Uptake of feed-grade acids in antibiotic-free meat chains | +1.6% | North America and the EU, spillover to APAC | Short term (≤ 2 years) |
| Packaged-bakery boom in emerging Asia | +1.2% | APAC core (China, India, Southeast Asia) | Medium term (2-4 years) |
| Growing requirement for shelf-life extension in processed foods | +0.9% | Global | Long term (≥ 4 years) |
| Food-brand Scope-3 decarbonization targets favouring low-carbon processes | +0.7% | North America and EU, early movers in APAC | Long term (≥ 4 years) |
| Source: Mordor Intelligence | |||
Expanding Demand for Grain and Silage Preservatives
Grain moisture levels exceeding a certain threshold foster the growth of Aspergillus and Penicillium, leading to aflatoxin levels surpassing Codex limits. However, many cooperatives find mechanical drying to be prohibitively expensive. Propionic acid effectively halts fungal growth, ensuring toxin levels remain within global standards. The U.S. Food and Drug Administration's GRAS status for direct feed inclusion provides livestock producers with regulatory assurance. In silage, both calcium and ammonium propionate prevent aerobic spoilage upon opening bunkers, safeguarding dry matter from potential loss. Adoption rates are highest in humid tropical regions, where mycotoxin pressures are pronounced. Consequently, the propionic acid market plays a pivotal role in enhancing feed safety and bolstering farmer profitability.
Uptake of Feed-Grade Acids in Antibiotic-Free Meat Chains
In response to European bans on sub-therapeutic antibiotics and similar policies in North America, integrators are increasingly turning to organic-acid programs. Propionic acid, known for lowering intestinal pH, effectively suppresses harmful pathogens like Salmonella and Clostridium, all while safeguarding beneficial lactobacilli. Field trials in broiler production have demonstrated its economic advantages. A 2024 assessment by the European Food Safety Authority, which found no genotoxic concerns, reaffirmed the safety of propionic acid[1]European Food Safety Authority, “Re-evaluation of Propionic Acid and Its Salts as Food Additives,” Efsa.europa.eu. In a notable industry trend, leading suppliers are now blending propionic, formic, and butyric acids. This move not only broadens their antimicrobial coverage but also indicates a shift away from single-acid strategies, bolstering the growth trajectory of the propionic acid market.
Packaged-Bakery Boom in Emerging Asia
In China, India, and Southeast Asia, urban households are now opting for sliced bread at breakfast, moving away from traditional staples. Adding calcium propionate effectively curbs the rope-forming Bacillus without compromising dough handling, thereby extending product freshness throughout lengthy distribution chains. National standards in both China and India align with Codex inclusion levels, facilitating smoother cross-border trade for bakery inputs. Operational since 2024, Corbion’s circular lactic-acid plant in Thailand not only underscores the growing confidence in fermentation-based preservatives but also positions the region for an expanded capacity in bio-derived propionic acid[2]Corbion, “Annual Report 2024,” Corbion.com . The surge in packaged-bread sales bolsters the Asia-Pacific's dominance in the propionic acid market's incremental demand.
Growing Requirement for Shelf-Life Extension in Processed Foods
Retailers favor long code dates that cut in-store waste, while consumers seek concise labels. Propionic acid is effective at low inclusion and carries E-number approval in the European Union, allowing formulators to meet both goals. U.S. Environmental Protection Agency data categorize propionic acid as a high-production-volume chemical, confirming industrial-scale availability. Food technologists now pair the acid with natural antioxidants and modified-atmosphere packaging to extract further shelf life without raising dosage, broadening the propionic acid market beyond bread toward tortillas, cheese, and ready meals.
Restraints Impact Analysis*
| Restraints | (~) % Impact on CAGR Forecast | Geographic Relevance | Impact Timeline |
|---|---|---|---|
| Volatile petro-based feedstock prices | -0.8% | Global, acute in regions reliant on imports | Short term (≤ 2 years) |
| Health concerns over chronic intake in ultra-processed foods | -0.5% | North America and EU | Medium term (2-4 years) |
| Capacity concentration-driven supply-chain risk | -0.3% | Global | Medium term (2-4 years) |
| Source: Mordor Intelligence | |||
Volatile Petro-Based Feedstock Prices
In 2025, refinery turnarounds and fluctuating cracker operating rates caused propylene spot prices to oscillate. These price swings tightened margins for producers without integrated olefin capacity and made pricing negotiations challenging for bakeries locked into fixed-price contracts. While fermentation offers a partial hedge—thanks to crude glycerol feedstock's independent trading from oil—bio routes remain costly, often reaching twice the price of petrochemical synthesis. This financial disparity moderates the immediate transition to a wholly renewable supply in the propionic acid market.
Health Concerns over Chronic Intake in Ultra-Processed Foods
Advocacy groups link preservative-rich diets to metabolic disorders, even though regulators have not amended acceptable daily intake levels. European Farm-to-Fork objectives emphasize fewer synthetic-sounding additives, prompting premium bakeries to adopt cultured-wheat alternatives or modified-atmosphere packaging. These consumer perceptions can restrain volume growth, yet the technical necessity of preventing mold keeps the propionic acid market resilient.
*Our forecasts treat driver/restraint impacts as directional, not additive. The impact forecasts reflect baseline growth, mix effects, and variable interactions.
Segment Analysis
By Application: Feed and Food Preservation Dominate while CAP Accelerates
Animal feed and food preservatives held 51.92% of the propionic acid market share in 2025. Cellulose acetate propionate posted a 6.49% CAGR outlook thanks to high-solids automotive refinish coatings and bio-content nail lacquers. The segment benefits from patents that increase propionyl content and support bio-content claims, boosting specialty demand. Calcium, ammonium, and sodium propionates remain indispensable in bread, dairy, and feed, where pH control is critical. Perstorp’s 2024 capacity addition supports captive production of salts and plasticizers, reinforcing supply stability. Herbicides and plasticizers occupy smaller shares, but their steady volumes diversify revenue and lessen risk.
Steady requirement for mold inhibition in global grain chains underpins the application hierarchy. The propionic acid market size for feed additives is projected to track livestock expansion in Asia-Pacific and South America at a mid-single-digit CAGR. Specialty coatings draw on cellulose acetate propionate to cut volatile organic compound levels in line with tightening regulations, adding high-margin growth. Producers balance commodity feed-grade manufacturing with smaller pharmaceutical and specialty runs to optimize capacity utilization, ensuring broad coverage of propionic acid market demand.


By End-User Industry: Agriculture Leads while Pharmaceuticals Gain Pace
Agriculture absorbed 56.98% of consumption in 2025 as integrators mandate organic-acid programs in antibiotic-free systems. The segment anchors baseline tonnage for the propionic acid market. Pharmaceuticals are forecast to grow at a 6.02% CAGR through 2031 on the rising adoption of controlled-release excipients and topical antimicrobials. Pharmacopeial monographs set the purity of propionic acid at high levels, solidifying its price premium over feed grade.
Manufacturers in the food and beverage sector rely on calcium propionate to prolong bread's shelf life, ensuring its viability through extensive distribution networks. Meanwhile, sectors like personal care, textiles, and electronics serve as niche markets, balancing out the seasonal fluctuations in demand from agriculture and bakeries. The pharmaceutical grade, bound by cGMP regulations, faces a limited supplier base, safeguarding its margins. This dynamic not only fortifies the pharmaceutical sector but also broadens the horizons of the propionic acid market, extending its reach beyond mere bulk feed preservation.
By Production Route: Petrochemical Scale Persists yet Fermentation Gains Recognition
Petrochemical Reppe carbonylation produced 92.34% of global output in 2025 by achieving high yields with mature catalysts. BASF’s plant in Nanjing exemplifies this scale, efficiently catering to regional demand. Bio-based fermentation, although smaller, carries a 6.19% CAGR forecast as food companies pursue lower-carbon sourcing. Moreover, continuous membrane fermentation has enhanced productivity on glycerol substrates, narrowing the economic gap with petrochemicals.
Petrochemical producers are adopting renewable power and heat-pump systems to reduce emissions, somewhat diminishing the sustainability edge of fermentation. Nevertheless, consumer brands are prompting suppliers for audited footprint data, spurring the growth of new bio-attributed capacities. Furthermore, hybrid approaches that integrate fermentation with catalytic upgrading may gain traction in the mid-term, broadening the supply base of the propionic acid market.
By Grade: Feed Quality Dominates while Pharmaceutical Purity Expands
Feed-grade variants held 38.22% of 2025 volume, driven by cost-centric livestock sectors. Pharmaceutical grade is set to grow at a 6.14% CAGR because drug-delivery formulators demand assured purity and traceability. Monographs from the United States Pharmacopeia and the European Pharmacopoeia set heavy-metal limits. Meanwhile, the food-grade variant, adhering to Codex standards, finds its niche in bakery and dairy applications.
Integrated producers such as BASF and Perstorp fractionate streams to address all four grades, optimizing reactor throughput and distillation cuts. Chinese producers focus on high-volume feed and food grades that serve domestic mills, leveraging freight advantages. A nascent niche combines fermentation origin with pharmaceutical purity, commanding premium pricing in nutraceutical and clean-label food products, and providing fresh headroom within the propionic acid market.
Geography Analysis
Europe controlled 49.83% of the global value in 2025. Early elimination of antibiotic growth promoters and stringent European Food Safety Authority evaluations stabilized demand for calcium propionate and feed-grade acids. Germany’s industrial bakeries and poultry farms consume large volumes, while funding for CO₂-free steam at BASF’s Ludwigshafen complex exemplifies policy support for lower-carbon chemicals. Capacity additions at Perstorp’s Stenungsund site further anchor Europe as a production base that can comply with emerging carbon-border adjustments. Mature yet stable bakery and livestock sectors keep the propionic acid market resilient across the region.
Asia-Pacific is projected to grow at a 6.34% CAGR through 2031, the fastest among regions. China leads consumption, supported by the BASF-YPC joint venture that supplies domestic feed mills and bakeries. India is ramping up organic-acid programs in poultry, and packaged-bread demand is climbing alongside urbanization. High-value markets such as Japan and South Korea require pharmaceutical-grade material, while Southeast Asia benefits from export-oriented poultry complexes. Corbion’s 2024 investment in Thailand signals confidence in fermentation-based preservatives within the region, pointing to future capacity shifts favorable to the propionic acid market.
North America, bolstered by its vast livestock operations and prominent bakery chains, accounts for about a quarter of the world's propionic acid demand. The U.S. Environmental Protection Agency reports that domestic production of propionic acid ensures a steady local supply. In a bid to enhance cross-border trade, Mexico and Canada have aligned their feed-safety protocols with those of the U.S. South America, predominantly driven by Brazil and Argentina, showcases a significant yet price-sensitive market, particularly in grain preservation. Meanwhile, the Middle East and Africa, though smaller, are on an upward trajectory. In Saudi Arabia, poultry expansion and a growing bakery sector in South Africa are fueling increased imports. Together, these varied regional dynamics play a pivotal role in sustaining the global propionic acid market.

Competitive Landscape
The propionic acid market is consolidated. Chinese suppliers expand aggressively to meet domestic bakery and feed demand, though export penetration remains constrained by quality perceptions and corrosive-acid logistics. OXEA announced additional oxo-acid capacity, signaling confidence in oxo intermediates despite force-majeure disruptions. Process innovation is intensifying: membrane fermentation, metabolic engineering, and catalytic upgrading of mixed acids are active patent areas. Suppliers able to certify cradle-to-gate carbon footprints below industry averages gain preference from multinational food brands facing Scope-3 obligations. Regulatory compliance with FDA GRAS status, EFSA approvals, and pharmacopeial standards remains a durable barrier that shields established players and supports pricing discipline in pharmaceutical and food-grade niches of the propionic acid market.
Propionic Acid Industry Leaders
BASF SE
Dow
Eastman Chemical Company
Perstorp
OXEA Gmbh
- *Disclaimer: Major Players sorted in no particular order

Recent Industry Developments
- November 2024: BASF's propionic acid has achieved "Lower than Market" verification from Carbon Trust, confirming its cradle-to-gate carbon footprint is below the industry average for fossil-based supplies. This recognition is expected to enhance BASF's competitive position and drive sustainability trends within the propionic acid market.
- December 2024: As of December 2024, Luxi Chemical Group initiated the construction of an 80,000 t y⁻¹ propionic acid complex in Liaocheng, China. However, the company has not provided any further updates regarding the project's completion.


Research Methodology Framework and Report Scope
Market Definitions and Key Coverage
Our study counts the global propionic acid market as the ex-factory revenue from feed, food, pharmaceutical, and industrial grades of neat propionic acid sold to downstream processors in agriculture, food, personal care, pharma, plastics, and broader chemical sectors. Demand is then traced back to each end-use, no matter whether the acid is petro- or bio-based.
Scope Exclusion: Stand-alone sales of derivative propionate salts, propionaldehyde, blends, or formulated herbicides are not included.
Segmentation Overview
- By Application
- Animal Feed and Preservatives
- Calcium, Ammonium and Sodium Salts
- Cellulose Acetate Propionate (CAP)
- Herbicides
- Plasticizers and Solvents
- Others
- By End-user Industry
- Agriculture
- Food and Beverage
- Personal Care
- Pharmaceutical
- Other End user Industries
- By Production Route
- Petrochemical
- Bio-based Fermentation
- By Grade
- Feed Grade
- Food Grade
- Pharmaceutical Grade
- Industrial Grade
- By Geography
- Asia-Pacific
- China
- India
- Japan
- South Korea
- Rest of Asia-Pacific
- North America
- United States
- Canada
- Mexico
- Europe
- Germany
- United Kingdom
- France
- Italy
- Rest of Europe
- South America
- Brazil
- Argentina
- Rest of South America
- Middle-East and Africa
- Saudi Arabia
- South Africa
- Rest of Middle-East and Africa
- Asia-Pacific
Detailed Research Methodology and Data Validation
Primary Research
Mordor analysts spoke with European feed technologists, Asian preservative buyers, and Latin American chemical distributors. These conversations refined average selling prices, bio-route penetration, and seasonality patterns that raw data alone could not reveal.
Desk Research
We mapped supply using UN Comtrade, Eurostat PRODCOM, USITC, and Chinese Customs records, and we gauged consumption through FAO feed balances, EFSA additive registers, and peer-reviewed mold-inhibition studies. Public company filings, REACH and FDA notices, plus news captured in Dow Jones Factiva and D&B Hoovers revealed capacity shifts and regulatory cut-offs. These titles illustrate the wider public corpus reviewed.
Market-Sizing & Forecasting
A top-down supply build-production plus net trade was reconciled with an end-use demand pool informed by livestock numbers, packaged bakery output, herbicide-treated acreage, plasticizer capacity, and inclusion rates. Select bottom-up checks (sampled plant capacity × utilization × ASP) tuned totals. Forecasts to 2030 apply multivariate regression blended with scenario analysis that flexes for feed demand elasticity, crude-linked feedstock costs, regulatory moves, and announced capacity.
Data Validation & Update Cycle
Outputs pass two analyst reviews that test historic ratios and regional price spreads, and models refresh annually. Interim updates follow any material shock, such as a plant outage or new capacity start that alters supply.
Why Mordor's Propionic Acid Baseline Earns Decision-Maker Trust
Published estimates diverge because firms vary scope, price point, and refresh cadence, and we spell those gaps out. Many alternative studies omit bio-based supply, blend delivered prices with ex-factory values, or fold derivative salts into headline revenue, whereas Mordor Intelligence reports pure acid, aligns currencies to annual averages, and validates every assumption with customs statistics and expert interviews.
Benchmark comparison
| Market Size | Anonymized source | Primary gap driver |
|---|---|---|
| Mordor Intelligence | USD 1.69 B (2025) | Mordor Intelligence | - |
| Global Consultancy A | USD 1.11 B (2023) | Global Consultancy A | Narrow application list and older base year depress figure |
| Industry Data Provider B | USD 1.80 B (2024) | Industry Data Provider B | Adds propionate salts and delivered price which inflates value |
| Trade Journal C | USD 1.57 B (2025) | Trade Journal C | Combines acid with solvents and updates infrequently |
The comparison shows that our disciplined scope, annual refresh, and dual validation give clients a balanced, transparent baseline they can reproduce through clear variables and repeatable steps.


Key Questions Answered in the Report
What is the projected value of the propionic acid market in 2031?
The market is expected to reach USD 2.31 billion by 2031, reflecting a 5.92% CAGR over the forecast period from USD 1.73 billion in 2026.
Which application currently dominates demand?
Animal feed and food preservatives account for 51.92% of the 2025 volume due to their role in mold and mycotoxin control.
Which region is growing the fastest?
Asia-Pacific is projected to expand at a 6.34% CAGR as urbanization boosts packaged-bread and livestock demand.
How are producers addressing sustainability pressures?
Suppliers are investing in renewable power, bio-attributed feedstocks, and verified carbon footprints to help food brands cut Scope-3 emissions.
Why is pharmaceutical-grade consumption rising?
Controlled-release excipients and topical antimicrobials require ≥99.5% purity, driving a 6.14% CAGR for pharmaceutical grade through 2031.
Page last updated on:


