4K TV Market Size and Share
Market Overview
| Study Period | 2019 - 2030 |
|---|---|
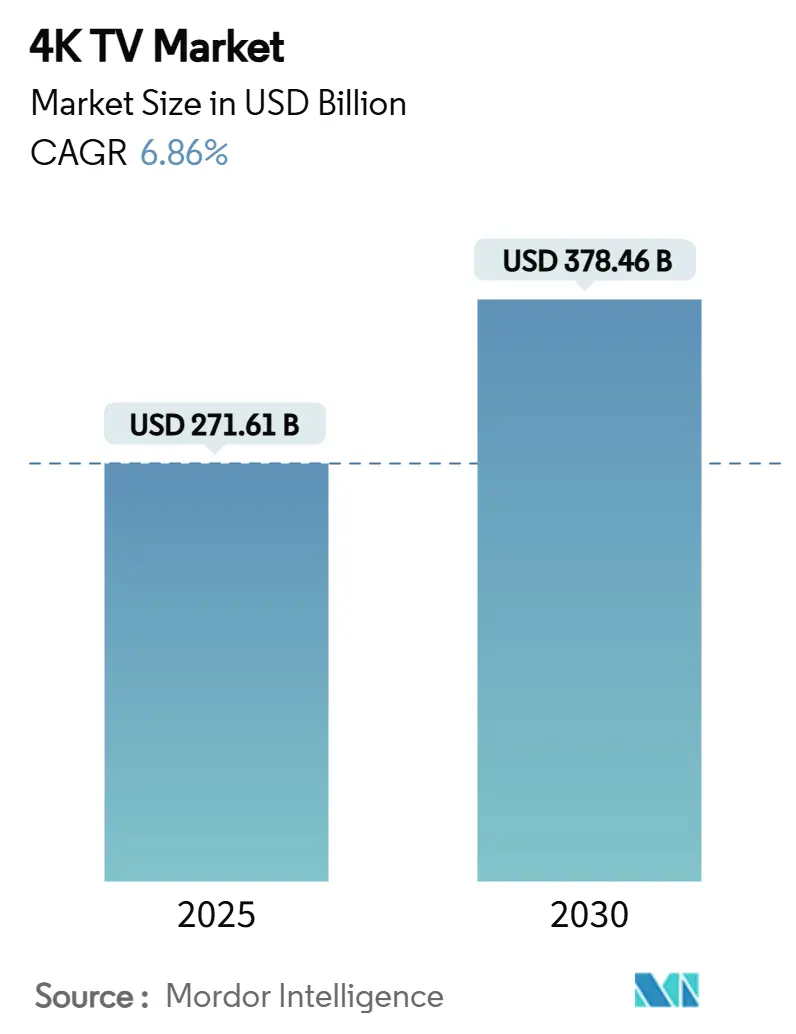
| Market Size (2025) | USD 271.61 Billion |
| Market Size (2030) | USD 378.46 Billion |
| Growth Rate (2025 - 2030) | 6.86% CAGR |
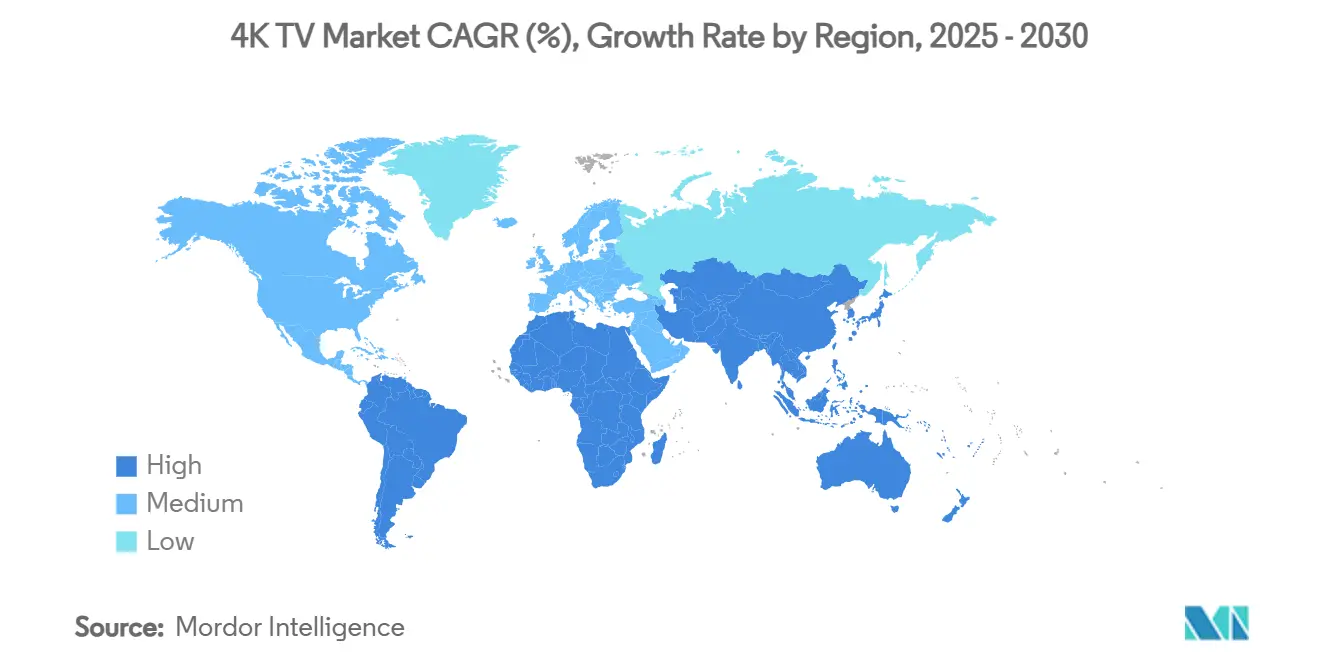
| Fastest Growing Market | Asia Pacific |
| Largest Market | North America |
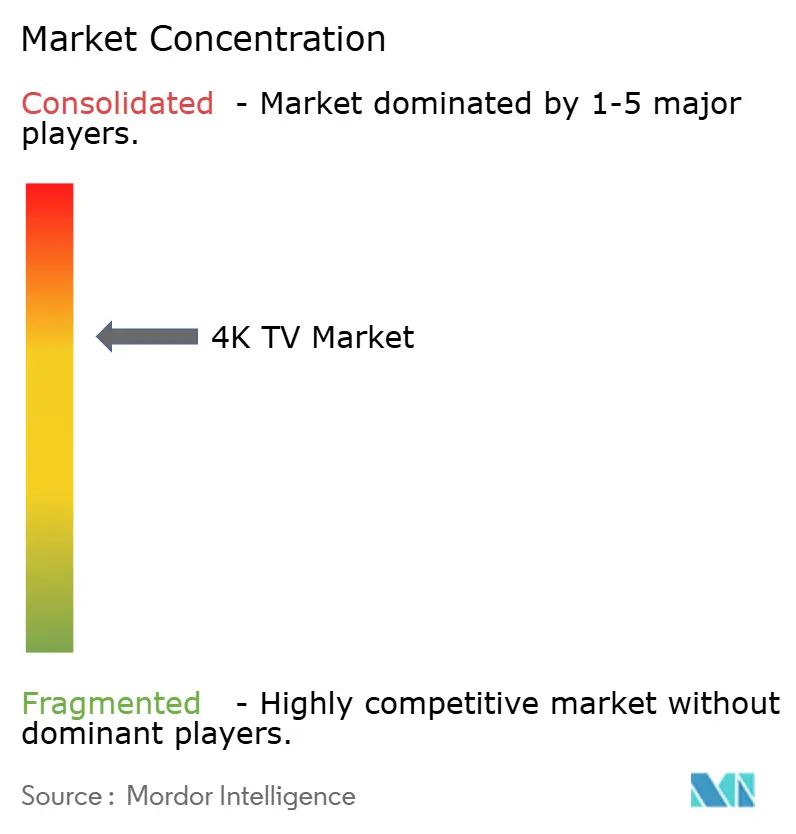
| Market Concentration | Medium |
Major Players *Disclaimer: Major Players sorted in no particular order Image © Mordor Intelligence. Reuse requires attribution under CC BY 4.0. | |
4K TV Market Analysis by Mordor Intelligence
The 4K TV market size stands at USD 271.61 billion in 2025 and is forecast to reach USD 378.46 billion by 2030, registering a 6.86% CAGR. Consumer adoption accelerates as streaming platforms expand native 4K libraries, and the HDMI 2.1 console cycle elevates demand for high-refresh displays. Panel prices for 55-inch UHD sets continue to fall, helped by Chinese manufacturing scale and improved OLED yields, which narrows the gap with MiniLED. The market also benefits from aggressive trade-in subsidies in China that refresh household inventories, while integrated connectivity features reposition televisions as smart-home hubs. Competitive dynamics intensify as Chinese brands capture share in Japan and large-format categories, forcing Korean incumbents to sign long-term OLED supply deals and ramp investments in AI-driven features.
Key Report Takeaways
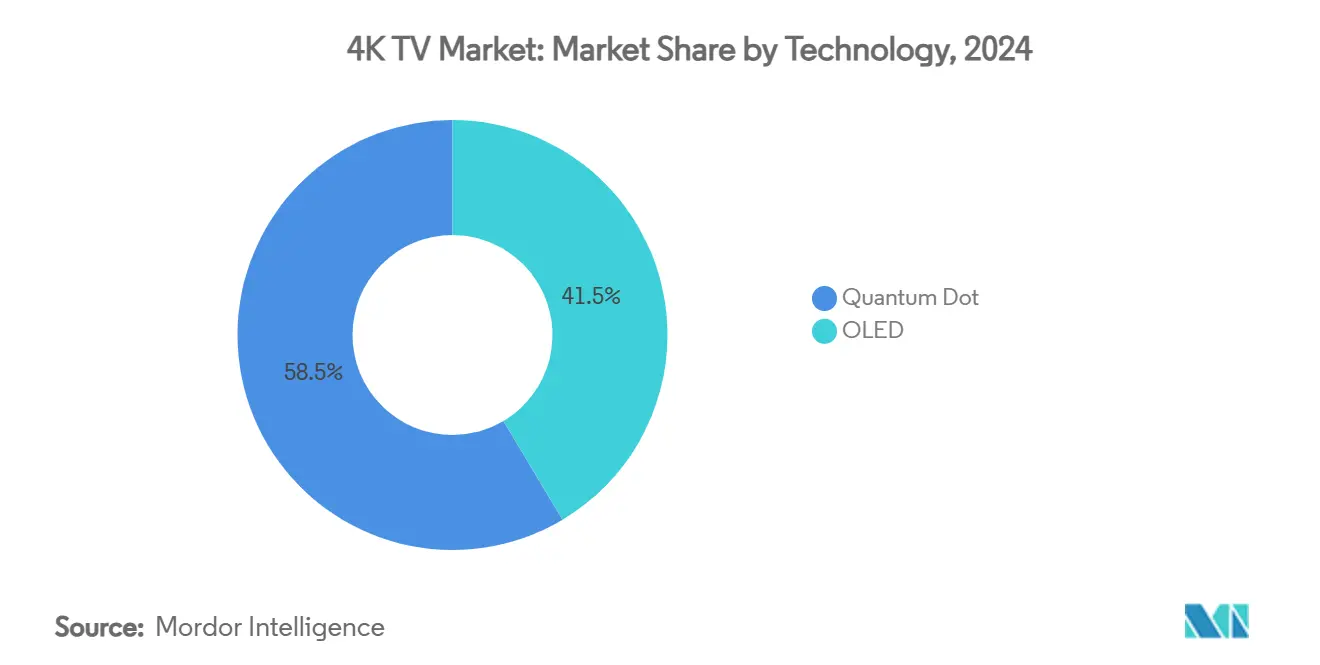
- By technology, OLED led with 41.46% of 4K TV market share in 2024, while Quantum Dot is projected to expand at a 6.98% CAGR to 2030.
- By screen size, the 40–59 inch bracket held 46.59% revenue share in 2024; the 80 inch-plus segment is advancing at a 7.11% CAGR through 2030.
- By operating system, Android TV/Google TV accounted for 32.79% share of the 4K TV market size in 2024, whereas Fire TV OS records the highest projected CAGR at 7.26% during 2025-2030.
- By connectivity, Wi-Fi + Ethernet configurations commanded 55.18% share in 2024, and Integrated Bluetooth and IoT Hub options are growing at a 7.11% CAGR.
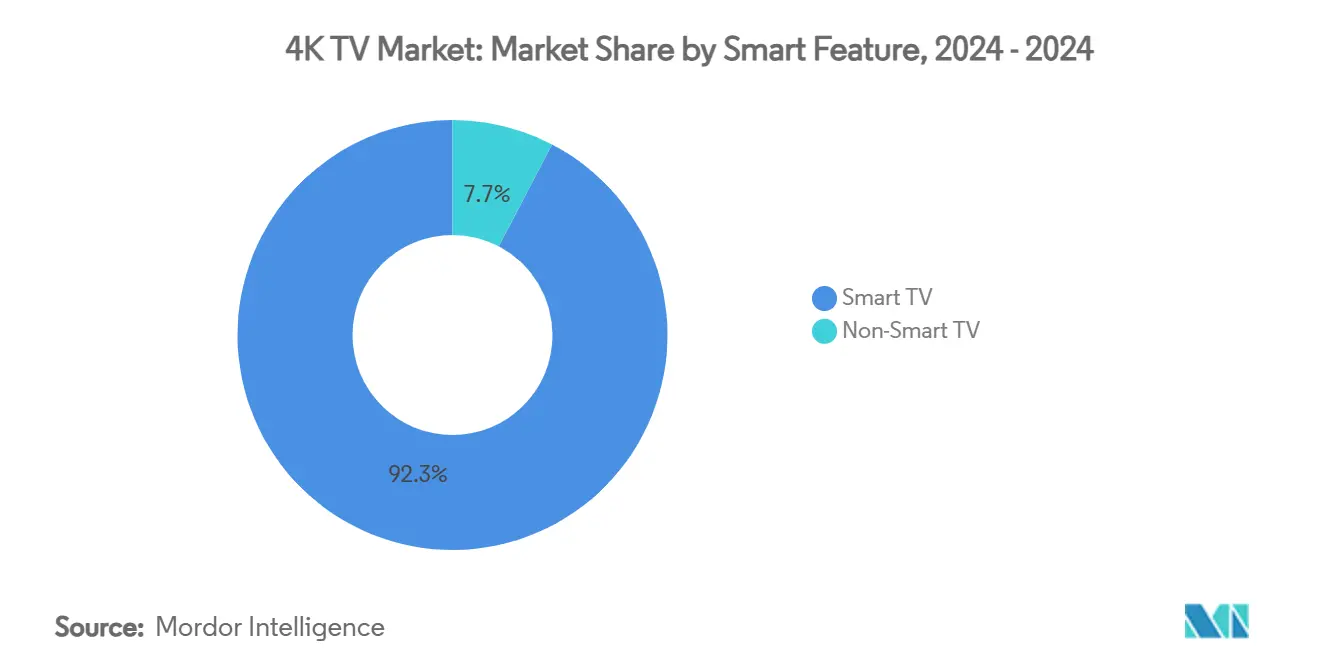
- By smart feature, Smart TV models captured 92.34% of 2024 revenue and are forecast to grow at a 7.56% CAGR through 2030.
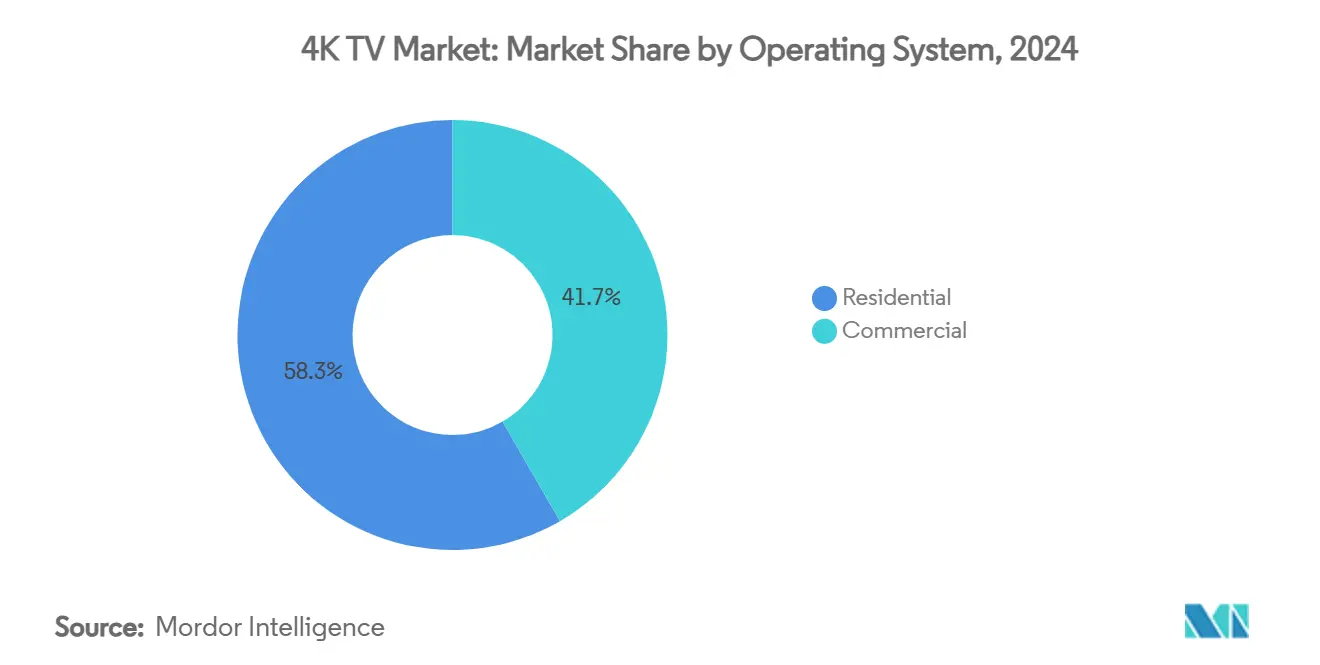
- By end user, residential buyers generated 58.33% of 2024 sales, while the commercial segment is set to expand at a 6.89% CAGR to 2030.
- By geography, North America contributed 33.92% of 2024 revenue; Asia-Pacific is the fastest-growing region at a 6.94% CAGR.
Note: Market size and forecast figures in this report are generated using Mordor Intelligence’s proprietary estimation framework, updated with the latest available data and insights as of January 2026.
Global 4K TV Market Trends and Insights
Drivers Impact Analysis*
| Driver | (~) % Impact on CAGR Forecast | Geographic Relevance | Impact Timeline |
|---|---|---|---|
| Streaming platforms exceed 6,000 native 4K titles | +1.2% | Global (North America, Europe leading) | Medium term (2-4 years) |
| Rapid panel cost decline for 55-inch UHD displays | +1.8% | Global (Asia-Pacific manufacturing hubs) | Short term (≤2 years) |
| Rising middle-class incomes in Asia-Pacific | +1.5% | Asia-Pacific core; spill-over to MEA | Long term (≥4 years) |
| HDMI 2.1 console upgrade cycle | +0.9% | North America and Europe; expanding to Asia-Pacific | Medium term (2-4 years) |
| China trade-in subsidies for energy-efficient TVs | +0.7% | China; potential replication in other Asia-Pacific markets | Short term (≤2 years) |
| MiniLED back-lighting narrows price gap with OLED | +0.5% | Global (Asia-Pacific manufacturing advantages) | Medium term (2-4 years) |
| Source: Mordor Intelligence | |||
Streaming platforms now offer >6,000 titles in native 4K
Content availability has reached critical mass as aggregated libraries cross 6,000 films and series, prompting consumers to upgrade hardware to unlock higher-tier subscriptions. [1]TV Answer Man, “Netflix Is Raising Prices; 4K Plan Will Now Cost USD 25 a Month,” tvanswerman.com Netflix’s premium plan price increase signals confidence that viewers will pay for quality, while ESPN’s first 4K College Football Playoff telecast proves live sports feasibility. This virtuous cycle raises hardware refresh rates, but bandwidth requirements above 25 Mbps still constrain adoption in underserved regions.
Rapid panel cost decline for 55-inch UHD sets
OLED production costs fell below USD 520 per 65-inch panel after yield gains at LG Display’s Guangzhou fab, and MiniLED costs are projected to slide toward USD 400 by 2025. Chinese brands instantly pass savings to consumers—as seen when TCL cut a 98-inch LCD from USD 5,999 to USD 1,999—which forces rivals to respond and broadens 4K TV market accessibility. Supply-chain risks remain, illustrated by quartz-mining disruptions that threaten semiconductor inputs.
Rising middle-class incomes in Asia-Pacific spur premium TV demand
Disposable income growth in India, China, and Southeast Asia lifts demand for 55-inch-plus premium sets. Samsung’s Indian TV revenue exceeded INR 10,000 crore in 2024, and OLED captured 78.3% of China’s premium segment, confirming willingness to pay for superior displays. Local assembly plans by Hisense aim to supply 2 million units within two years, leveraging tariff advantages and price sensitivity.
HDMI 2.1 game-console cycle drives high-refresh 4K upgrades
PlayStation 5 Pro and Xbox Series X performance gains require 4K@120 Hz capability, making compatible TVs essential for optimal gameplay. MediaTek’s Pentonic 800 adds four 48 Gbps ports in 2025 models, removing connectivity bottlenecks. Despite tariff-driven console price hikes, the gaming-TV ecosystem alignment sustains a premium buyer segment.
Restraints Impact Analysis*
| Restraint | (~) % Impact on CAGR Forecast | Geographic Relevance | Impact Timeline |
|---|---|---|---|
| Limited live 4K broadcast infrastructure | -0.8% | Global (developing markets hardest) | Long term (≥4 years) |
| Premium pricing of OLED above 70 inches | -0.6% | Global | Medium term (2-4 years) |
| Geo-political chip supply disruptions | -0.4% | Global supply chains | Short term (≤2 years) |
| Stricter energy-efficiency rules for >75 inch sets | -0.3% | Europe, North America | Medium term (2-4 years) |
| Source: Mordor Intelligence | |||
Limited live 4K broadcast infrastructure
Broadcasters still transmit most live events in 1080p, reducing perceived value of premium screens. ATSC 3.0 roll-outs improve HDR but seldom deliver native UHD, compelling networks to upscale Super Bowl feeds rather than originate 4K, which disappoints early adopters. [2]European Broadcasting Union, “NextGen TV: US Broadcasters Transition to Enhanced Services,” tech.ebu.ch The high cost of cameras, production trucks, and spectrum re-allocation slows progress, especially in emerging markets where ROI remains unclear.
Premium pricing of large-format OLED (>70 inches)
LG’s 97-inch OLED at USD 24,999 contrasts sharply with TCL’s 98-inch LCD at USD 1,999, keeping OLED penetration low in the largest-growing size tier. [3]Jasmine Choi, “The Endless Chinese TV Price War,” businesskorea.co.kr Yield challenges on oversized substrates maintain cost gaps, while MiniLED and Quantum Dot options meet brightness demands at lower prices, capping OLED’s addressable share among budget-conscious consumers.
*Our forecasts treat driver/restraint impacts as directional, not additive. The impact forecasts reflect baseline growth, mix effects, and variable interactions.
Segment Analysis
By Technology: Quantum Dot Narrows the Gap with OLED
OLED retained 41.46% 4K TV market share in 2024, confirming its leadership in color fidelity and black-level performance. Quantum Dot shipments are climbing at a 6.98% CAGR, aided by brightness advantages in well-lit rooms and lower material costs. Samsung’s USD 10.85 billion outlay for QD-OLED underscores continued innovation, yet recent production shifts toward WOLED supply from LG Display signal a pragmatic pivot to proven capacity.
The 4K TV market size advantage for Quantum Dot widens further in large formats where MiniLED backlights close the contrast gap while staying price-competitive. Premium TV deliveries rose 38% in 2024, and MiniLED-LCD volumes jumped 170%, surpassing OLED for the first time. Hisense’s 116UX achieves 10,000 nits peak brightness, highlighting the momentum behind LCD-based technologies.


By Screen Size: Supersized Displays Propel Growth
Sets between 40 and 59 inches generated 46.59% revenue in 2024, reflecting mainstream affordability and shipping efficiencies. However, the 80-inch-plus cohort is posting the fastest uptake at 7.11% CAGR as falling panel prices democratize cinema-style viewing. Samsung’s planned 100-to-115-inch releases illustrate competitive urgency after TCL captured leadership in the very-large category.
The 4K TV market size for 80-inch-plus models is forecast to double by 2030, aided by improved logistics and lighter composite chassis. In contrast, below-40-inch sets decline as mobile devices satisfy small-screen needs. LG’s USD 1 billion capacity expansion aims to trim OLED costs and push larger panels into mass price bands, reinforcing size as the new differentiator.
By Operating System: Ecosystem Wars Intensify
Android TV/Google TV held 32.79% share in 2024, benefiting from search integration and app breadth. Fire TV OS is accelerating at 7.26% CAGR as Amazon bundles the platform with value-tier panels and leverages Prime content to lock in users. The 4K TV market thrives on ecosystem stickiness, with manufacturers trading hardware margin for recurring advertising and subscription revenue.
Tizen remains entrenched through Samsung’s scale, while webOS capitalizes on LG’s OLED franchise. Emerging AI assistants such as Microsoft Copilot on LG sets transform televisions into multifunction hubs, signaling a shift from passive screens to interactive dashboards. The strategic focus now tilts toward software roadmaps rather than pure panel specs.
By Connectivity: IoT-Ready TVs Gain Momentum
Dual Wi-Fi and Ethernet ports account for 55.18% of shipments, offering flexibility for high-bitrate streams. Integrated Bluetooth and IoT Hub variants grow at 7.11% CAGR as consumers expect TVs to command smart-home devices. Samsung’s Vision AI showcases this evolution, enabling voice-driven device orchestration and personalized profiles.
4K TV market opportunities expand as connectivity standards merge with Matter and Thread protocols, ensuring cross-brand compatibility. Wi-Fi-only sets hold in entry tiers, while wired-only configurations cater to hospitality and signage installations where security outweighs convenience.
By Smart Feature: Software Becomes the Differentiator
Smart TVs captured 92.34% of revenue in 2024 and are advancing at 7.56% CAGR, effectively rendering non-smart offerings obsolete outside niche commercial uses. App ecosystems, AI content curation, and wireless casting define purchase decisions. LG’s 2025 QNED evo adds true wireless video transmission, eliminating cable clutter and enhancing placement flexibility.
As the 4K TV market pivots to service-centric models, firmware updates and cloud gaming integrations extend product life cycles. Manufacturers monetize through targeted ads and premium app bundles, turning the TV into a recurring-revenue platform.
By End User: Commercial Deployments Accelerate
Residential buyers still drove 58.33% of 2024 invoices, yet commercial installations exhibit a 6.89% CAGR, propelled by retail video walls, hospitality upgrades, and corporate communications. Sports bars adopt multi-input 4K walls to create immersive viewing and retain patrons, as demonstrated by Buffalo Wild Wings’ LED installation.
The 4K TV market size for corporate lobbies and conference rooms benefits from falling MiniLED costs and integrated wireless presentation. Hospitality chains like Crowne Plaza Muscat deploy hundreds of smart screens to personalize guest services, underscoring B2B momentum.
Geography Analysis
North America generated 33.92% of 2024 revenue thanks to high ARPU streaming subscriptions and widespread Gigabit broadband. Government spectrum incentives accelerate ATSC 3.0 roll-outs, but content gaps still temper replacement cycles. Asia-Pacific is the growth engine at 6.94% CAGR as rising incomes align with aggressive brand promotions and state subsidies that boost turnover of legacy sets.
The 4K TV market size in Asia-Pacific benefits from vertically integrated supply chains where panel fabs, SoC plants, and final assembly co-locate, slashing costs and shortening lead times. Chinese vendors now hold over 50% share in Japan, demonstrating export competitiveness even in historically brand-loyal markets. Europe shows steady upgrades, but strict ecodesign rules cap power consumption of sets above 75 inches, steering R&D toward efficiency rather than brightness.
South America and MEA remain nascent yet promising as broadband roll-outs and retail financing lift accessibility. Brazilian retailers bundle streaming subscriptions with large-screen promotions, while Gulf hospitality projects adopt oversized displays for luxury positioning, creating pockets of high growth within developing regions.

Competitive Landscape
Market concentration is moderate. Samsung retained the top revenue slot for a 19th successive year with 28.3% share in 2024, though down from 30.1% in 2023. LG leads OLED with 52.4% share but faces erosion in supersized LCD categories where Hisense and TCL claim unit leadership. Chinese brands now account for more than half of Japan’s flat-screen sales, underscoring their rising global clout.
Strategic responses include Samsung and LG’s five-year agreement covering 5 million OLED panels, illustrating coopetition against cost-aggressive challengers. Investments also shift toward AI and software, as Walmart’s acquisition of VIZIO secures an advertising platform to compete with Roku and Amazon. Patent filings around pixel circuits and low-power drivers suggest efficiency gains will become the next battlefield.
4K TV Industry Leaders
Samsung Electronics Co., Ltd.
LG Electronics Inc.
TCL Technology Group Corp.
Hisense Group Co., Ltd.
Sony Group Corp.
- *Disclaimer: Major Players sorted in no particular order

Recent Industry Developments
- July 2025: Samsung partnered with Warner Bros. to market 98- to 115-inch “Super Big” TVs alongside the new Superman release.
- June 2025: LG Display committed KRW 1.26 trillion to bolster OLED capacity through 2027.
- May 2025: Shenzhen’s 8K UHD Alliance introduced GPMI, a 192 Gbps wired interface backed by Hisense and TCL.
- April 2025: Samsung’s Visual Display Business posted KRW 14.5 trillion revenue in Q1, citing Neo QLED momentum.


Global 4K TV Market Report Scope
| OLED (Organic Light Emitting Diode) Display |
| Quantum Dot |
| Below 40 Inches |
| 40–59 Inches |
| 60–79 Inches |
| 80 Inches and Above |
| Android TV / Google TV |
| webOS |
| Roku TV OS |
| Fire TV OS and Other Operating Systems |
| Wi-Fi + Ethernet Enabled |
| Wi-Fi Only |
| Wired-Only |
| Integrated Bluetooth and IoT Hub among Other Conectivity Types |
| Smart TV |
| Non-Smart TV |
| Residential |
| Commercial |
| North America | United States | |
| Canada | ||
| Mexico | ||
| South America | Brazil | |
| Argentina | ||
| Rest of South America | ||
| Europe | Germany | |
| United Kingdom | ||
| France | ||
| Russia | ||
| Rest of Europe | ||
| Asia-Pacific | China | |
| Japan | ||
| India | ||
| South Korea | ||
| Australia | ||
| Rest of Asia-Pacific | ||
| Middle East and Africa | Middle East | Saudi Arabia |
| United Arab Emirates | ||
| Rest of Middle East | ||
| Africa | South Africa | |
| Egypt | ||
| Rest of Africa | ||
| By Technology | OLED (Organic Light Emitting Diode) Display | ||
| Quantum Dot | |||
| By Screen Size | Below 40 Inches | ||
| 40–59 Inches | |||
| 60–79 Inches | |||
| 80 Inches and Above | |||
| By Operating System | Android TV / Google TV | ||
| webOS | |||
| Roku TV OS | |||
| Fire TV OS and Other Operating Systems | |||
| By Connectivity Type | Wi-Fi + Ethernet Enabled | ||
| Wi-Fi Only | |||
| Wired-Only | |||
| Integrated Bluetooth and IoT Hub among Other Conectivity Types | |||
| By Smart Feature | Smart TV | ||
| Non-Smart TV | |||
| By End User | Residential | ||
| Commercial | |||
| By Geography | North America | United States | |
| Canada | |||
| Mexico | |||
| South America | Brazil | ||
| Argentina | |||
| Rest of South America | |||
| Europe | Germany | ||
| United Kingdom | |||
| France | |||
| Russia | |||
| Rest of Europe | |||
| Asia-Pacific | China | ||
| Japan | |||
| India | |||
| South Korea | |||
| Australia | |||
| Rest of Asia-Pacific | |||
| Middle East and Africa | Middle East | Saudi Arabia | |
| United Arab Emirates | |||
| Rest of Middle East | |||
| Africa | South Africa | ||
| Egypt | |||
| Rest of Africa | |||


Key Questions Answered in the Report
What is the current value of the 4K TV market?
The 4K TV market size is USD 271.61 billion in 2025.
Which technology currently leads sales?
OLED holds the largest 4K TV market share at 41.46% in 2024.
How fast is the 80-inch-plus segment growing?
Sets larger than 80 inches are expanding at a 7.11% CAGR between 2025 and 2030.
Which operating system is growing the quickest?
Fire TV OS is projected to post a 7.26% CAGR through 2030.
What region shows the highest future growth?
Asia-Pacific is forecast to grow at 6.94% CAGR, driven by rising incomes and government incentives.
Page last updated on:


