
5k Display Resolution Market Size and Share
Market Overview
| Study Period | 2020 - 2031 |
|---|---|
| Market Size (2026) | USD 0.71 Trillion |
| Market Size (2031) | USD 1.77 Trillion |
| Growth Rate (2026 - 2031) | 20.12 % |
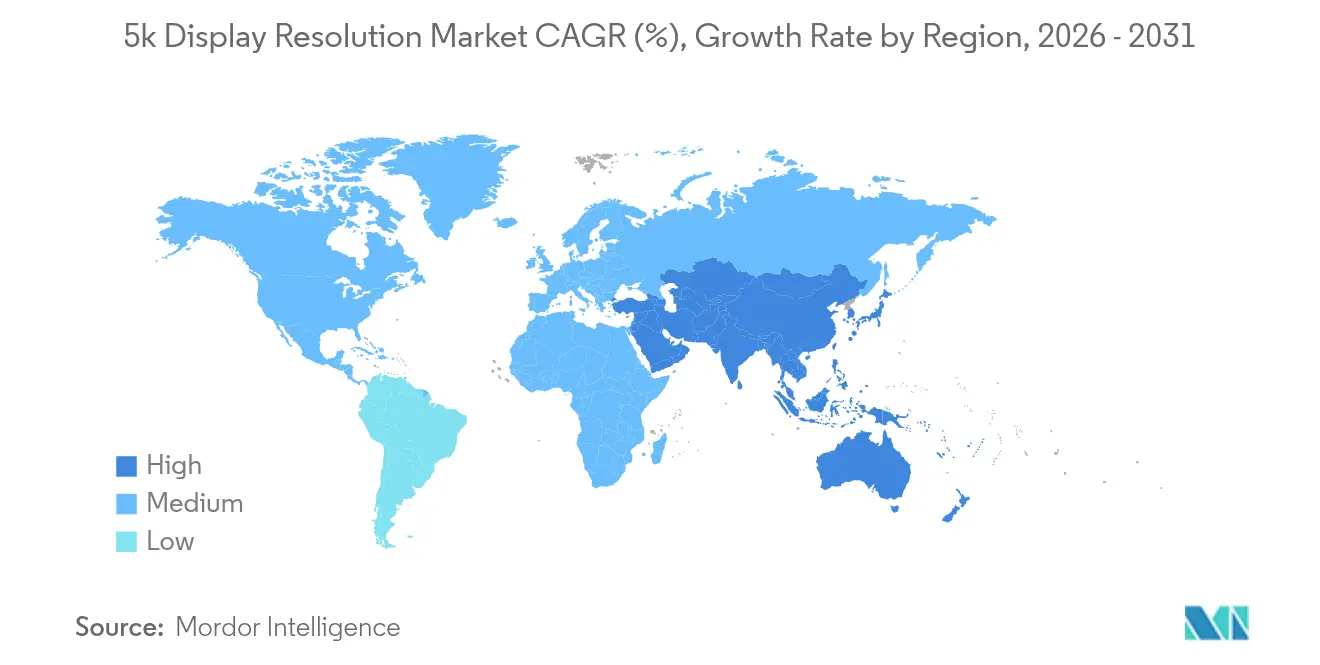
| Fastest Growing Market | Asia Pacific |
| Largest Market | Asia Pacific |
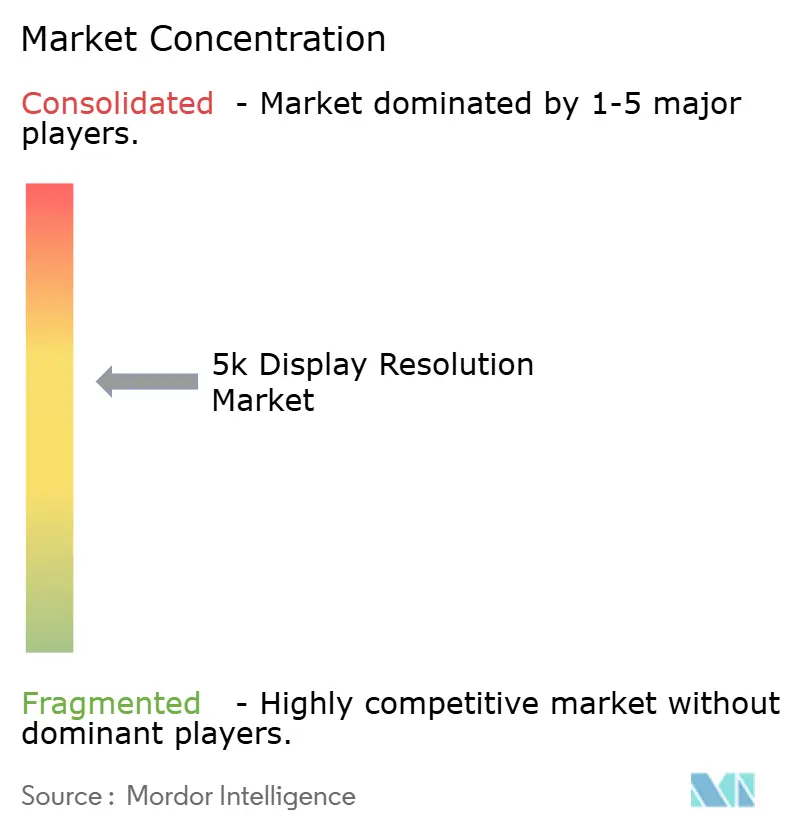
| Market Concentration | Medium |
Major Players *Disclaimer: Major Players sorted in no particular order Image © Mordor Intelligence. Reuse requires attribution under CC BY 4.0. | |
5k Display Resolution Market Analysis by Mordor Intelligence
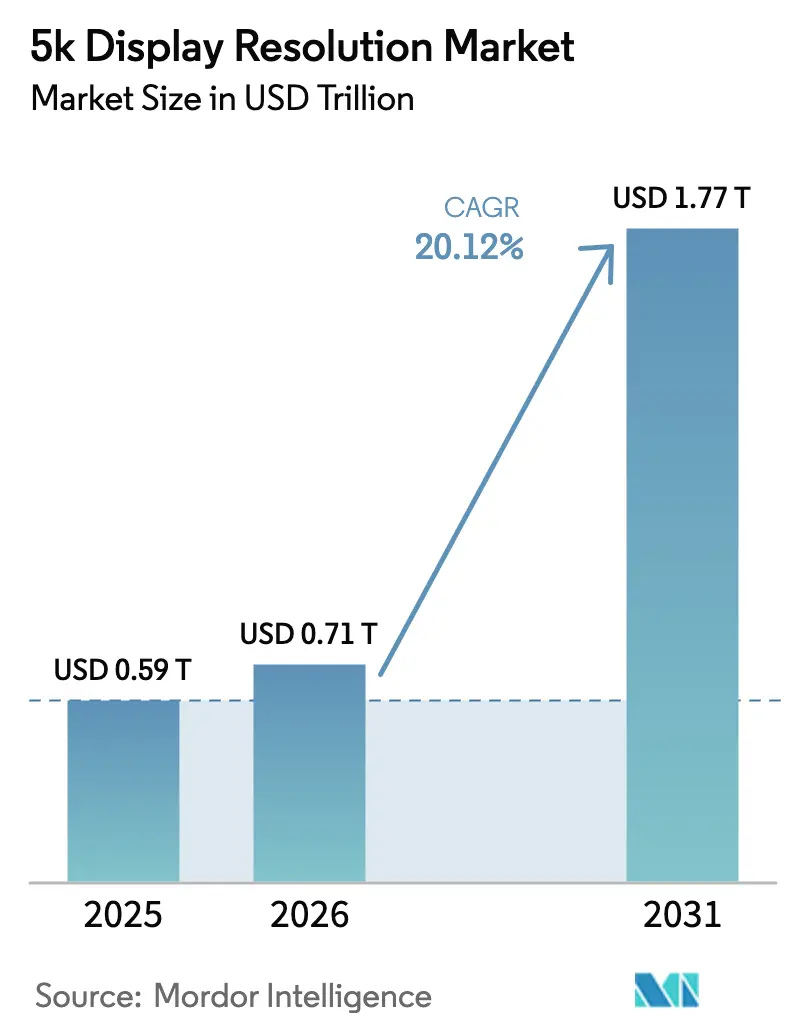
The 5k display resolution market size in 2026 is estimated at USD 0.71 trillion, growing from 2025 value of USD 0.590 trillion with 2031 projections showing USD 1.77 trillion, growing at 20.12% CAGR over 2026-2031. Demand clusters around three upgrade waves. First, Hollywood and Korean studios are adopting AI-assisted HDR grading suites that need a single-screen 5K canvas for color wheels, node graphs and full 4K timeline playback. Second, premium EV makers such as Lucid and NIO are rolling out bonded 5K instrument clusters that raise pixel-per-degree values essential for Level 3 autonomous hand-off warnings. Third, GCC airports and large hospitals are swapping tiled 4K walls with ultra-wide or mini-LED 5K panels to eliminate bezels and improve workflow sight lines. On the supply side, Gen 8.6 oxide yields passed 90% in late-2024, trimming the cost delta versus 4K to USD 70 for 31-inch glass, while DisplayPort 2.1 and Thunderbolt 5 controllers now sustain lossless 5K at 240 Hz over passive copper.
Key Report Takeaways
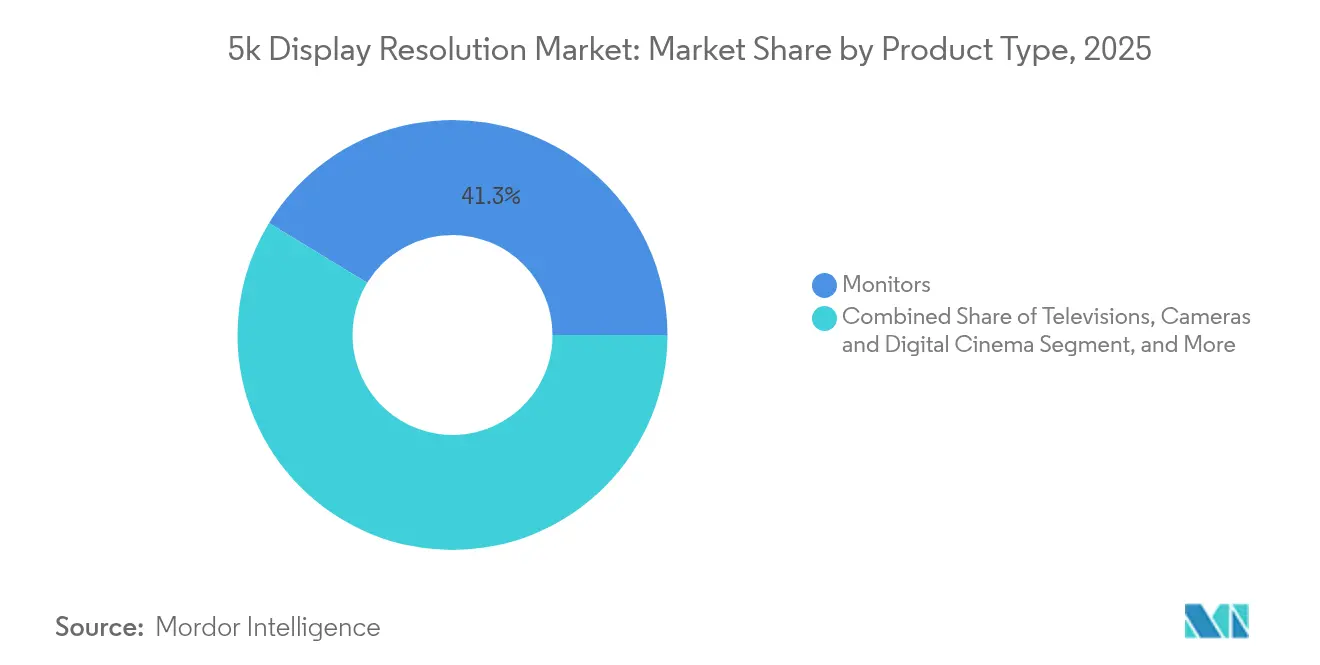
- By product type, consumer and professional monitors led with 41.27% revenue share in 2025; laptops and tablets are forecast to expand at 26.4% CAGR through 2031.
- By panel technology, LCD (IPS/VA) captured 62.88% of 2025 revenue; mini-LED / micro-LED is projected to grow at 28.9% CAGR.
- By native resolution, the 5,120 × 2,880 format accounted for 47.86% share in 2025, while the 5,120 × 1,440 ultra-wide format is set for 28.1% CAGR growth.
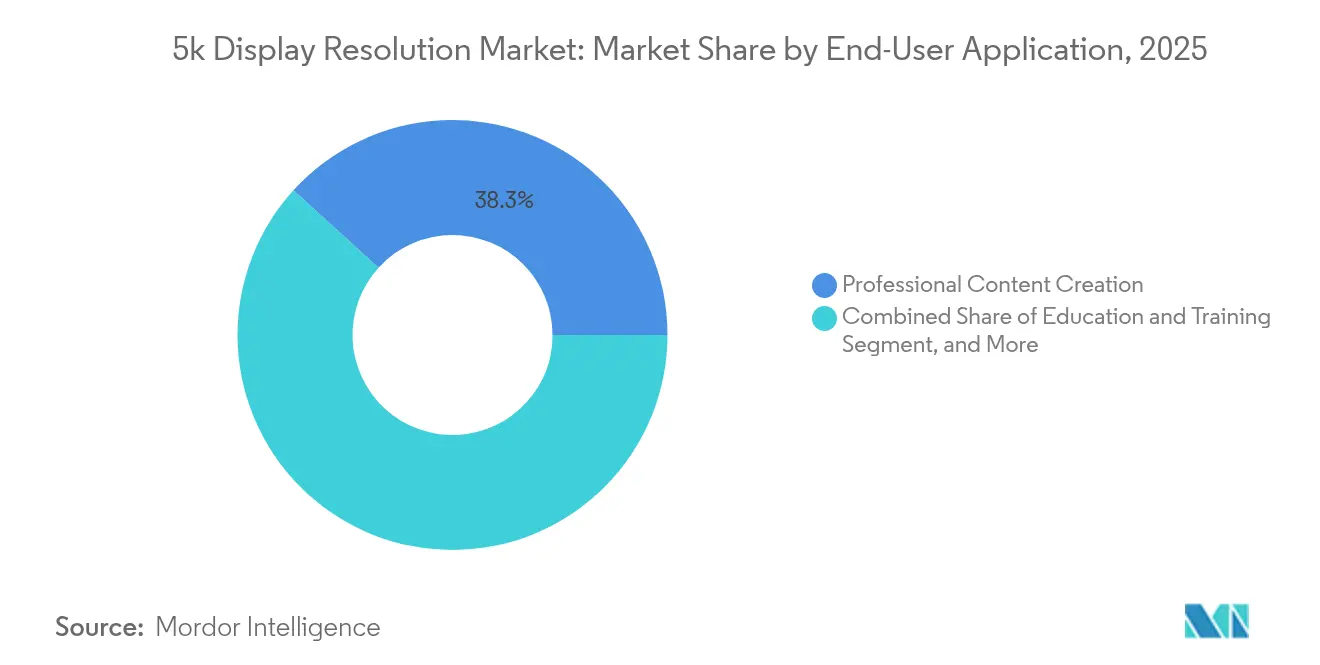
- By end-user application, professional content creation held 38.25% of 2025 revenue, whereas automotive cockpit displays post the fastest 31.6% CAGR.
- By distribution channel, offline retail and pro-AV integrators contributed 53.92% of 2025 sales; online direct and marketplaces will rise at 23.4% CAGR.
- By geography, Asia-Pacific delivered 35.98% of 2025 spending and is expected to progress at 22.9% CAGR through 2031.
Note: Market size and forecast figures in this report are generated using Mordor Intelligence’s proprietary estimation framework, updated with the latest available data and insights as of 2026.
Market Trends and Insights
Drivers Impact Analysis of 5k Display Resolution Market*
| Driver | (~) % Impact on CAGR Forecast | Geographic Relevance | Impact Timeline |
|---|---|---|---|
| AI-assisted 5K post-production workstations | +2.5% | United States, South Korea | Medium term (2-4 years) |
| Ultra-wide 5K airport signage upgrades | +2.0% | United Arab Emirates, Saudi Arabia | Short term (≤ 2 years) |
| 5K surgical monitors for robotic procedures | +1.8% | Japan, Germany | Medium term (2-4 years) |
| In-vehicle 5K instrument clusters in premium EVs | +1.5% | United States, China | Long term (≥ 4 years) |
| Roll-out of DisplayPort 2.1 and Thunderbolt 5 docks | +1.3% | Global | Short term (≤ 2 years) |
| Creator-class 5K OLED laptop launches in China | +1.1% | China | Medium term (2-4 years) |
| Source: Mordor Intelligence | |||
Surging Adoption of 5K-Ready Workstations for AI-Assisted Post-Production in Hollywood and Korean Studios
Cutting-edge generative fill, rig removal and HDR tone-mapping tools now operate in real time only when panels present a contiguous 14.7 million-pixel canvas. Early field data from two Los Angeles suites shows a 17% reduction in conform time after replacing dual 4K monitors with single 5K units. [1]Apple Inc., “Mac Studio and Studio Display,” apple.com Korean drama editors record similar wins and are ordering 43,000 incremental 31-inch IPS 5K screens through 2026. Workstation OEMs quote DisplayPort 2.1 cards as standard, signaling the final removal of bandwidth bottlenecks, and cloud bureau finishing houses echo the shift to 5K because mezzanine ProRes at that resolution stays below 800 Mbps over 10 GbE links.
Expansion of Ultra-Wide 5K Signage in Airport Command-and-Control Upgrades across GCC
Abu Dhabi’s Midfield terminal switched on 88 linear meters of 5,120 × 1,440 LED cabinets in November 2024, eliminating bezel artefacts that previously obstructed A-SMGCS overlays. [2]Abu Dhabi Airports, “Midfield Terminal Advanced ATC,” adac.ae Saudi Arabia’s Vision 2030 avionics roadmap earmarks a further 230 such panels for Riyadh and Jeddah by 2026. Ultra-wide canvases match radar sector aspect ratios, decrypting color-critical warnings without forcing operators to scan vertically. Integrators also report a 15% reduction in GPU rack count as single DisplayPort 2.1 feeds can now drive two 5K canvases, lowering power budgets.
Proliferation of 5K Surgical Monitors for Robotic-Assisted Procedures in Japan and Germany
Da Vinci Xi and Hugo RAS consoles now default to 5,120 × 2,880 mini-LED panels. Peer-reviewed trials at Osaka University Hospital logged a 24% faster knot-tying metric attributable to clearer stereoscopic cues. [3] Intuitive Surgical, “Clinical Publications for Da Vinci Xi,” intuitive.com German cardiac centers, able to claim G-DRG H01 reimbursement for capital that reduces recovery time, followed suit, driving a 41% year-on-year spike in 2024 shipments. Supply contracts cover another 9,700 units through 2027 as hospitals aim for ORM-compliant display lifecycles.
In-Vehicle 5K Instrument Clusters in Premium EVs (Lucid, NIO) Accelerating Automotive Vertical
Lucid Air integrates three bonded 5K TFT modules behind curved glass, delivering 288 ppi at 600 nits sustained. NIO’s ET9 stretches a ribbon display across the dash that retains 5K pixel width but varies height, producing a panoramic cockpit with native 98% DCI-P3. Tier-1 suppliers such as Continental will run an oxide cluster line in Nuremberg from Q1 2025, ensuring local supply for European OEMs. The design imperative is clear fonts and ADAS icons at 50 centimeters driver eye-point, making 5K the functional floor for next-generation dashboards.
Restraints Impact Analysis of 5k Display Resolution Market*
| Restraint | (~) % Impact on CAGR Forecast | Geographic Relevance | Impact Timeline |
|---|---|---|---|
| High BOM cost of mini-LED backlights | -2.2% | Global | Short term (≤ 2 years) |
| Low penetration of 5K CDN outside Tier-1 cities | -1.9% | India, Latin America | Medium term (2-4 years) |
| Color-calibration complexity vs 4K | -1.8% | North America, Europe | Short term (≤ 2 years) |
| Substitution threat from 6K/8K cinematography gear | -1.7% | United States, Europe | Medium term (2-4 years) |
| Source: Mordor Intelligence | |||
High BOM Cost of Mini-LED Backlights in 5K Panels Limiting Mainstream Monitor ASPs
A 32-inch 5K screen needs 2,048 dimming zones versus 1,152 zones on 4K, holding backlight costs at USD 120 above comparable 4K until secondary lens efficiency hits 92%. ODM quotes suggest the delta may not fall below USD 65 until 2026, delaying prosumer price points below USD 799. Value-oriented buyers consequently stick with wide-gamut 4K, tempering near-term unit growth.
Low Penetration of 5K Content Delivery Networks Outside Tier-1 Cities
OTT platforms in India and Brazil seldom deliver mezzanine files above 4K due to edge node limitations. The absence of 5K streams undermines perceived benefit for residential buyers. CDN upgrades scheduled for 2027 leave a medium-term adoption gap that stalls mainstream penetration in high-population regions.
*Our forecasts treat driver/restraint impacts as directional, not additive. The impact forecasts reflect baseline growth, mix effects, and variable interactions.
5k Display Resolution Market Segment Analysis
By Product Type:
Monitors Dominate, Laptops AccelerateThe monitor segment generated 41.27% of 2025 revenue, translating to USD 243.5 billion of the 5k display resolution market. Shipments concentrate in 31.5-inch 5,120 × 2,880 IPS panels bundled with HDR-600 certification. Panel makers leverage matured oxide yields, pushing gross margins to 19% on monitor-class glass. Retail ASPs declined 11% in 2024, broadening appeal among freelance editors and colorists. By contrast, the laptop cohort lags in native 5K penetration, but 14-inch 5,120 × 3,200 OLED panels announced for Q3 2025 shipping insert 5K into mobile creator workflows at under 2 kilograms carry weight.
Laptop and tablet demand will pace at 26.4% CAGR through 2031, the highest across product types. OLED’s inherent emissive contrast masks the absence of local dimming on thin-and-light form factors, satisfying HDR specifications without bulkier backlight arrays. Bundled DisplayPort 2.1 alternate-mode USB-C ports guarantee single-cable connections to external 5K reference monitors. This synergy ensures laptops act as both source and companion display, doubling the counted 5K pixel footprint per purchase.



By Panel Technology:
LCD Retains Share, Mini-LED Drives ValueLCD in-plane switching (IPS) and vertical alignment (VA) commanded 62.88% revenue share in 2025. Mature substrate sizes, well-understood polarizer stacks and volume economies keep LCD the anchor segment of the 5k display resolution market. Cost efficiencies will help LCD retain a majority unit share through 2028 even as OLED and mini-LED raise blended ASPs.
Mini-LED / micro-LED, while only 9.48% of 2025 units, accounts for an outsized revenue mix due to ASP premiums that exceed LCD by 2.1×. Segment forecasts point to a 28.9% CAGR, aided by converging costs on large-area mini-LED backlights. Apple, BOE and LG collectively added 35,000 mini-LED bonding heads in 2024, providing the throughput to double output by 2026. The 5k display resolution industry thus leans on hybrid LCD-mini-LED designs for immediate performance gains while true emissive micro-LED matures for volume.
By Native Resolution:
16:9 Takes Volume, Ultra-Wide Spurs GrowthThe 5,120 × 2,880 16:9 format accounted for 47.86% of 2025 shipments and 43.55% of the 5k display resolution market size for native resolution classes. Its pixel density aligns with established color-grading UI layouts and repurposes existing 27-inch 16:9 chassis tooling. Studio buyers view the format as a drop-in swap for 4K with minimal furniture reconfiguration.
Ultra-wide 5,120 × 1,440 panels spark the highest growth at 28.1% CAGR, driven by command-and-control and immersive sim setups. A single curved 34-inch panel replaces dual 16:9 monitors, clearing desk depth and cable clutter. Intel’s Thunderbolt 5 asymmetric link distributes triple 5K ultra-wide streams from one docking station, cutting enterprise hardware footprints and dovetailing with carbon-neutral workplace mandates.
By End-User Application:
Creators Lead, Automotive SurgesProfessional content creation delivered 38.25% of spending in 2025, equal to USD 225.7 billion and 4.5 million monitor units. Studios value 99% DCI-P3 coverage, factory Delta-E < 1.0 and native 10-bit panels. Vendor-supplied colorimeters with true-wing spectral correction minimize recalibration downtime, translating to clear ROI in post-production suites.
Automotive cockpit displays are the fastest growing application at 31.6% CAGR. The 5k display resolution market share for automotive clusters hit 7.34% in 2025 yet commands a disproportionate ASP because OEMs absorb USD 650 per unit for driver ICs, cover glass, bonding and ruggedization. Regulatory pressure for advanced driver-assistance visualization maps to higher pixel count per degree of arc, an attribute 5K meets while preserving dashboard real estate.
By Distribution Channel:
Pro-AV Integrators Dominate, Online ScalesOffline retail and pro-AV system integrators accounted for 53.92% of 2025 shipments. Color-critical buyers prefer on-site calibration services and bespoke mounting, which brick-and-mortar integrators bundle with extended warranties. Education and healthcare transactions also route through tender-based integrators requiring compliance certifications.
Online direct-to-consumer marketplaces will expand at 23.4% CAGR as self-calibrating OLED notebooks seed mass familiarity with 5K. Vendor storefronts such as Dell.com and LG.com now offer pickup-and-return service levels previously restricted to channel resellers. The convergence of remote work and creator monetization funnels require-and-return policies into global e-commerce, lifting confidence for four-figure monitor purchases sight unseen.
Geography Analysis
APAC 5k Display Resolution Market
Asia-Pacific generated 35.98% of 2025 spending, equal to USD 212.3 billion and 6.4 million units. Creator laptop launches in China and panel self-sufficiency initiatives in Beijing and Hefei concentrate supply chains in the region. Korea’s content export boom amplifies workstation upgrades, further cementing Asia-Pacific’s role as both supply hub and demand driver.
North America 5k Display Resolution Market
North America ranked second at 28.05% of 2025 revenue, led by Hollywood studios, AAA game developers and medical device OEMs. The 5k display resolution market size for North America monitors alone is projected to climb from USD 118.4 billion in 2025 to USD 355.9 billion by 2031 at a 20.1% CAGR. Federal investment allowances covering accelerated depreciation on medical capital equipment speed hospital adoption of 5K surgical monitors.
Europe 5k Display Resolution Market
Europe contributed 21.72% of 2025 outlays, underpinned by Germany’s precision manufacturing culture and the United Kingdom’s broadcast technology sector. Automotive cockpit wins at BMW and Mercedes-Benz place long-dated contracts on local Tier-1 suppliers. EU energy regulations incentivize oxide TFT backplanes that reduce standby power, prompting widescale replacement of legacy 4K control-room arrays with 5K equivalents by 2028.

Competitive Landscape
Apple, Dell Technologies, LG Electronics, Samsung Electronics and BOE Technology form the top tier, collectively supplying 58% of 2024 unit shipments. Apple’s Studio Display shipments reached 1.3 million units, bundling 5K retina resolution with built-in A13 processing for camera and audio offload. Dell leverages Oxide TFT supply contracts with LG Display to maintain channel leadership in enterprise monitors.
Second-tier competitors—HP, ASUS, MSI and ViewSonic—focus on gamer-oriented 5,120 × 1,440 ultra-wide panels with 240 Hz refresh, differentiating through over-drive latency and factory overclock warranties. Niche leaders like EIZO and Barco dominate medical, where IEC 60601 compliance and laminated anti-glare coatings command 50% ASP premiums.
Panel fabs continue horizontal expansion to capture more of the value chain. BOE activated a Gen 8.6 oxide line in Anhui for 34-inch ultra-wide panels, while AUO invested in in-house mini-LED driver ICs. Samsung Display pivots away from LCD fab closures toward hybrid QD-OLED roadmaps that hit 5K resolution at 240 Hz by 2026. Competitive dynamics will tighten as micro-LED transfer yields improve, prompting top players to lock in glass substrates for five-year spans to avoid supply shocks.
5k Display Resolution Industry Leaders
Dell Technologies
Sony Group Corp.
LG Electronics Inc.
Samsung Electronics Co. Ltd.
Koninklijke Philips N.V.
- *Disclaimer: Major Players sorted in no particular order
5k Display Resolution Market Companies Covered in this Report
- Apple Inc.
- Dell Technologies
- HP Inc.
- LG Electronics Inc.
- Samsung Electronics Co. Ltd.
- Sony Group Corp.
- Koninklijke Philips N.V.
- ASUSTeK Computer Inc.
- Micro-Star International Co. Ltd.
- Red Digital Cinema LLC
- Canon Inc.
- Sharp Corp.
- ViewSonic Corp.
- BOE Technology Group Co. Ltd.
- AU Optronics Corp.
- TCL CSOT
- BenQ Corp.
- EIZO Corp.
- Panasonic Holdings Corp.
- Vizio Holding Corp.

Market Opportunities and Future Outlook
Opportunities in 5K are concentrating where a single, contiguous canvas reduces workflow friction, and where connectivity has caught up with pixel throughput. Content creation continues to pull through 5,120 × 2,880 reference-class monitors for AI-assisted HDR grading and node-based compositing, where a single-screen 14.7 million-pixel workspace is a practical fit. The report also notes measurable time savings when teams replace dual 4K setups with one 5K panel.
Enterprise docking and desk consolidation are adding further whitespace. The study flags pro-AV integrators and OEMs using DisplayPort 2.1 and Thunderbolt 5 to support high-refresh 5K over simpler cabling, which can reduce GPU rack counts in control rooms and increase overall workstation density. Another visible gap is in premium tiers where vendors are already shipping adjacent higher-than-5K displays, creating a clearer upgrade ladder for 5K and 5K2K SKUs across gaming and productivity lines. In 2026, Dell expanded UltraSharp with a 6K Thunderbolt hub monitor, while Samsung launched an Odyssey model positioned at 6K and also broadened its monitor lineup with 5K offerings, reinforcing that flagship panel and interface roadmaps are moving past 4K. On the panel side, LG Display’s 2026 work on a 27-inch 5K tandem WOLED prototype (220 PPI) points to ongoing stack innovation aimed at higher brightness and color performance without mini-LED BOM penalties, supporting thinner creator laptop designs and medical-grade monitors that need high pixel density and stable color calibration over long service cycles.
Recent Industry Developments in 5k Display Resolution Market
- June 2026: Alienware, part of Dell Technologies, announced the AW3926QW, a 39-inch 5K2K OLED gaming monitor at Computex 2026. The launch expands 5K2K options into premium gaming formats where high-refresh performance and creator-grade screen real estate overlap.
- May 2026: Samsung Electronics announced global availability of the 27-inch ViewFinity S8 (S80HF) monitor featuring 5K resolution. This broadens 5K penetration into mainstream productivity and enterprise purchasing cycles through a widely distributed monitor family.
- December 2024: Dell unveiled the UltraSharp 40 Curved 5K2K monitor with DisplayPort 2.1, targeting trading floors and post-production suites. The inclusion of DisplayPort 2.1 supports higher-bandwidth single-cable workflows that make large-format 5K2K deployments easier for pro-AV and enterprise IT teams to standardize.


5k Display Resolution Market Report Scope and Research Methodology
Market Definition and Coverage
For this study, the market covers revenues linked to display panels and finished display devices that natively support 5K-class resolution and are sold for consumer, commercial, and professional use across major regions.
Scope exclusions: We exclude content services, GPUs and other computing hardware, and software tools, even if they enable 5K output.
Segments Covered in This Report
- By Product Type
- Monitors
- Televisions
- Cameras and Digital Cinema
- Laptops and Tablets
- Smartphones
- Projectors and Others
- By Panel Technology
- LCD (IPS, VA)
- OLED
- Mini-LED / Micro-LED
- By Native Resolution
- 5120 × 2880 (16:9)
- 5120 × 3200 (16:10)
- 5120 × 1440 (21:9)
- By End-user Application
- Professional Content Creation
- Commercial Digital Signage and Control Rooms
- Consumer Gaming and Entertainment
- Education and Training
- Healthcare Imaging
- Automotive Cockpit Displays
- By Distribution Channel
- Online (Direct, Marketplaces)
- Offline (Retail, Pro-AV System Integrators)
- By Geography
- North America
- United States
- Canada
- Mexico
- South America
- Brazil
- Argentina
- Rest of South America
- Europe
- Germany
- United Kingdom
- France
- Italy
- Spain
- Rest of Europe
- Asia-Pacific
- China
- Japan
- South Korea
- India
- Australia
- New Zealand
- Rest of Asia-Pacific
- Middle East and Africa
- United Arab Emirates
- Saudi Arabia
- South Africa
- Rest of Middle East and Africa
- North America
Data Sources, Market Sizing, and Validation
Desk Research
Desk research started with mapping demand signals and supply capacity for high-resolution displays, then checking how quickly 5K is being adopted in key use cases such as creative workstations and premium monitors. Public sources, such as US Census trade statistics, UN Comtrade, OECD indicators, and ITU telecom and broadband datasets, helped us understand import flows and device penetration context, along with macro conditions that influence upgrade cycles.
To keep assumptions realistic, we also reviewed standards and interface readiness from bodies such as VESA (for display interface guidance) and IEC publications for display and energy-related testing references, along with company filings, investor decks, and credible press coverage on panel capacity adds and technology shifts. Where needed, paid subscriptions for company financials and intelligence, news and financials, and patent databases were used to support timelines and cross-check manufacturer focus areas. The desk sources listed here are illustrative, and other public materials were used for data collection, validation, and clarification.
Primary Interviews and Surveys
Primary work focused on interviews and structured surveys with display ecosystem participants across panel supply, device brands, channel partners, and large-volume buyers, since pricing and shipment mix can change quickly in this market. We used these inputs to confirm the split between native 5K products and nearby 4K and 6K offerings, and to pressure-test assumptions on average selling prices, refresh rates, and replacement cycles across regions.
Distribution of primary research fieldwork respondents
| Company type | Respondent position | Region |
|---|---|---|
| Top tier: 36% | CXOs: 17% | APAC: 39% |
| Mid tier: 47% | Functional/Unit leaders: 28% | EMEA: 37% |
| Smaller Players: 17% | Managers: 55% | Americas: 24% |
Market-Sizing & Forecasting
Sizing follows a combined top-down and bottom-up logic, where the demand pool is reconstructed from display shipments and installed-base replacement patterns, then filtered to the share that is natively 5K. A top-down pass was built using regional device volume indicators and trade and production signals, which were then converted into value using average selling price ranges validated through channel checks. Results were corroborated with selective bottom-up approximations, including sampled model-level price bands and volume cues from key end-use cohorts, before totals were adjusted.
Key inputs that shaped the model included the mix shift toward larger screen sizes, panel technology transitions that influence 5K feasibility (such as higher-end LCD and OLED adoption), interface and bandwidth readiness (for example, newer display connectivity standards that support higher refresh at 5K), price erosion curves for premium monitors, and the pace of professional content creation and design workstation upgrades. When primary inputs were missing for smaller geographies, gaps were handled by using proxy adoption ratios from similar markets, then rechecking with distributor and buyer feedback.
For forecasting, scenario analysis was used to reflect different upgrade-speed paths tied to panel cost-down timing, macro demand softness, and enterprise refresh budgets. A final outlook was set after reconciling these scenarios with expert expectations on pricing, supply availability, and near-term launch cadence.
Data Validation & Update Cycle
Model outputs were validated through multiple checks, including comparing implied shipments, pricing, and regional shares against independent signals from trade flows, capacity announcements, and channel commentary. When a variance looked too large, assumptions were revisited, and follow-up calls were triggered to confirm whether the gap came from scope, timing, or a one-off pricing effect.
Before sign-off, the dataset and calculations go through a multi-step analyst review so arithmetic errors, double counting, and unrealistic growth jumps are removed. Reports are refreshed annually, and interim updates are made when material events occur, such as major panel capacity changes or sharp price movements. Before delivery, an analyst performs a fresh pass so clients receive the latest updated view.
Mordor Intelligence's 5k Display Resolution Market Sizing Compared With Other Published Estimates
Published values for 5K display resolution often vary because each publisher makes different choices on what qualifies as 5K, which products are counted, and whether the number reflects panels only or includes full device revenue. Differences also show up when one estimate uses an older price deck or applies aggressive adoption curves during early product cycles.
The largest gap drivers usually come from scope and pricing logic, where some estimates fold in adjacent high-resolution categories or count 5K-capable output even when the native panel is not 5K. Another common spread comes from how average selling prices are stepped down over time, since premium monitor pricing can fall quickly once supply expands, and from currency timing and refresh cadence when converting multi-region sales into USD.
Benchmark comparison
| Source | Market Size | Gaps in Research Methodology |
|---|---|---|
| Mordor Intelligence | USD 0.71 T (2026) | |
| Global Consultancy A | USD 14.31 B (2023) | Uses a narrower device-centric view that appears to emphasize end-product sales only, and it is anchored to an earlier base year where 5K penetration and pricing were still premium-heavy. |
| Industry Publisher B | USD 2.88 B (2025) | Likely applies a tight definition focused on a small set of monitor categories, with limited transparency on how 5K is separated from 4K and 6K models and how ASP erosion is modeled. |
The table shows that most of the spread can be explained by what gets counted and how fast prices are assumed to normalize as volumes grow. When native-resolution rules and the panel versus finished-device boundary are applied consistently, the result stays traceable to shipments, price bands, and adoption checks, a modeling choice applied by Mordor Intelligence.


Key Questions Answered in the Report
What is the current size of the 5K display market?
The 5k display resolution market size reached USD 0.71 trillion in 2026 and is projected to hit USD 1.77 trillion by 2031.
Which product category holds the largest share?
Monitors led with 41.27% revenue share in 2025 thanks to studio, gaming and corporate refresh cycles.
Which application segment is growing fastest?
Automotive cockpit displays are forecast to expand at a 31.6% CAGR between 2026 and 2031.
Why are airports adopting ultra-wide 5K signage?
A single 5,120 × 1,440 panel matches radar UI geometry, removes bezel breaks and reduces GPU racks, improving control-tower ergonomics.
What technology change unlocks dual 5K over one cable?
Thunderbolt 5 and DisplayPort 2.1 chipsets deliver 80-120 Gbps bandwidth, enabling dual 5K 240 Hz displays without active cables.
How do mini-LED costs impact adoption?
High zone counts keep backlights USD 120 above 4K equivalents, stalling mainstream monitor ASPs under USD 799 until 2026.
Page last updated on:





