
M-Commerce Market Size and Share
Market Overview
| Study Period | 2020 - 2031 |
|---|---|
| Market Size (2026) | USD 2.82 Trillion |
| Market Size (2031) | USD 4.16 Trillion |
| Growth Rate (2026 - 2031) | 8.09% CAGR |
| Fastest Growing Market | Asia Pacific |
| Largest Market | North America |
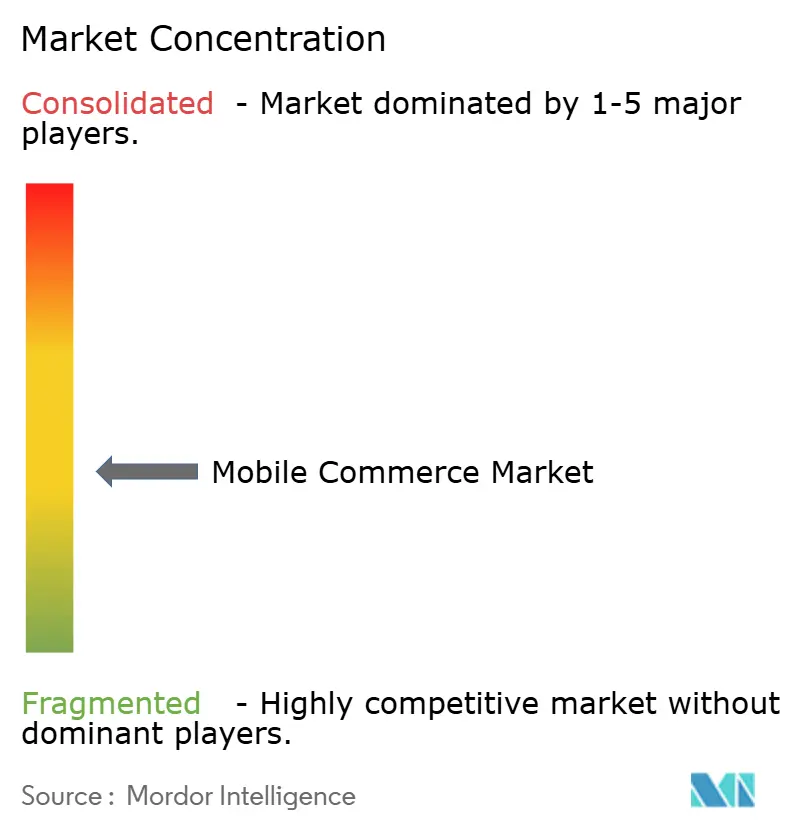
| Market Concentration | Medium |
Major Players *Disclaimer: Major Players sorted in no particular order Image © Mordor Intelligence. Reuse requires attribution under CC BY 4.0. | |
M-Commerce Market Analysis by Mordor Intelligence
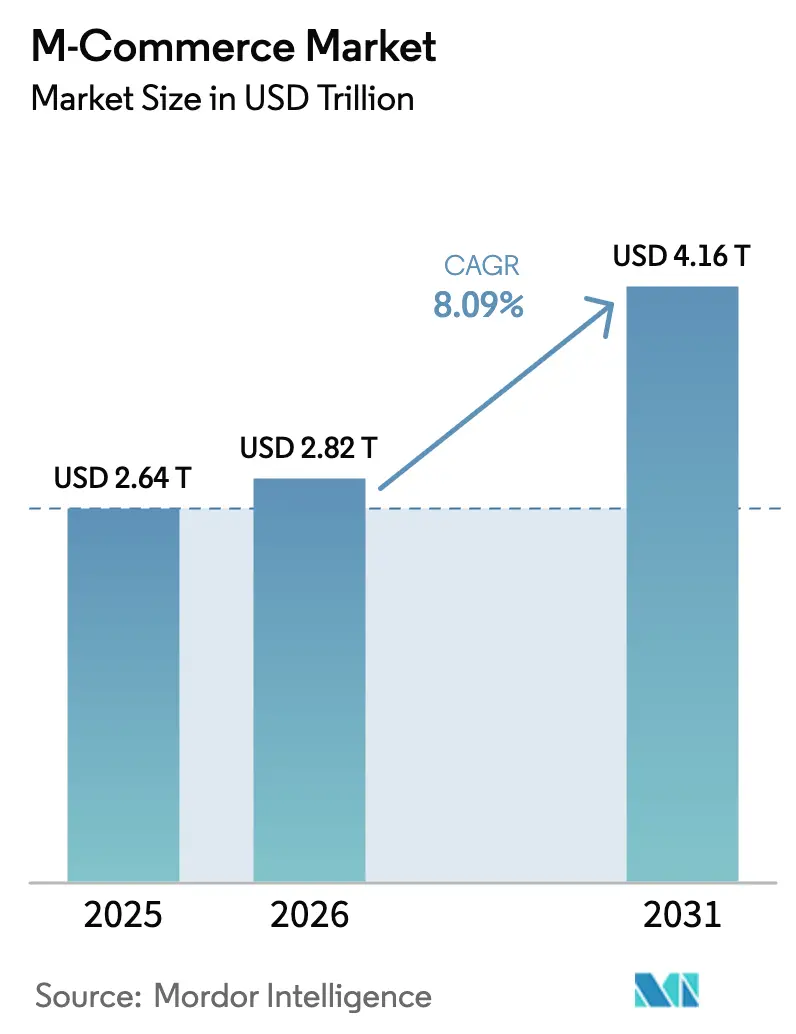
The M-Commerce Market size is projected to expand from USD 2.64 trillion in 2025 and USD 2.82 trillion in 2026 to USD 4.16 trillion by 2031, registering a CAGR of 8.09% between 2026 and 2031. Continued smartphone penetration above 80% of the global population and rapid 5G coverage have shortened app-load times, enabled richer video and augmented-reality displays, and pushed the mobile commerce market well past the growth rate of desktop channels. North America retained volume leadership in 2025, yet Asia-Pacific now powers incremental gains as super-apps in China and India integrate payments, commerce, and micro-lending into unified interfaces that pull users deeper into the m-commerce market. Contactless payments already account for two-thirds of face-to-face card transactions in mature economies, and rising wearable adoption signals an impending shift toward device-agnostic checkout that could compress the physical-card addressable base by 2028. Competitive convergence among platform operators, telecom carriers, and card networks is intensifying investment in tokenization, embedded finance, and satellite connectivity, each of which expands the surface area of the m-commerce market while raising the stakes on data security and regulatory alignment.
Key Report Takeaways
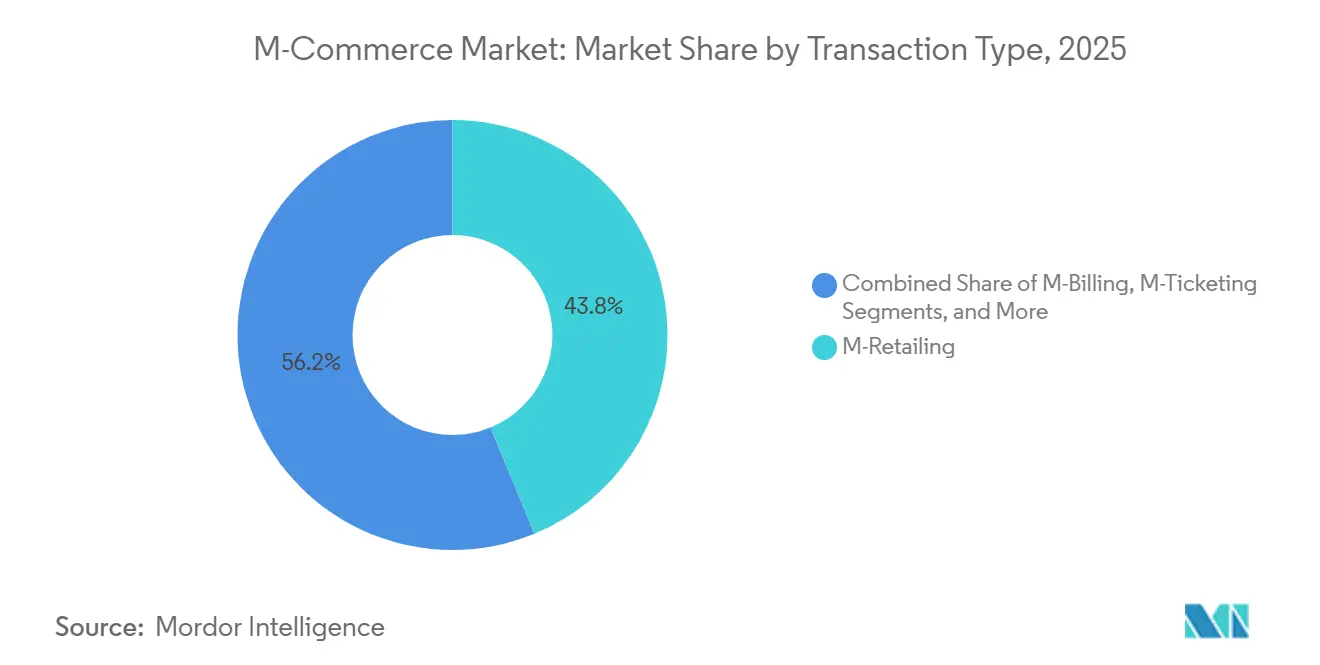
- By transaction type, m-retailing held 43.78% revenue share in 2025, whereas m-billing is forecast to advance at a 9.32% CAGR through 2031.
- By payment mode, mobile web payments commanded 38.51% of 2025 turnover, while NFC contactless transactions are set to record a 10.88% CAGR through 2031.
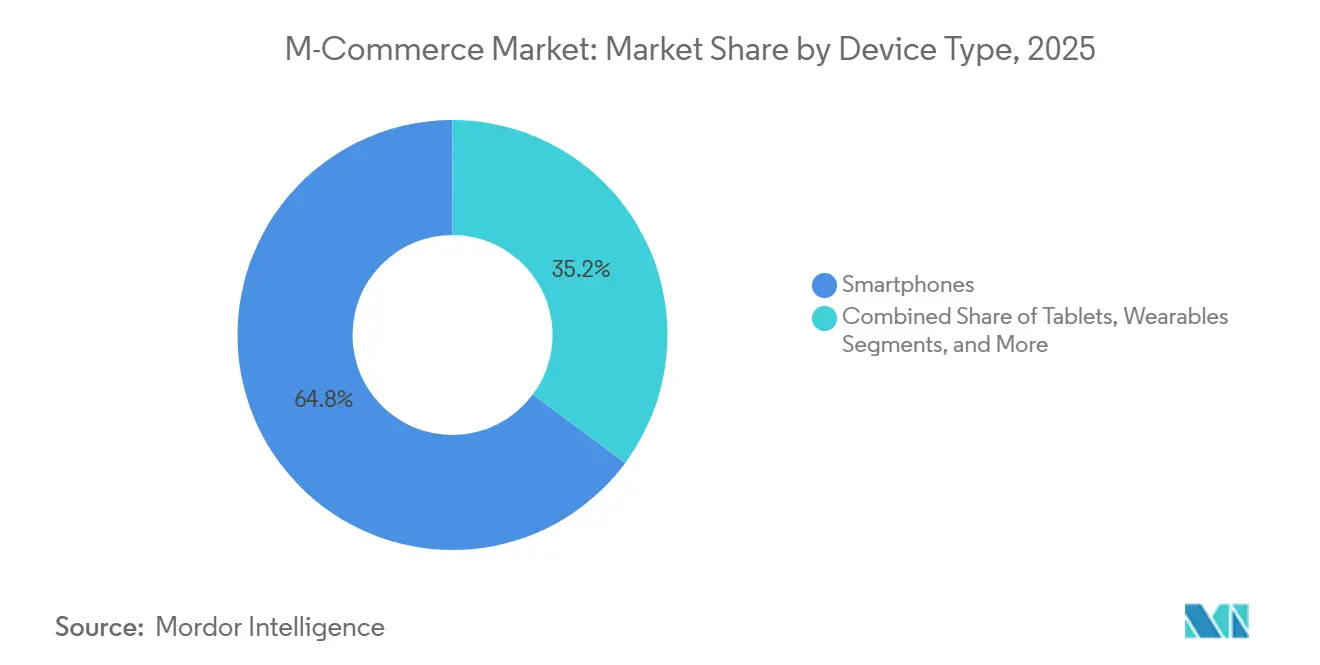
- By device type, smartphones captured 64.84% of 2025 activity, whereas wearables are projected to expand at a 12.06% CAGR into 2031.
- By application, retail and e-commerce generated 49.33% of 2025 value, but media and entertainment is positioned for an 11.98% CAGR through 2031.
- By geography, North America accounted for 37.21% of global spend in 2025, while Asia-Pacific is expected to grow at a 12.84% CAGR to 2031.
Note: Market size and forecast figures in this report are generated using Mordor Intelligence’s proprietary estimation framework, updated with the latest available data and insights as of January 2026.
Global M-Commerce Market Trends and Insights
Drivers Impact Analysis*
| Driver | (~)% Impact on CAGR Forecast | Geographic Relevance | Impact Timeline |
|---|---|---|---|
| Rising Global Smartphone and Mobile-internet Penetration | +2.8% | Global, with acceleration in South Asia and sub-Saharan Africa | Medium term (2-4 years) |
| Seamless Mobile Wallets and One-click Checkout Adoption | +2.3% | North America, Europe, Asia-Pacific core markets | Short term (≤ 2 years) |
| 5G Rollout Enabling Richer In-app Experiences | +1.9% | North America, Europe, China, South Korea, Japan | Medium term (2-4 years) |
| Carrier Open-network APIs Lowering KYC/Checkout Friction | +1.2% | Europe (PSD2), India (UPI), Brazil (Open Finance) | Long term (≥ 4 years) |
| Satellite and Direct-to-device Coverage Unlocking Rural M-commerce | +0.9% | Sub-Saharan Africa, Latin America, rural Asia-Pacific | Long term (≥ 4 years) |
| Embedded Finance Inside Super-apps for Cross-border Micro-merchants | +1.1% | Asia-Pacific, spillover to Middle East and Africa | Medium term (2-4 years) |
| Source: Mordor Intelligence | |||
Rising Global Smartphone and Mobile-Internet Penetration
Smartphone subscriptions reached 6.8 billion in 2025, equal to 84% of the world’s population, yet growth is now concentrated in South Asia and sub-Saharan Africa, where entry-level Android handsets cost under USD 100. India alone added 120 million new users in 2025, driven by mobile-data tariffs of USD 0.09 per gigabyte, the lowest worldwide.[1]GSMA, “The Mobile Economy 2025,” gsma.com These first-time users bypass PCs and credit cards, installing wallets before opening bank accounts, pushing the mobile commerce market to leapfrog older e-commerce channels. As a result, m-commerce penetration in emerging regions is on track to overtake desktop share within three years. The demographic dividend positions super-apps to capture lifetime payment relationships long before traditional banks reach these segments.
Seamless Mobile Wallets and One-Click Checkout Adoption
Biometric one-tap authentication lowered cart abandonment by 35% in 2025 pilot programs, demonstrating that every extra field in a checkout form erodes conversion on small screens. Apple Pay and Google Pay processed a combined USD 1.2 trillion in 2025, up 28% year over year, as rotating token IDs curbed fraud and boosted merchant confidence. Wallet providers now gatekeep customer data, shifting bargaining power away from merchants who compete for in-wallet real estate rather than owning the checkout. European PSD2 rules accelerate this turn by forcing banks to open APIs so third-party apps can initiate account-to-account payments that bypass card rails. The trend anchors the m-commerce market to credential-on-file architectures that remove friction while raising the strategic value of identity verification.
5G Rollout Enabling Richer In-App Experiences
Commercial 5G networks covered 1.9 billion people by December 2025, delivering peak speeds above 1 Gb/s and latency below 10 ms. South Korea’s mobile commerce conversion rates jumped 22% post-launch as apps streamed high-definition product videos without buffering. Low-latency synchronization now keeps store inventory visible in real time, letting retailers promise 60-minute delivery in dense cities. Augmented-reality try-ons for apparel and cosmetics have moved from novelty to baseline expectation, and live-stream shopping events generate impulse buys that desktop formats rarely match. Operators with spectrum backlogs, however, risk missing this uplift as 5G capacity constraints surface in video-heavy shopping peaks.
Satellite and Direct-to-Device Coverage Unlocking Rural M-Commerce
AST SpaceMobile, Starlink and regional carriers launched direct-to-device pilots in 2025 that delivered reliable 4G-class bandwidth to areas where tower economics never penciled out.[2]AST SpaceMobile, “Commercial Service Launch,” astspacemobile.com Rural Kenya and Indonesia processed satellite-routed mobile money payments at a per-transaction cost of USD 0.15, matching urban agent fees. Roughly 1.7 billion unbanked adults live in coverage gaps the size of a continent, and satellite extensions give the m-commerce market its first credible path to reach them. Carriers expect breakeven traffic by 2027 if adoption follows early-pilot curves, suggesting that infrastructure bottlenecks rather than demand have capped rural digital-trade volumes. This connectivity lift could redraw competitive maps as fintechs with agent footprints pivot from SMS to full-stack smart-app offerings.
Restraints Impact Analysis*
| Restraint | (~)% Impact on CAGR Forecast | Geographic Relevance | Impact Timeline |
|---|---|---|---|
| Persistent Data-breach and Fraud Concerns | -1.6% | Global, elevated in North America and Europe | Short term (≤ 2 years) |
| Low Mobile-web UX Performance | -1.1% | Emerging markets with 3G/4G congestion; global for complex forms | Medium term (2-4 years) |
| Transaction Taxes on Mobile Money in Emerging Economies | -0.8% | Sub-Saharan Africa, Pakistan | Short term (≤ 2 years) |
| Spectrum-price Inflation Slowing 5G Build-outs | -0.7% | India, Southeast Asia, Latin America | Long term (≥ 4 years) |
| Source: Mordor Intelligence | |||
Persistent Data-Breach and Fraud Concerns
Mobile payment fraud climbed to USD 5.7 billion in 2025, an 18% annual rise accelerated by SIM-swap attacks and credential stuffing. High-profile processor breaches exposed 42 million accounts, causing 23% of affected users to reduce mobile payment frequency. Merchants spent USD 9.3 billion on authentication and chargeback tools, equal to 1.6% of gross merchandise value, which squeezes smaller sellers with thin margins. European Strong Customer Authentication cut fraud by 31% but lifted checkout drop-off by 8%, underscoring the tension between safety and convenience. Unless biometric and behavioral analytics scale quickly, apprehension over data misuse will temper the mobile commerce market’s upside.
Transaction Taxes on Mobile Money Services in Emerging Economies
Kenya’s July 2024 enactment of a 1.5% levy on mobile money transfers slashed transaction volumes by 18% within six months, a pattern repeated as Uganda and Tanzania imposed similar fees.[3]Central Bank of Kenya, “Mobile Payments Supervision Annual Report 2024,” centralbank.go.ke Users, especially low-income segments, reverted to cash to sidestep the cost, reversing financial-inclusion gains achieved since 2015. The m-commerce market’s success in Africa rests on micro-payments that average USD 10, making even sub-1% taxes regressive. Governments risk shrinking their own tax base as informal cash resurfaces and digital audit trails disappear. Policy stability, therefore, remains as pivotal as technology innovation for sustained adoption.
*Our forecasts treat driver/restraint impacts as directional, not additive. The impact forecasts reflect baseline growth, mix effects, and variable interactions.
Segment Analysis
By Transaction Type: M-billing Gains as Utilities Embed Payments
M-retailing accounted for 43.78% of 2025 revenue, confirming its role as the anchor of the m-commerce market share. However, m-billing is projected to post a 9.32% CAGR to 2031 as carriers and utilities embed charges directly in monthly statements, bypassing cards and KYC hurdles. This shift expands the m-commerce market by tapping consumers without credit limits or bank accounts. Direct carrier billing reached USD 18 billion in value during 2025 and is strong in Indonesia and the Philippines, where card penetration remains under 20%. Subscription brands such as Spotify and Netflix cut churn by 19% after adopting carrier billing in 27 markets, proving that lower payment friction raises lifetime value. Telecom operators are regaining ground ceded to card networks, leveraging pre-existing billing relationships to cement relevance.
The appeal of seamless integration has triggered adoption across gaming and on-demand video, where impulse purchases thrive on one-click flows. M-ticketing also benefits; airlines and railways save on paper tickets while monetizing upsells through QR-code boarding passes. Broader uptake will hinge on revenue-share negotiations between app publishers and carriers, but evidence from Southeast Asia suggests that carrier commissions below 10% can still unlock new addressable segments. Growth in peer-to-peer remittances further complements transaction diversity by funneling fresh liquidity into wallets that may later fund commerce purchases.



By Payment Mode: NFC Contactless Accelerates Post-Pandemic
Mobile web topped 38.51% in 2025, yet NFC contactless stands out as the fastest-rising option with a 10.88% forecast CAGR, reflecting merchant terminal upgrades and consumer preference for tap-to-pay hygiene. Apple Pay, Google Pay and Samsung Pay processed 89 billion NFC transactions in 2025, capitalizing on tokenized credentials that improve security. Where point-of-sale coverage exceeds 90% of terminals, NFC displaces both physical cards and QR codes, trimming checkout time to under two seconds. These gains expand the mobile commerce market size for in-person spending, traditionally dominated by cards.
Legacy methods such as WAP and premium SMS retreated 12% as feature phones fade. Conversely, direct carrier billing’s 23% expansion proves that simplicity sometimes rivals speed, as one click inside an app can beat even a two-second tap if no wallet or card is needed. Open-banking APIs in Europe and India now support account-to-account pushes, slicing interchange from 2% to 0.5% or lower. Long term, NFC and instant transfers will coexist, with tokenization and biometric identity anchoring both paths.
By Device Type: Wearables Surge on Convenience
Smartphones retained dominance at 64.84% of transaction value in 2025, but wearables are slated to grow 12.06% annually through 2031 on the back of biometric authorization built into watches and fitness bands. Apple Watch alone processed USD 41 billion that year, illustrating how tactile convenience can upend checkout habits. NFC-enabled watches have become essential in mass-transit systems where speed drives throughput, highlighting new use cases beyond retail.
Tablets, holding an 11% share, anchor business-to-business procurement and field sales that benefit from larger displays. Voice-enabled speakers and in-car infotainment systems processed USD 2.3 billion in 2025, revealing nascent but promising fronts for the mobile commerce industry. However, inconsistent merchant acceptance forces 68% of users initiating a transaction on secondary devices to complete payment on their phones. Standardized token management across form factors will be critical to realize fully seamless omnidevice commerce.
By End-User Application: Media and Entertainment Outpaces Retail
Retail and e-commerce captured 49.33% of 2025 expenditure, reflecting the sector’s maturity. Media and entertainment is forecast to compound at 11.98% through 2031 as streaming video, mobile gaming, and creator-economy marketplaces intensify recurring-revenue models. Spotify, Disney Plus and regional video platforms added 187 million mobile subscribers last year, driven by sub-USD 3 price tiers in India and Indonesia that align services with median consumer budgets. Mobile gaming surpassed console and PC revenue combined in 2025, hitting USD 116 billion, and depends heavily on small microtransactions that suit wallet flows.
Banking apps enrolled 94 million new customers in 2025, with digital-only institutions such as Revolut, Nubank and Chime tapping mobile’s always-on reach to expand deposit bases. Travel and hospitality bookings rose 13% as one-click embedded payments inside Airbnb and Booking.com streamlined reservations. Across categories, challengers designed for intermittent connectivity beat web-first incumbents, reinforcing why the m-commerce market rewards frictionless design.
Geography Analysis
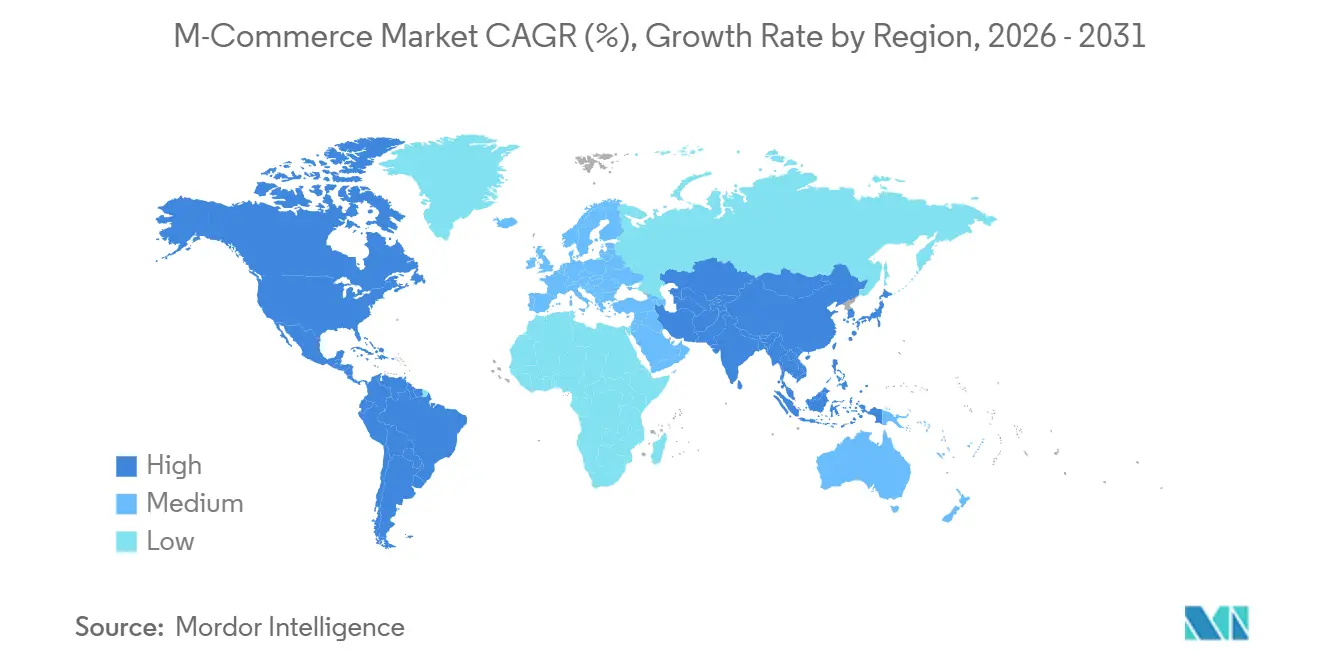
Asia-Pacific generated the fastest expansion in 2025, and its 12.84% forecast CAGR underscores how super-app ecosystems unlock both urban and rural demand. Alipay and WeChat Pay together processed USD 47 trillion, equaling 68% of China’s GDP and illustrating network effects intrinsic to the m-commerce market. India’s UPI cleared 13.4 billion monthly transactions by December 2025, integrating merchant QR labels that cost less than USD 2 to deploy and thus accelerating micro-merchant acceptance nationwide.[4]National Payments Corporation of India, “UPI Transaction Statistics,” npci.org.in Southeast Asian growth hinges on carrier billing and localized e-wallet battles among GrabPay, GoPay and Dana, each subsidizing onboarding with cash-back to capture early mindshare.
North America retained a 37.21% share in 2025, but growth now trails global averages as user penetration saturates and wallet providers pivot to value-added layers such as buy-now-pay-later. Regulation remains less prescriptive than in Europe, enabling experimentation with cryptocurrency settlement: Block’s Cash App added 8.3 million users after opening Bitcoin transfers in September 2025. Meanwhile, Canada’s Interac e-Transfer and the United States’ FedNow prepare to inject real-time account-to-account rails that could rewire card-heavy spend.
Europe contributed 22% of global value in 2025. United Kingdom shoppers lead contactless uptake with 65% of card volumes now tap-based, while continental merchants juggle 27 national interpretations of PSD2 that complicate wallet rollouts. Instant-payment systems such as Sweden’s Swish and the EU-wide SEPA Instant scheme help mitigate interchange fees, yet fragmentation slows cross-border harmonization.

Regulatory Landscape
M-commerce sits across overlapping payments, data, platform, and cross-border digital trade rules. In the European Union, the Digital Services Act (Regulation (EU) 2022/2065) and the Digital Markets Act (Regulation (EU) 2022/1925) raise compliance expectations for very large online platforms and designated gatekeepers, affecting app distribution, advertising, and in-app commerce flows. The European Commission published a DMA Review Report (COM(2026) 178 final) on 28 April 2026, and it released a second systemic-risk report for VLOPs/VLOSEs under the DSA on 2 July 2026. Together, these updates keep transparency, risk management, and platform conduct requirements in focus for how wallets, marketplaces, and super-apps manage onboarding, recommendations, and merchant access.
At the global trade layer, WTO members continued work on e-commerce disciplines. On 28 March 2026 at MC14 in Yaounde, Cameroon, 66 WTO members adopted a pathway for interim implementation of the WTO Agreement on Electronic Commerce while pursuing formal incorporation into the WTO legal framework. Separately, the WTO Work Programme on Electronic Commerce and the moratorium on customs duties on electronic transmissions lapsed on 30 March 2026, increasing uncertainty around whether some jurisdictions may introduce duties on cross-border digital goods and services sold via mobile channels. Regional initiatives such as ASEANs developing Digital Economy Framework Agreement (DEFA) add another coordination track for digital trade facilitation and interoperability, which raises the premium on multi-jurisdiction compliance operating models for global m-commerce players.
Value Chain Analysis
The m-commerce value chain starts with device and operating-system ecosystems (smartphones and wearables) and mobile connectivity (4G/5G coverage, and emerging satellite/direct-to-device pilots), which support in-app discovery, checkout, and authentication. Commerce enablement then runs through platforms and super-apps, identity and KYC layers, payment networks and rails (card tokenization, wallets, QR, NFC, account-to-account/instant payments, and direct carrier billing), and risk controls (fraud monitoring, SCA-style step-ups, behavioral analytics). Merchant-facing orchestration is increasingly API-led, with PSPs and unified-commerce providers connecting apps, web, and in-store acceptance while routing to local rails and managing settlement, disputes, and compliance.
Fulfillment and cross-border logistics sit downstream, but they still affect conversion and repeat purchase for mobile-first demand. Cross-border economics have become more sensitive to customs and duty processes, including changes such as the March 2026 elimination of the US de minimis exemption for goods under USD 800, which increases friction for low-value DTC parcels sold through mobile storefronts and social commerce. Operational bottlenecks also concentrate around drayage capacity, warehousing, and peak-season port throughput, reflected in 2026 inventory front-loading dynamics at major US ports. At the same time, sourcing diversification toward Vietnam, India, and Mexico is used to reduce single-country risk. In ASEAN, digital trade facilitation and supply chain integration efforts (traceability, secure digital infrastructure, and cross-border connectivity) support mobile-led commerce by improving shipment visibility and reducing manual processing across borders.
Competitive Landscape
Moderate concentration defines the ecosystem: the ten largest players processed roughly 58% of 2025 transaction volume, with Apple Pay and Google Pay anchoring operating-system lock-in while Alipay and WeChat Pay wield super-app gravity. Visa and Mastercard are redeploying capital toward tokenization; Visa filed 127 authentication patents in 2025, signaling a defensive play as real-time account-to-account rails erode interchange economics. Samsung Pay leverages hardware-software integration in Android-heavy regions, adding 78 country rollouts by June 2025 and chipping at Apple’s wearables first-mover edge.
Emerging fintechs target whitespace in gig-worker payouts, cross-border micro-commerce, and rural agent networks. Vodafone’s May 2025 M-Pesa launch in Ethiopia opened a 120 million-person market where only 12% hold bank accounts. Stripe and Adyen expand their unified-commerce APIs, which merge in-app, in-store, and subscription flows under a single merchant account, reducing settlement latency for global sellers. Satellite-powered processors such as Lynk Global's prototype direct-to-device terminals for agricultural collectives in South America prove that last-mile payment acceptance no longer requires fiber or tower infrastructure.
Regulatory frameworks continue to shape advantage. Europe’s PSD2 and India’s UPI impose interoperability mandates that curb winner-takes-all dynamics, forcing providers to out-compete on user experience rather than exclusive network effects. In response, incumbents double down on AI-driven personalization; Visa reported early adopters cut fraud 34% and upped conversion 19% in 2025. The race now hinges on who can balance privacy, personalization and fee compression without stalling growth.
M-Commerce Industry Leaders
Alphabet Inc. (Google Pay)
Amazon.com, Inc.
Apple Inc.
Airtel Africa plc (Airtel Money)
Blocks Inc. (Cash App)
- *Disclaimer: Major Players sorted in no particular order

Market Opportunities and Future Outlook
A major whitespace is emerging around AI-native checkout and agentic payments that reduce form-fill friction while retaining authentication and consent. In May 2026, Google introduced Universal Cart to aggregate shopping across Search, Gemini, YouTube, and Gmail, alongside an Agent Payments Protocol (AP2) designed for secure, user-authorized autonomous payments, pointing to agent-compatible payment authorization and token workflows. Alipay has also pushed AI-first payment infrastructure, citing that Alipay AI Pay exceeded 100 million users by February 2026 and launching AI Wallet and Token Pay in May 2026 to support subscription payments and token top-ups. This extends m-commerce beyond one-time retail into recurring and digital-goods monetization.
Another opportunity is merchant enablement that links wallet ecosystems to offline acceptance and SME settlement without adding point-of-sale complexity. Airtel Money integrating with Absa Bank Kenya in April 2026 to enable direct wallet-to-bank settlement for SMEs illustrates demand for simpler cashflow loops that connect mobile wallets to formal banking accounts. In parallel, Shopify began a global rollout of Checkout Intelligence 2.0 in July 2026, using AI to personalize checkout and address cart abandonment, reinforcing the shift toward first-party, platform-managed checkout stacks. Alongside ongoing spend on fraud and authentication, including merchants spending USD 9.3 billion on authentication and chargeback tools in 2025, these moves keep opportunities focused on interoperable identity, tokenization, and real-time risk decisioning that can be applied consistently across mobile web, apps, and emerging device types such as wearables.
Recent Industry Developments
- July 2026: Apple restored the ability for users in India to pay for App Store purchases and iCloud subscriptions using Visa and Mastercard credit and debit cards, aligning flows with Reserve Bank of India recurring payment and authentication requirements. The change reduces payment drop-offs for digital goods on iOS in a large mobile-first market and shows how local payments compliance can directly affect platform monetization.
- April 2026: Airtel Money integrated its mobile wallet with Absa Bank Kenya to enable direct wallet-to-bank settlement tailored to SMEs. The linkage strengthens merchant acceptance and payout usability for mobile money by connecting day-to-day wallet inflows to formal bank accounts, supporting broader m-commerce use beyond peer-to-peer transfers.
- March 2025: Airtel Mobile Commerce launched the Airtel Money GlobalPay Card, a virtual payment solution that connects users across 14 African countries to the Mastercard merchant network for online payments. By extending mobile money balances to open-loop card acceptance, the product expands cross-border and digital-goods purchasing options for underbanked users and increases wallet stickiness for everyday commerce.


Research Methodology Framework and Report Scope
Market Definition and Coverage
For this study, the m-commerce market is measured as the value of commercial transactions completed using mobile devices, where browsing, ordering, and payment are enabled through a mobile app, mobile web, or mobile wallet.
Scope exclusions: Desktop-only e-commerce purchases and offline cash-only retail sales are excluded, even if the shopper used a phone only for discovery.
Segmentation Overview
- By Transaction Type
- M-Retailing
- M-Ticketing/Booking
- M-Billing
- Other Transaction Types
- By Payment Mode
- Mobile Web Payments
- Near-Field Communication (NFC)
- Premium SMS
- Wireless Application Protocol (WAP)
- Direct Carrier Billing
- Other Payment Modes
- By Device Type
- Smartphones
- Tablets
- Wearables (Smartwatches/Bands)
- Other Connected Devices
- By End-User Application
- Retail and E-commerce Applications
- Banking and Financial Services
- Travel and Hospitality
- Media and Entertainment
- By Geography
- North America
- United States
- Canada
- Mexico
- South America
- Brazil
- Argentina
- Rest of South America
- Europe
- Germany
- United Kingdom
- France
- Italy
- Spain
- Rest of Europe
- Asia-Pacific
- China
- Japan
- India
- South Korea
- ASEAN
- Rest of Asia-Pacific
- Middle East
- Saudi Arabia
- United Arab Emirates
- Rest of Middle East
- Africa
- South Africa
- Nigeria
- Rest of Africa
- North America
Data Sources, Market Sizing, and Validation
Desk Research
Desk research is used to set the outer boundary of demand, then to anchor key inputs that can be checked over time. We mainly relied on public data series and explainers that clarify how mobile shopping and digital payments are reported, and how they move with device usage.
Common sources included ITU indicators on mobile and broadband access, World Bank and IMF macro series for consumption and inflation, and central bank or payments regulator releases on digital payment adoption. We also reviewed OECD or UNCTAD notes on digital trade and e-commerce trends. In addition, we reviewed company filings and investor presentations for directional KPIs, and we used reputable press coverage for policy and platform changes. For technology and capability shifts, we used a paid subscription for company financials and another for patent lookups. These examples are not exhaustive, and many other sources were reviewed for data collection, validation, and clarification.
Primary Interviews and Surveys
Primary interviews focused on validating how mobile-led checkout behavior is changing by region, and how payment friction, delivery expectations, and promotion intensity are affecting conversion. We spoke with mobile-first merchants, payment and wallet ecosystem participants, logistics-facing practitioners, and digital commerce consultants across major consuming regions, so that gaps from desk research could be filled and assumptions could be pressure-tested against current operating constraints.
Distribution of primary research fieldwork respondents
| Company type | Respondent position | Region |
|---|---|---|
| Top tier: 37% | CXOs: 16% | APAC: 42% |
| Mid tier: 46% | Functional/Unit leaders: 40% | EMEA: 34% |
| Smaller Players: 17% | Managers: 44% | Americas: 24% |
Market-Sizing & Forecasting
Sizing starts with a top-down build that reconstructs mobile commerce value from mobile internet and smartphone usage, digital payment penetration, and online purchase frequency, then adjusts using regional and category-level signals. After shaping the demand pool, we run selective bottom-up checks using sampled merchant GMV splits, observed mobile share of online orders, and average selling prices combined with estimated transaction volumes. Totals are only tuned when multiple checks point in the same direction.
Inputs that matter most in this market include smartphone and mobile broadband penetration, share of e-commerce orders completed on mobile, wallet and card usage mix, average order value by retail-heavy categories, and logistics constraints that influence cart abandonment and repeat purchase. Where data is sparse for smaller countries, we apply proxy indicators, for example using close peer markets with similar device and payments profiles, and then validate those proxies in interviews before final inclusion.
For forecasting, we used scenario analysis supported by a light multivariate regression on historical adoption and spending drivers. Assumptions were finalized after aligning them with expert views on mobile checkout UX, payments regulation, and cross-border purchase behavior.
Data Validation & Update Cycle
Model outputs are triangulated against independent signals, including mobile share of e-commerce activity, digital payments growth, and macro consumption trends, then reviewed for outliers at the region and year level. When a variance cannot be explained by known drivers, such as a policy shift, a major wallet fee change, or a sudden inflation move, we trigger follow-up calls and rework the relevant assumption.
A multi-step review is completed before sign-off, including checks on calculations, unit consistency, and currency conversions. This is followed by an internal sense-check against recent events. Reports are refreshed annually, with interim updates when material changes occur, and a final pre-delivery pass is done so clients receive the latest updated view.
Mordor Intelligence's M Commerce Market Sizing Compared With Other Published Estimates
Published m-commerce numbers often differ because analysts do not always treat timing, currency conversion, and blended pricing logic the same way, even when the market label sounds identical. The spread also increases when one study reports transaction value while another leans toward a narrower set of mobile purchase flows.
Here, refresh cadence and currency timing are handled with a consistent annual conversion window, plus periodic checks on mobile share and order-value movement. Those adjustments are applied to the modeled demand pool before finalizing the estimate at Mordor Intelligence.
Benchmark comparison
| Source | Market Size | Gaps in Research Methodology |
|---|---|---|
| Mordor Intelligence | USD 2.64 T (2025) | |
| Global Consultancy A | USD 2.24 T (2025) | Uses a tighter interpretation of mobile commerce that can undercount mobile web checkouts and adjacent transaction types, and it may apply conservative mobile share assumptions in markets where wallet adoption is rising quickly. |
| Industry Publisher B | USD 2.30 T (2025) | Projects growth using a higher long-range CAGR and broader user coverage, which can lift totals if feature-phone commerce and non-retail transaction categories are blended without consistent ASP and currency-year alignment. |
Across the three figures, the main differences come from what is counted as a mobile transaction, how mobile share is updated as behavior shifts, and how currency timing is applied to multi-region totals. By keeping the sizing steps tied to observable adoption and spending signals, the final number stays explainable and repeatable, even when inputs are refreshed year to year.


Key Questions Answered in the Report
How large is the m-commerce market in 2026?
It reaches USD 2.82 trillion in 2026, with an 8.09% CAGR projected through 2031.
Which region will contribute most to future growth?
Asia-Pacific, supported by China’s super-apps and India’s UPI, is forecast at a 12.84% CAGR to 2031.
What payment mode is expanding fastest?
NFC contactless transactions lead with a 10.88% CAGR as tap-to-pay gains global acceptance.
Why is m-billing gaining momentum?
Direct carrier billing bypasses cards, cutting friction and driving a 9.32% CAGR in utilities and content subscriptions.
How are wearables influencing transactions?
Smartwatches enable wrist-tap biometric payments, pushing wearables to a 12.06% CAGR through 2031.
What key threat could slow adoption?
Rising fraud and data breaches, which totaled USD 5.7 billion in 2025, continue to weigh on consumer trust.
Page last updated on:






