Market Overview
| Study Period | 2020 - 2031 |
|---|---|
| Forecast Data Period | 2026 - 2031 |
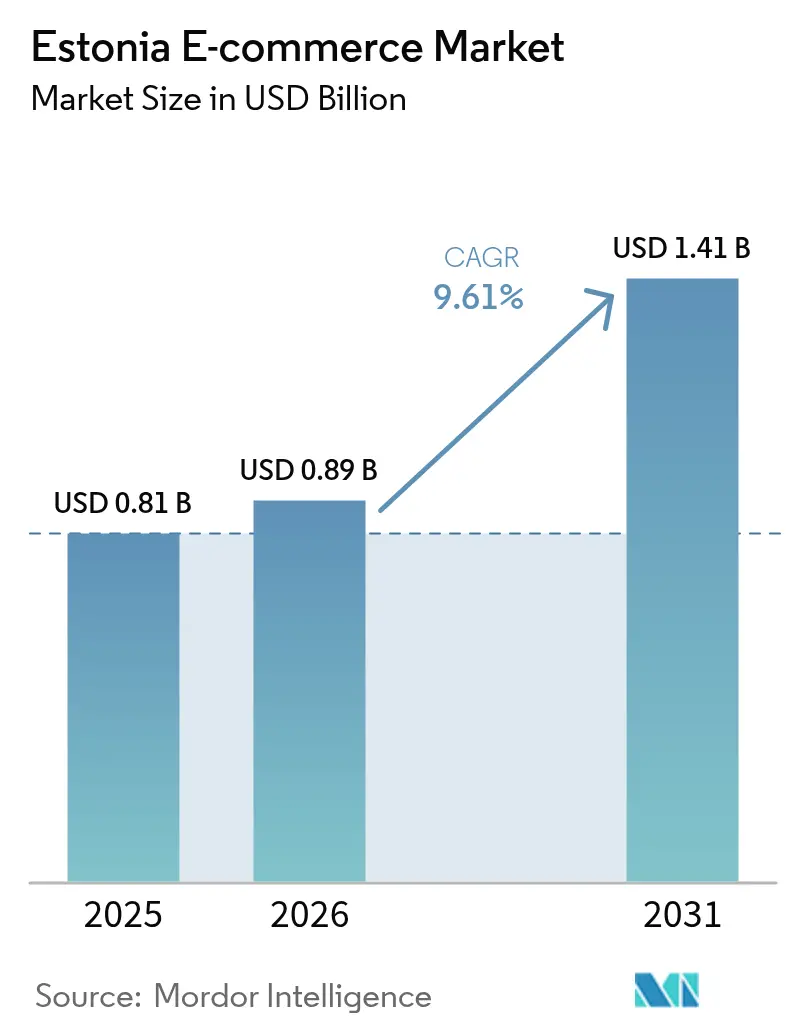
| Base Year Market Size (2025) | USD 0.81 Billion |
| Market Size (2026) | USD 0.89 Billion |
| Market Size (2031) | USD 1.41 Billion |
| Growth Rate (2026 - 2031) | 9.61% CAGR |
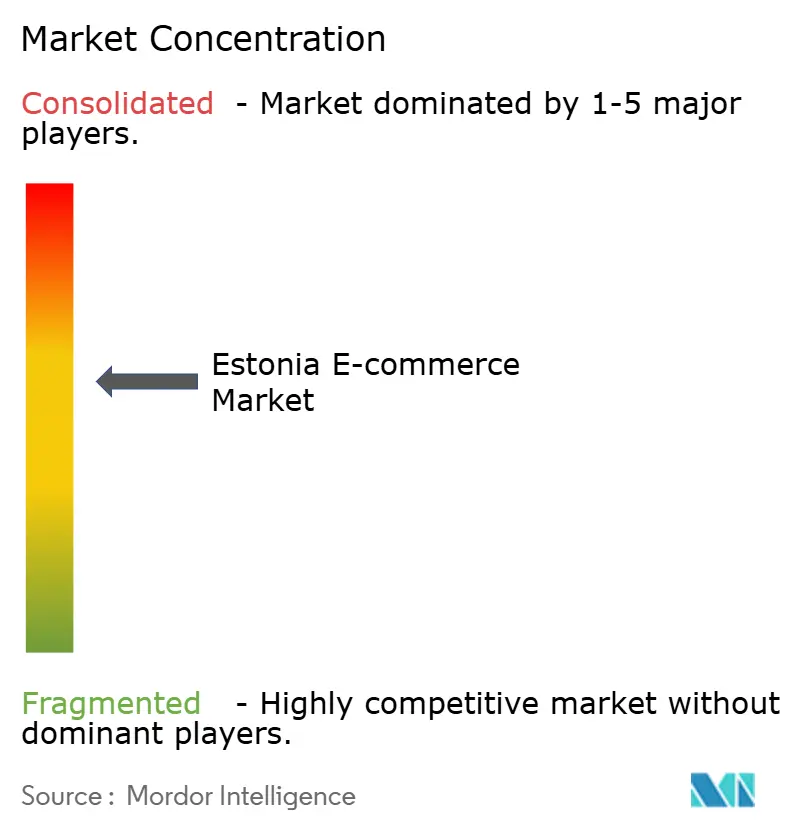
| Market Concentration | Medium |
Major Players *Disclaimer: Major Players sorted in no particular order Image © Mordor Intelligence. Reuse requires attribution under CC BY 4.0. | |
Estonia E-commerce Market Analysis by Mordor Intelligence
Estonia e-commerce market size in 2026 is estimated at USD 887.84 million, growing from 2025 value of USD 0.81 billion with 2031 projections showing USD 1.41 billion, growing at 9.61% CAGR over 2026-2031. The Estonia e-commerce market has been shaped by a combination of advanced digital ID penetration, an export-oriented tech sector, and proximity to Nordic trade routes, allowing domestic and cross-border sellers to scale without heavy fixed-asset commitments. Local retailers have adopted parcel-locker logistics to cut last-mile costs, while international platforms leverage the e-Residency framework to open EU storefronts with minimal red tape. Fintech partnerships are enabling new payment flows that balance Estonia’s traditional bank-link habit with rising demand for Buy Now Pay Later services. On the supply side, warehouse capacity remains the main bottleneck, yet investments in automation and AI-driven demand planning are steadily easing the constraint.
Key Report Takeaways
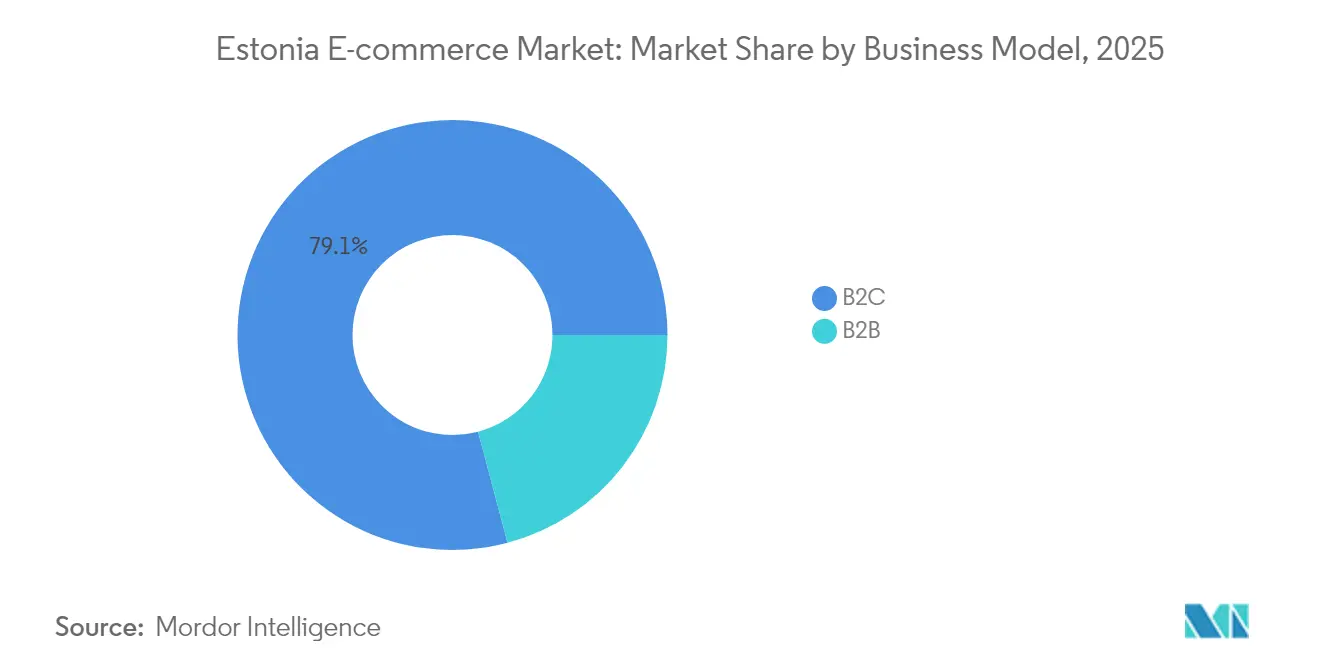
- By business model, B2C led with 79.12% revenue share in 2025; B2B is forecast to expand at an 11.63% CAGR through 2031.
- By device, smartphone/mobile captured 63.60% of the Estonia e-commerce market share in 2025 and is advancing at a 12.08% CAGR through 2031.
- By payment method, credit/debit cards accounted for 39.08% share of the Estonia e-commerce market size in 2025 while BNPL is projected to grow at 14.59% CAGR to 2031.
- By B2C product category, fashion & apparel held 24.62% revenue share in 2025; food & beverages is forecast to expand at a 14.21% CAGR through 2031.
Note: Market size and forecast figures in this report are generated using Mordor Intelligence’s proprietary estimation framework, updated with the latest available data and insights as of 2026.
Estonia E-commerce Market Trends and Insights
Drivers Impact Analysis*
| Driver | (~) % Impact on CAGR Forecast | Geographic Relevance | Impact Timeline |
|---|---|---|---|
| Rising Parcel-Locker Culture Reducing Last-Mile Costs in Tallinn & Tartu | +2.1% | National, concentrated in Tallinn & Tartu | Medium term (2-4 years) |
| Government-Led e-Residency Programme Attracting Cross-Border Sellers | +1.8% | National, with spillover to EU market | Long term (≥ 4 years) |
| High Digital ID Penetration Enabling One-Click Checkout | +1.4% | National | Short term (≤ 2 years) |
| Widespread Bank-Link Payment Habit Boosting Trust in Online Purchases | +1.2% | National | Medium term (2-4 years) |
| EU Digital Services Act Forcing Marketplace Compliance – Favouring Local Niche Stores | +0.9% | EU-wide, early impact in Estonia | Medium term (2-4 years) |
| Source: Mordor Intelligence | |||
Rising Parcel-Locker Culture Reducing Last-Mile Costs in Tallinn & Tartu
Extensive parcel-locker roll-outs have lowered delivery overheads by as much as 40% compared with door-to-door models, enabling retailers to protect margins during peak sales windows.[1]“Annual Report 2024,” Omniva Group, omniva.ee Omniva’s 2025 addition of 135 machines raises the Baltic locker count above 1,240, creating unprecedented pick-up convenience. Monthly locker usage exceeds 50% of Baltic consumers, a figure that surges around Black Friday and Singles’ Day events. Estonian logistics software firms now embed AI route optimisation to shorten driver kilometres and shrink carbon footprints, cementing the locker network as a durable differentiator within the Estonia e-commerce market. Export of this expertise, exemplified by Cleveron’s grocery-locker contracts in the United States, underscores the flywheel effect of local innovation.Government-Led e-Residency Programme Attracting Cross-Border Sellers
Government-Led e-Residency Programme Attracting Cross-Border Sellers
Nearly 100,000 global entrepreneurs have become e-residents, founding more than 15,000 Estonian-registered companies that trade throughout the EU.[2]e-Residency Team, “Statistics Dashboard,” e-Residency, e-residency.gov.ee The 0% corporate income tax on retained earnings lets digital merchants reinvest cash in inventory and customer acquisition more aggressively than in neighbouring jurisdictions. High-profile incorporations, such as Eric Schmidt’s drone venture, bolster Estonia’s brand equity as a frictionless launchpad for EU commerce. The influx of diverse sellers widens product assortments for local shoppers while intensifying price competition, reinforcing the Estonia e-commerce market’s reputation for agility.
High Digital ID Penetration Enabling One-Click Checkout
Digital ID covers 95.8% of citizens, and its integration with local banks enables one-click authentication that trims checkout steps and lowers abandonment by up to 30%.[3]“Digital Decade Policy Programme Progress Report 2024,” European Commission, ec.europa.eu Fewer security fears translate into a smaller share of shoppers who exit the funnel due to payment concerns than the EU average. The same ID rails facilitate automated VAT filing and smoother KYC for merchants, eliminating routine paperwork. This infrastructure, unique within Europe, directly boosts conversion rates and shortens working-capital cycles in the Estonia e-commerce market.
Widespread Bank-Link Payment Habit Boosting Trust in Online Purchases
A 22.6% capital-adequacy ratio underpins the banking sector, maintaining customer confidence in direct transfers that settle within seconds on the SEPA network. Merchants that optimise their interfaces for bank-link flows gain lower fraud exposure and better fee economics than card-centric rivals. BNPL products—championed by Inbank and ESTO—layer new flexibility on top of trusted rails rather than replacing them, letting consumers split payments without abandoning habitual payment environments. The synthesis of old and new payment logic differentiates the Estonia e-commerce market from card-dominated neighbours.
Restraints Impact Analysis*
| Restraint | (~) % Impact on CAGR Forecast | Geographic Relevance | Impact Timeline |
|---|---|---|---|
| Limited Warehouse Stock-Keeping Capacity for Flash-Sale Peaks | -1.6% | National, acute in Tallinn metropolitan area | Short term (≤ 2 years) |
| Ageing Rural Population Slowing Digital Adoption Outside Tallinn | -1.1% | Rural Estonia, excluding Tallinn-Tartu corridor | Long term (≥ 4 years) |
| Rising Cross-Border Return Costs to Germany & Finland | -0.8% | National, affecting cross-border e-commerce | Medium term (2-4 years) |
| Source: Mordor Intelligence | |||
Limited Warehouse Stock-Keeping Capacity for Flash-Sale Peaks Hinders the Market
Current stock-holding space cannot absorb high-velocity campaigns such as 11.11 or Black Friday, leading to rushed cross-docking and out-of-stock situations that erode shopper loyalty. Logistics overheads average 16% of GDP for manufacturing and trade firms, indicating suboptimal utilisation of freight and warehousing assets. Robotics pilots and AI demand-forecasting have improved picking accuracy, but physical expansion is still needed to stabilise fulfilment during spikes.
Ageing Rural Population Slowing Digital Adoption Outside Tallinn
Gigabit roll-outs backed by EUR 289 million (USD 314 million) in public and state funds promise full coverage, yet behavioural hurdles remain in sparsely populated counties. Older residents favour brick-and-mortar outlets and show limited interest in BNPL or app-based shopping, capping penetration ceilings. Multi-channel models that pair local pickup points with online interfaces offer a transitional path, but the demographic skew drags on the long-tail CAGR of the Estonia e-commerce market.
*Our forecasts treat driver/restraint impacts as directional, not additive. The impact forecasts reflect baseline growth, mix effects, and variable interactions.
Segment Analysis
By Business Model: B2B Acceleration Outpaces B2C Maturation
B2C accounted for 79.12% revenue in 2025, anchoring the Estonia e-commerce market’s early trajectory. However, B2B orders are set to outstrip overall growth at 11.63% CAGR through 2031, driven by e-Resident technology consultancies that adopt digital procurement suites. Estonia’s 0% tax on retained profits encourages SMEs to reinvest surpluses in inventory and SaaS tools, reinforcing platform stickiness. The Estonia e-commerce market size allocated to B2B operations is projected to expand steadily as international clients exploit Estonian supply-chain gateways into the wider EU. Sophisticated buyers demand API-driven catalogues, encouraging local marketplaces to integrate AI-guided RFQ engines and embedded financing.B2C remains powerful due to deep mobile reach and fast fashion cycles. Yet customer-acquisition costs inflate as global marketplaces add localized Estonian pages. Consequently, leading grocers and fashion retailers build loyalty ecosystems that offer next-day locker delivery and in-app payment rewards. These defensive plays slow share erosion and preserve domestic gross margins.


By Device Type: Mobile Commerce Dominance Reshapes User Experience
Smartphone and tablet screens generated 63.60% of transactions in 2025 and will widen their lead with a 12.08% CAGR. The Estonia e-commerce market share commanded by mobile derives from 77% national 5G footprint and near-universal smartphone ownership. Augmented-reality try-ons for apparel as well as one-tap ID authentication compress purchase journeys into seconds. The Estonia e-commerce market size for mobile-centric transactions is set to reach USD 0.99 billion by 2031, reflecting seamless wallet integrations.Desktop remains relevant in B2B contexts where buyers evaluate bulk SKUs and negotiate payment terms. Dual-screen setups also support long research phases for high-value electronics, preserving average basket sizes. Connected TVs and IoT devices open new touchpoints for contextual commerce such as recipe-to-cart grocery top-ups, although adoption is nascent.
By Payment Method: BNPL Innovation Disrupts Traditional Banking Preferences
Cards capture 39.08% of payment volume, yet BNPL is scaling fastest at 14.59% CAGR. The Estonia e-commerce market size routed through BNPL could exceed USD 0.23 billion by 2031 if current momentum holds. Local banks co-create white-label instalment plans, ensuring regulatory alignment on consumer credit disclosures. As a result, default rates remain below regional averages, preserving lender risk appetite.Bank-link transfers, underpinned by instant SEPA, dominate repeat purchases in grocery and utilities. They exhibit the lowest direct cost per transaction, which reinforces merchant preference. Digital wallets ride mobile ubiquity yet stay niche in absolute terms, primarily serving younger segments that favour super-app experiences.

By B2C Product Category: Food & Beverages Surge Challenges Fashion Leadership
Fashion retained 24.62% revenue share in 2025 through rapid assortment refreshes and influencer-driven campaigns. Nevertheless, online grocery will post a 14.21% CAGR, narrowing the gap by 2031. Expanded cold-chain parcel lockers and same-day courier fleets allow fresh produce to arrive within two-hour windows, elevating shopper trust. The Estonia e-commerce market size allocated to food & beverages will correspondingly rise, supported by consolidation moves such as Barbora’s integration into Maxima’s Baltic network.Electronics leverages Estonia’s high export orientation; reverse-logistics loops enable refurbishment channels that feed secondary-market demand. Furniture and DIY categories see steadier growth as consumers migrate to click-and-collect models that circumvent high delivery surcharges.
Geography Analysis
Urban corridors dominate digital spending, with Tallinn and Tartu generating more than 70% of online GMV. These hubs benefit from dense parcel-locker grids, fibre connectivity, and youthful demographics. In Tallinn alone, daily locker pickups surpassed 65,000 in 2024, illustrating ingrained convenience culture. Suburban areas within a 30-minute drive of these cities enjoy spill-over effects as commuters adopt online subscriptions for repeat household needs.
Coastal regions that interface with Finland leverage ferry freight routes for same-day cross-border returns, making them attractive for fashion marketplaces handling Nordic shoppers. The Estonia e-commerce market experiences heightened weekend sales peaks when tourists supplement domestic demand.
Rural counties lag on both high-speed coverage and digital literacy. Government broadband subsidies coupled with mobile-enabled payment awareness campaigns aim to narrow this divide by 2028. Retailers pilot hybrid locker-van models, parking mobile pickup stations at village squares on market days to stimulate first-time digital orders. Over the long term, these initiatives widen the total addressable base for the Estonia e-commerce market without cannibalising urban volumes.
Competitive Landscape
Market structure is moderately concentrated: the top five operators account for close to 45% of GMV, led by Selver, Barbora, Zalando, Amazon, and Pigu Group. Local chains lean on omnichannel synergies, integrating loyalty programmes across online and 73 physical stores. Regional fashion specialists exploit algorithmic sizing tools to keep return rates under 20%, protecting operating margins.
International entrants adopt asset-light playbooks, using third-party fulfilment centres in Tallinn’s free zone to minimise duty exposure. Their primary strategic lever is assortment depth, while local firms differentiate through 24-hour locker delivery and Estonian-language customer support. AI chatbots, such as those built on Klaus technology, cut ticket resolution times by 35%, sharpening service competitiveness. Sustainability emerges as a soft differentiator; players publicise carbon-neutral shipping lanes and recycled packaging pilots to court eco-conscious consumers.
Tech suppliers form a critical layer of the Estonia e-commerce market. Parcel-locker manufacturers, AI-based fraud-detection vendors, and compliance SaaS providers export know-how to neighbouring markets, reinforcing Estonia’s stature as a commerce tech laboratory.
Estonia E-commerce Industry Leaders
Barbora
DenimDream
Cellbes
Euronics Estonia
Selver AS
- *Disclaimer: Major Players sorted in no particular order

Recent Industry Developments
- January 2025: Omniva invested USD 3.96 million (EUR 3.6 million) to deploy 135 additional parcel machines, extending locker coverage in suburban micro-markets. Strategy: expand peak-season capacity and secure volume contracts with grocery chains.
- December 2024: Zalando moved to acquire ABOUT YOU for EUR 6.50 (USD 7.10) per share, targeting 5-10% GMV growth via shared warehouses and Baltic last-mile harmonisation. Strategy: consolidate European fashion traffic and unlock logistics synergies.
- November 2024: Miros raised USD 6.6 million (EUR 6 million) to refine visual AI search and open a United States sales office. Strategy: capture visual discovery demand among global marketplaces and deepen B2B revenue streams.
- August 2024: Eleport acquired TurboVolt GmbH, marking entry into Croatia and Slovenia with 17 fast-charging hubs. Strategy: position EV infrastructure for sustainable e-commerce delivery fleets across Central Europe.


Research Methodology Framework and Report Scope
Market Definitions and Key Coverage
Our study treats Estonia's e-commerce market as every monetary transaction for physical goods or digitally delivered services that is initiated, paid for, and fulfilled through online channels inside Estonia, including cross-border sales booked to domestic shoppers. Business-to-consumer and business-to-business flows conducted via web or mobile front ends are both counted, and gross merchandise value (GMV) is expressed in U.S. dollars using yearly average exchange rates.
Tickets for lottery and gambling platforms are not included.
Segmentation Overview
- By Business Model
- B2C
- B2B
- By Device Type
- Smartphone / Mobile
- Desktop and Laptop
- Other Device Types
- By Payment Method
- Credit / Debit Cards
- Digital Wallets
- BNPL
- Other Payment Method
- By B2C Product Category
- Beauty and Personal Care
- Consumer Electronics
- Fashion and Apparel
- Food and Beverages
- Furniture and Home
- Toys, DIY and Media
- Other Product Categories
Detailed Research Methodology and Data Validation
Primary Research
Conversations with e-shop managers, parcel operators, payment gateways, and IT integrators across Tallinn, Tartu, and cross-border hubs allowed us to validate shipment splits, cross-border ratios, and price points. Surveys of frequent online shoppers helped calibrate device preferences and payment method shifts, filling data gaps spotted during desk work.
Desk Research
Mordor analysts first mapped the demand pool using public data from Statistics Estonia, the Bank of Estonia, Eurostat, the Estonian E-commerce Association, and policy papers from the Ministry of Economic Affairs, which outline parcel-locker density and digital ID adoption. Company disclosures, investor decks, and trade press articles added insight into order volumes and average selling prices. Paid databases such as D&B Hoovers and Dow Jones Factiva supplied financials and deal activity for leading platforms. The sources listed illustrate the breadth consulted and are not exhaustive.
Market-Sizing & Forecasting
A top-down reconstruction of national GMV was built from card-scheme spending, parcel counts, and government turnover files, which are then corroborated with selective bottom-up supplier roll-ups and sampled ASP × order volumes. Critical variables, smartphone penetration, parcel-locker pickup share, digital ID usage rates, EU Digital Services Act milestones, cross-border order ratio, and median basket size drive the model. Historical relationships were tested with multivariate regression, and the best-fit ARIMA curve projects values through 2030. Where bottom-up subtotals diverged beyond three percentage points, weights were adjusted to align with verified macro totals.
Data Validation & Update Cycle
Outputs pass a two-level analyst review that checks variance against trade, banking, and customs signals. Anomalies trigger re-contacts with original experts before sign-off. Reports refresh annually, and interim updates follow material events such as tax changes or major platform entries, ensuring clients receive our latest view.
Why Mordor's Estonia E-commerce Baseline Commands Reliability
Published estimates frequently differ because firms pick unique scopes, currencies, and refresh cadences. Our disciplined inclusion of both B2C and B2B GMV, exclusion of gambling tickets, and annual recalibration against parcel and payment evidence underpin a dependable baseline.
Key gap drivers elsewhere are narrower product baskets, single-channel tracking, or currency conversions fixed to an older year.
Benchmark comparison
| Market Size | Anonymized source | Primary gap driver |
|---|---|---|
| USD 0.81 B (2025) | Mordor Intelligence | - |
| USD 0.78 B (2024) | Global Consultancy A | omits B2B flows and applies fixed 2021 exchange rate |
| USD 0.43 B (2025) | Trade Journal B | counts only desktop purchases and excludes foreign-origin orders |
| EUR 5.4 B (2024) | Industry Association C | covers travel services and digital content, inflating total trade |
These contrasts show how Mordor's balanced scope and multi-variable model yield a transparent, decision-ready baseline that executives can trace back to clear data points.


Key Questions Answered in the Report
What is the current value of the Estonia e-commerce market?
The Estonia e-commerce market is worth USD 887.84 million in 2026 and is projected to reach USD 1.41 billion by 2031.
Which segment is growing fastest within the Estonia e-commerce market?
B2B transactions show the highest momentum at an 11.63% CAGR, outpacing the overall market trajectory.
How significant is mobile commerce in Estonia?
Smartphones account for 63.60% of online purchases and are forecast to grow at a 12.08% CAGR through 2031, underscoring Estonia’s mobile-first profile.
What payment methods dominate online spending?
Credit and debit cards hold the largest share at 39.08%, but BNPL is the fastest-growing option, expanding at 14.59% CAGR.
How does Estonia’s e-Residency programme affect e-commerce?
E-Residency lowers administrative friction for foreign entrepreneurs, enabling over 15,000 companies to sell across the EU from an Estonian legal base, thereby intensifying market competition.
Which product category will drive future growth?
Food & beverages is forecast to grow at 14.21% CAGR, benefiting from expanded cold-chain locker networks and rapid delivery services.
Page last updated on:


