Market Overview
| Study Period | 2020 - 2031 |
|---|---|
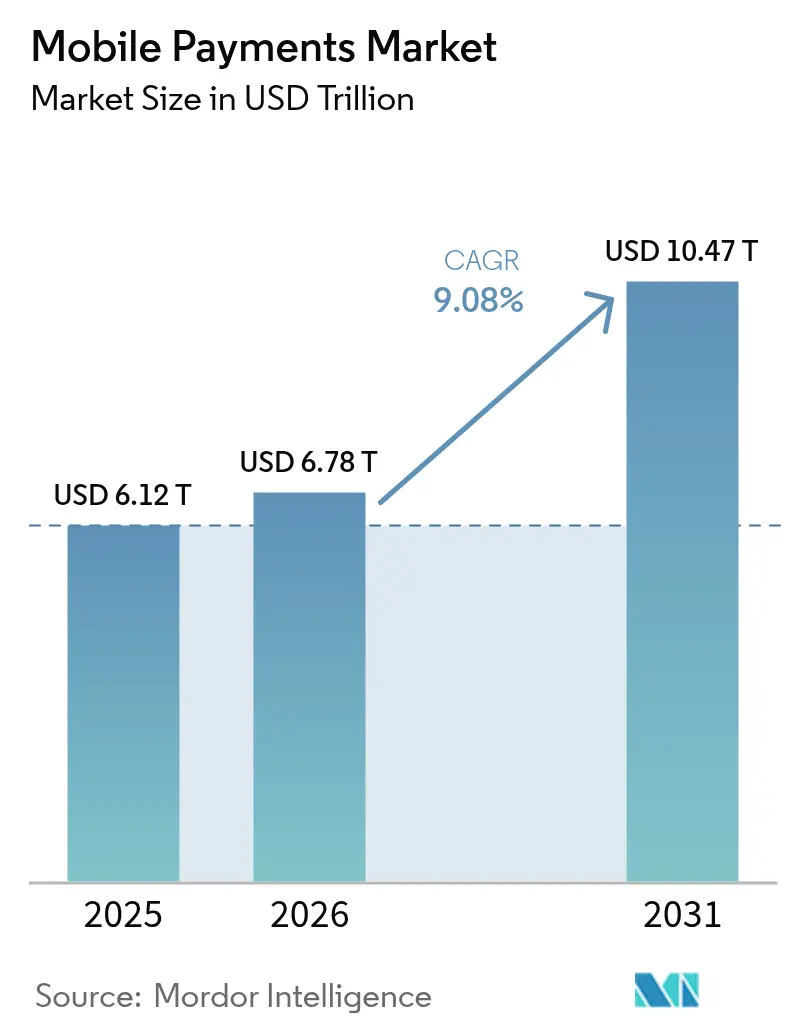
| Market Size (2026) | USD 6.78 Trillion |
| Market Size (2031) | USD 10.47 Trillion |
| Growth Rate (2026 - 2031) | 9.08% CAGR |
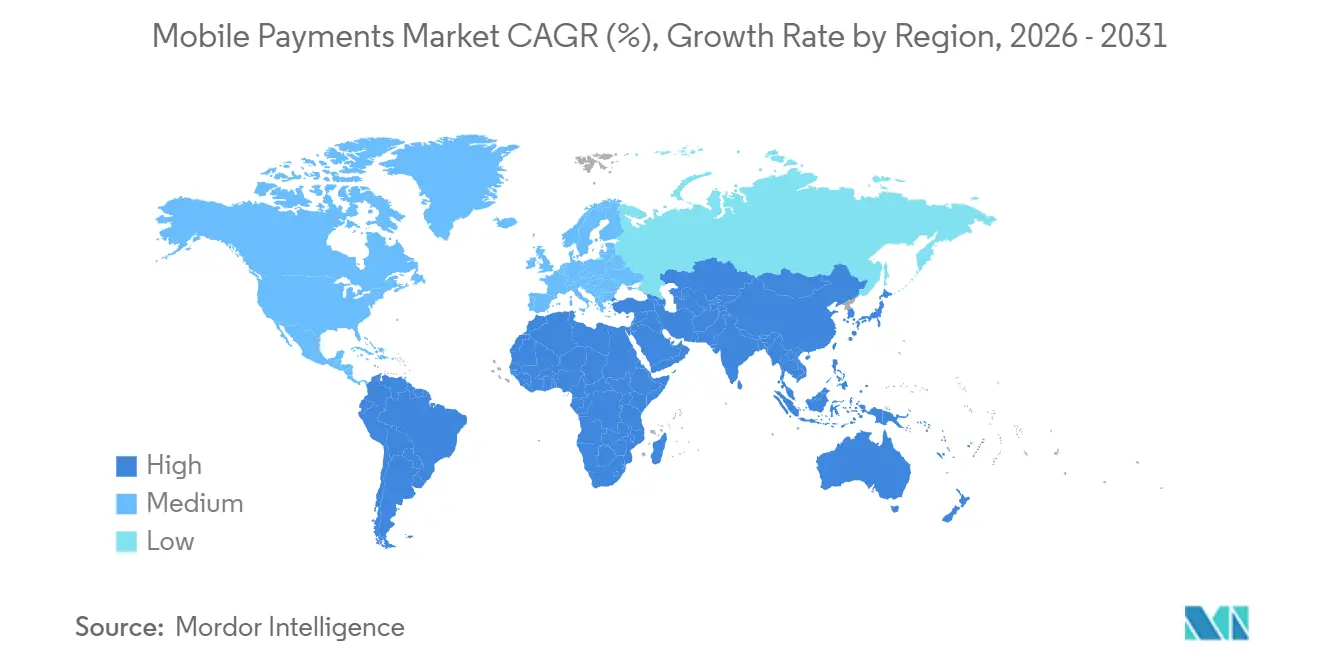
| Fastest Growing Market | Africa |
| Largest Market | Asia Pacific |
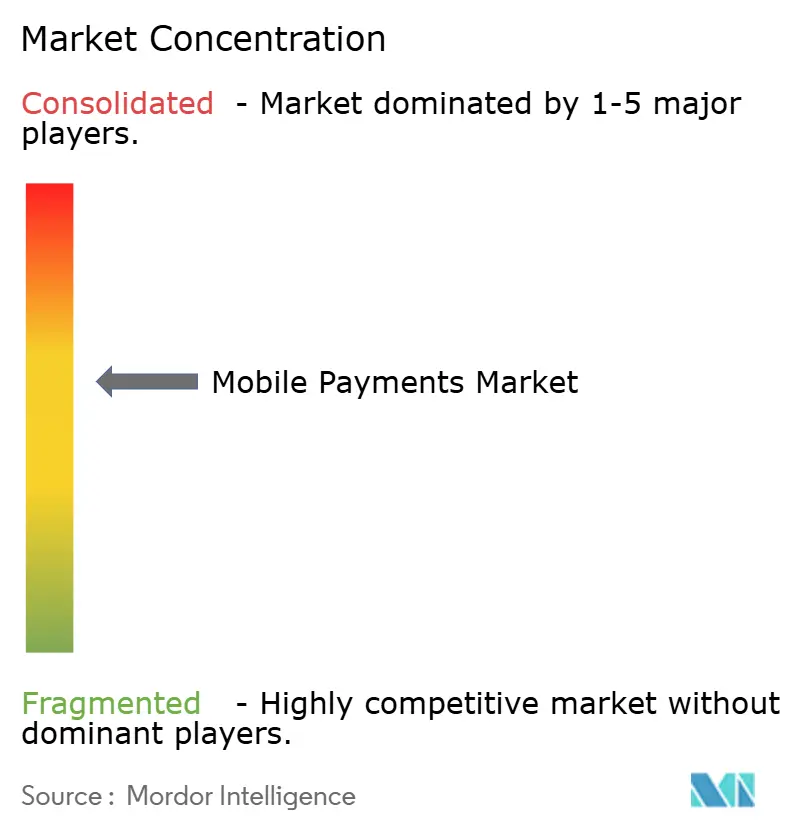
| Market Concentration | Medium |
Major Players *Disclaimer: Major Players sorted in no particular order Image © Mordor Intelligence. Reuse requires attribution under CC BY 4.0. | |
Mobile Payments Market Analysis by Mordor Intelligence
The mobile payments market size is projected to expand from USD 6.12 trillion in 2025 and USD 6.78 trillion in 2026 to USD 10.47 trillion by 2031, registering a CAGR of 9.08% between 2026 to 2031. Momentum is shifting from card-centric interchange models to zero-MDR account-to-account rails that clear funds instantly and surface richer transaction data. Real-time systems such as India’s UPI and Brazil’s Pix are proving that low-cost infrastructure can displace decades-old card networks within a few years, encouraging central banks elsewhere to replicate the blueprint. Super-apps in East and Southeast Asia are reinforcing wallet loyalty by bundling commerce, ride-hailing, insurance, and lending, while transit agencies that adopt NFC fare collection are turning the daily commute into a habit-forming tap-to-pay showcase. Competitive pressure is intensifying as regulators force platform gatekeepers to open hardware and software interfaces, allowing banks and fintechs to reclaim customer data and craft differentiated wallet propositions.
Key Report Takeaways
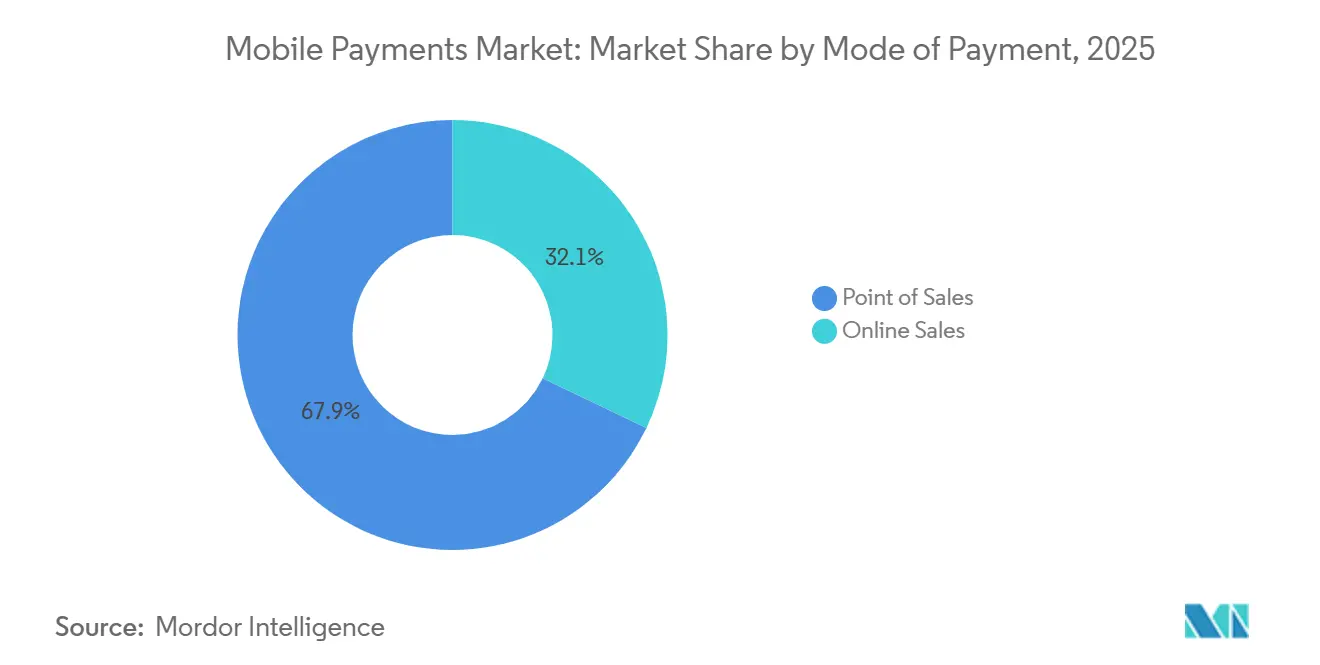
- By mode of payment, point of sales channels led with 67.89% revenue share in 2025; online channels are forecast to expand at an 11.43% CAGR through 2031.
- By payment type, other payment mechanisms, principally SMS and USSD wallets, commanded 48.67% of the mobile payments market share in 2025, while QR-based payments are projected to grow at a 12.24% CAGR between 2026 and 2031.
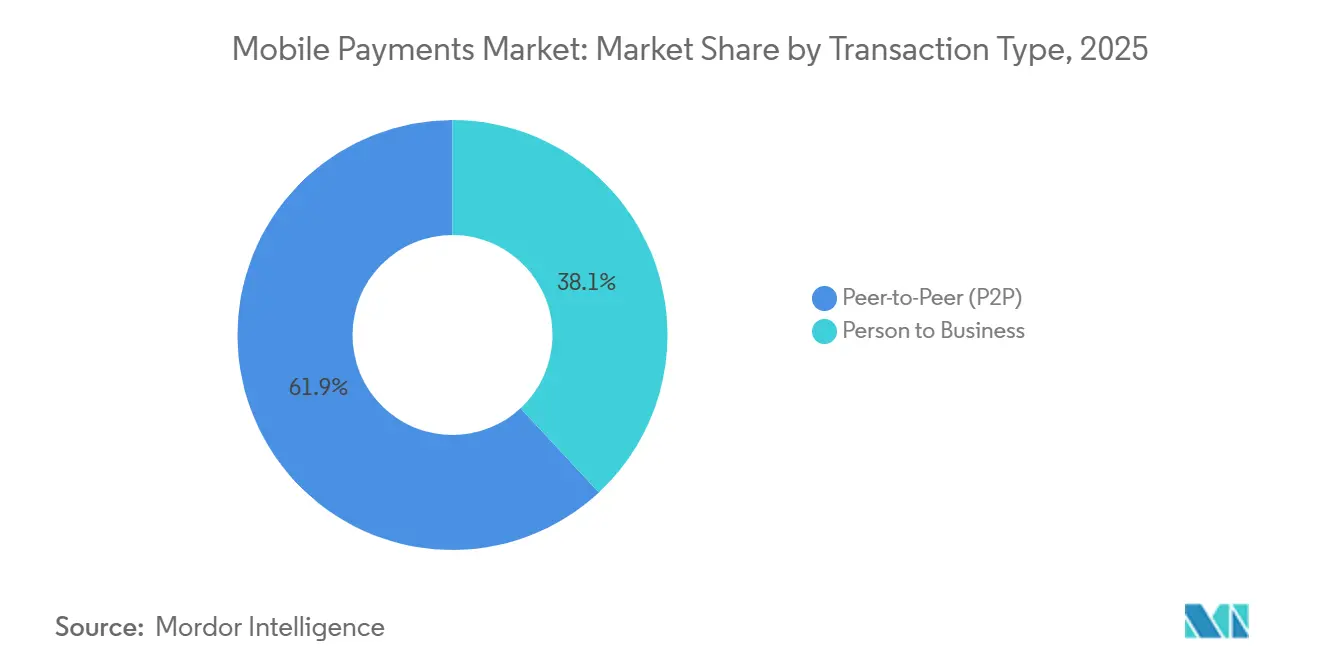
- By transaction type, peer-to-peer transfers accounted for 61.92% of volume in 2025, whereas person-to-business flows are advancing at a 13.17% CAGR over the forecast horizon.
- By application, retail and e-commerce captured 31.59% of the mobile payments market size in 2025 and transportation and logistics is pacing ahead at a 10.56% CAGR to 2031.
- By geography, Asia-Pacific captured 48.79% of revenue in 2025, while Africa is projected to post the highest regional growth at 19.16% CAGR during the forecast horizon.
Note: Market size and forecast figures in this report are generated using Mordor Intelligence’s proprietary estimation framework, updated with the latest available data and insights as of 2026.
Global Mobile Payments Market Trends and Insights
Drivers Impact Analysis*
| Driver | (~) % Impact on CAGR Forecast | Geographic Relevance | Impact Timeline |
|---|---|---|---|
| Explosive UPI and Pix-Style Real-Time Rails Adoption | +2.8% | Asia-Pacific core, Latin America expansion, spillover to Middle East and Africa | Medium term (2-4 years) |
| Subsidised Merchant MDRs Fueling QR-Code Uptake | +1.9% | Global, with highest intensity in India, Southeast Asia, Latin America | Short term (≤ 2 years) |
| Super-App Ecosystem Lock-Ins in East and Southeast Asia | +1.6% | China, Indonesia, Singapore, Thailand, Vietnam, South Korea | Long term (≥ 4 years) |
| NFC-Enabled Transit Projects Boosting Urban Proximity Spend | +1.3% | North America, Europe, Asia-Pacific urban centers | Medium term (2-4 years) |
| Interchange-Free A2A Wallets Compressing Card Fees | +1.5% | Global, with early gains in Brazil, India, European Union | Medium term (2-4 years) |
| Apple iPhone Third-Party NFC Access Opening New Wallet Competition | +0.9% | European Economic Area, potential spillover to other jurisdictions | Short term (≤ 2 years) |
| Source: Mordor Intelligence | |||
Explosive UPI and Pix-Style Real-Time Rails Adoption
India’s Unified Payments Interface handled 228 billion transactions worth INR 300 trillion (USD 3.61 trillion) in 2025, equal to 83% of national retail digital volume, validating that real-time, zero-interchange rails can eclipse card usage once consumer familiarity and merchant ubiquity align. Brazil’s Pix reached 170 million adults and 20 million companies within four years, with person-to-business flows growing fastest as QR scans replace boleto slips.[1]Banco Central do Brasil, “Pix Payment System Statistics,” bcb.gov.br Instant settlement slashes working-capital strain and bolsters monetary-policy transmission, prompting Singapore, Malaysia, and the European Union to accelerate similar rollouts.
Subsidised Merchant MDRs Fueling QR-Code Uptake
Indonesia’s QRIS regime caps merchant discount rates at 0.7% for small-ticket transactions and guarantees interoperability across 30 e-wallets, expanding acceptance to 21 million points by 2024.[2]Bank Indonesia, “QRIS Statistics and Regulations,” bi.go.id Vietnam mirrored the tactic, waiving MDRs for micro-merchants and registering 892% year-on-year QR volume growth in January 2024. Governments justify the subsidies by enlarging the tax base and shrinking cash-handling costs, while wallet providers pivot to value-added services such as inventory analytics and loyalty engines.
Super-App Ecosystem Lock-Ins in East and Southeast Asia
Alipay and WeChat Pay processed more than 90% of China’s mobile payments in 2025, embedding mini-programs that bundle shopping, ride-hailing, wealth management, and insurance, which makes wallet switching onerous. GrabPay’s 40 million monthly users across Southeast Asia illustrate the model’s portability, delivering USD 9.4 billion in gross merchandise value in Q3 2024. Regulators are responding; China’s central bank ordered Alipay-WeChat interoperability in 2024, hinting at future antitrust interventions elsewhere.
Interchange-Free A2A Wallets Compressing Card Fees
The U.S. FedNow network connected 900 institutions by 2024, enabling account-pull checkouts that save merchants 1-3 percentage-points in fees. Europe’s SEPA Instant Payments mandate, effective January 2025, requires euro transfers to settle in under 10 seconds, catalyzing merchant adoption of open-banking-initiated payments. Merchants report 40-60% fee savings and zero chargeback exposure, pressuring card schemes to reposition as fraud-protection layers rather than primary rails.
Restraints Impact Analysis*
| Restraint | (~) % Impact on CAGR Forecast | Geographic Relevance | Impact Timeline |
|---|---|---|---|
| Fragmented Tokenisation Standards Hindering Cross-Wallet Acceptance | -0.8% | Global, with highest friction in cross-border e-commerce | Medium term (2-4 years) |
| High Chargeback Ratios in Cross-Border Wallet-Funded Transactions | -1.1% | Global, concentrated in Europe-Asia and North America-Asia corridors | Short term (≤ 2 years) |
| In-Store NFC Interoperability Gaps in US Dual-Tap Flows | -0.6% | United States, limited spillover to Canada and Mexico | Short term (≤ 2 years) |
| AML and KYC Friction Slowing Wallet On-Boarding in Tier-2 African Banks | -0.7% | Sub-Saharan Africa, with early challenges in Nigeria, Kenya, Ghana | Medium term (2-4 years) |
| Source: Mordor Intelligence | |||
High Chargeback Ratios in Cross-Border Wallet-Funded Transactions
Wallet-funded cross-border e-commerce sees chargeback rates of 1-2%, roughly quadruple domestic card levels, due to inconsistent authentication, currency disputes, and regulatory divergence.[3]Visa, “Chargeback Statistics,” visa.com Merchants often respond by geo-blocking high-risk corridors, which then constrains wallet adoption and stifles growth in the mobile payments market. Networks are investing in real-time fraud scoring, yet liability rules remain patchy, discouraging universal acceptance.
Fragmented Tokenisation Standards Hindering Cross-Wallet Acceptance
EMVCo’s token framework is interpreted differently across regions, leading to lifecycle and cryptogram mismatches that degrade authorization success for cross-border shoppers.[4]EMVCo, “Payment Token Service Provider Specifications,” emvco.com Retailers juggling multiple token vaults face higher costs and elevated cart-abandonment risk, undercutting one of the core convenience benefits that the mobile payments market promises.
*Our forecasts treat driver/restraint impacts as directional, not additive. The impact forecasts reflect baseline growth, mix effects, and variable interactions.
Segment Analysis
By Mode of Payment: Physical Retail Infrastructure Anchors Volume, Digital Channels Capture Growt
Point of sales transactions delivered 67.89% of 2025 volume, underscoring the still-dominant role of NFC terminals and QR acceptance in brick-and-mortar settings. Nevertheless, online channels are forecast to grow at an 11.43% CAGR through 2031, reflecting expanding super-app ecosystems and one-click guest checkouts that remove traditional form-fill friction. Stripe’s 2024 Fastlane launch demonstrated a sub-30-second guest flow, lifting conversions markedly. While hardware refresh cycles slow point-of-sale upgrades, software distribution for e-commerce is near-instant, letting small merchants in under-banked regions tap digital wallets without card contracts. As a result, the mobile payments market is likely to see rapid share rebalancing despite the entrenched in-store base.
Evolving security requirements, notably PSD2’s strong customer authentication, initially impeded online adoption but are now largely invisible to consumers due to biometric pass-through in leading wallets. Where tap-to-ride transit systems normalize habitual phone payments, adjacent quick-service outlets are following suit, blurring the historical line between physical and digital checkout.


By Payment Type: SMS and USSD Wallets Retain Reach, QR Codes Lead Momentum
Other payment types, chiefly SMS and USSD wallets, held 48.67% share in 2025, proving indispensable where feature phones dominate and internet access is patchy. QR-based methods, however, are tracking a 12.24% CAGR as merchants appreciate zero hardware costs and governments subsidize MDRs. Indonesia’s interoperable QRIS and India’s Bharat QR exemplify how public standards ignite competition among private wallets without locking merchants into proprietary codes.
61 million users in 18 African nations move value over USSD rails, bypassing the need for smartphones. Still, as entry-level Android handsets fall below USD 50, QR acceptance is expected to leapfrog older modalities, expanding the mobile payments market size in rural locales formerly reliant on cash.
By Transaction Type: Social Transfers Dominate Counts, Commercial Flows Drive Value
Peer-to-peer transfers represented 61.92% of 2025 transaction counts, energized by wedding gifts, informal commerce, and migrant remittances. Yet person-to-business volumes are projected to log a 13.17% CAGR as real-time rails eliminate cash-on-delivery and gig-economy payouts migrate to wallets. India’s Paytm, with 10.5 million QR merchants, exemplifies the pivot from gratuities to structured commerce.
Recurring bill frameworks such as India’s Bharat Bill Payment System are automating utilities and insurance debits, making digital wallets sticky and predictable revenue generators. Consequently, the mobile payments market share of commercial flows is set to rise even if P2P remains transaction-count heavy.
By Application: Retail Commands Today, Transit and Logistics Accelerate Tomorrow
Retail and e-commerce absorbed 31.59% of 2025 mobile payments market size, reflecting grocery, apparel, and restaurant dominance. Transit and logistics, however, are expanding at a 10.56% CAGR as NFC fare gates proliferate and freight platforms embed instantaneous wallet settlements. Transport for London processed 1.7 million daily contactless taps in 2024, with 70% issued from phones, proving that the daily commute entrenches behavioral change.
Government-to-person disbursements also matter; India’s Direct Benefit Transfer funneled INR 9.4 trillion (USD 113 billion) to citizens in 2024, legitimizing wallets as official channels. Over the forecast period, public sector and healthcare payments are poised to climb as regulators digitize tax and license workflows, fortifying the mobile payments industry against cash leakage.
Geography Analysis
Asia-Pacific remains the epicenter of the mobile payments market, anchored by Alipay and WeChat Pay capturing over 90% of China’s transactions and locking 1.33 billion users into super-app webs. India’s UPI contributed INR 300 trillion (USD 3.61 trillion) of 2025 value, equal to 83% of domestic retail digital activity. Southeast Asia is rising quickly; GrabPay’s 40 million monthly users and Indonesia’s 21 million QRIS merchants illustrate regional replication potential. Japan and South Korea continue to post high tap-to-pay penetration, with Kakao Pay processing KRW 183 trillion (USD 141 billion) in 2023.
Latin America is the second-fastest region as Brazil’s Pix moved BRL 26.4 trillion (USD 5.28 trillion) in 2024 and achieved 76.4% adult penetration. Mercado Pago processed USD 134 billion in total payment value in 2023 and is leveraging transaction data to underwrite consumer credit. Mexico’s CoDi and Argentina’s inflationary environment are also nudging cash users toward wallets.
The Middle East is accelerating through policy targets, with the UAE at 95% smartphone penetration and Saudi Arabia’s Vision 2030 mandating cashless ecosystems. MTN Mobile Money’s agent-assisted onboarding offsets biometric KYC gaps, yet tier-2 banks lack infrastructure, slowing broader wallet rollout. North America and Europe show slower headline growth but benefit from transit-led NFC habit formation and impending open-banking boosters like SEPA Instant.

Competitive Landscape
The global mobile payments market features moderate concentration, with the top 10 players handling roughly 60% of transaction value. Super-apps such as Alipay, WeChat Pay, and GrabPay treat payments as gateways to higher-margin finance, whereas infrastructure firms like Visa, Mastercard, and Stripe monetize fraud analytics and cross-border settlement. Apple’s forced opening of iPhone NFC in July 2024 under the Digital Markets Act has empowered European banks to craft proprietary wallets, eroding Apple Pay’s platform moat. Card schemes are hedging via acquisitions, Mastercard purchased Recorded Future for USD 2.65 billion to embed threat intelligence into authorization flows.
White-space remains in cross-border remittances, where wallets still route through correspondent banks, and in U.S. offline acceptance, where NFC terminal coverage lags card issuance. New entrants are using FedNow connections to price merchant checkout at 0.5-1% versus the 2-3% card benchmark, shifting the cost calculus for small retailers. Technology differentiation centers on biometric authentication and AI-driven anomaly detection, with Stripe integrating facial-match vendor Okay to meet European PSD2 mandates.
Mobile Payments Industry Leaders
Alphabet (Google Pay)
Apple Inc.
Samsung Electronics (Samsung Pay)
PayPal Holdings
Amazon.com Inc. (Amazon Pay)
- *Disclaimer: Major Players sorted in no particular order

Recent Industry Developments
- June 2025: FairPrice Group and Google Cloud launched the “Store of Tomorrow” concept featuring cloud-connected carts, scan-and-pay, and biometric checkout, signaling a shift toward autonomous retail journeys.
- June 2025: T-money enabled Apple Pay compatibility across Korean transit, extending NFC acceptance from transportation into everyday purchases and reinforcing wallet convenience.
- May 2025: Visa acquired Featurespace to embed advanced behavioral fraud prevention into its processing stack, bolstering real-time risk scoring within the mobile payments market.
- January 2025: Visa expanded its Flexible Credential product to 15 markets, letting consumers toggle debit, credit, and BNPL from a single card.


Global Mobile Payments Market Report Scope
Mobile payments are transactions made using a mobile device—such as a smartphone or tablet—to pay for goods or services instead of using cash, cards, or checks. Mobile payments can also be used for fund transfers digitally rather than paying with a cheque or cash. Mobile payment technology provides diverse applications in end-user industries like movie tickets, food, and retail stores.
The Mobile Payments Market Report is Segmented by Mode of Payment (Point of Sales, Online Sales), Payment Type (NFC, QR-Based, Other Payment Types), Transaction Type (Peer-to-Peer, Person to Business), Application (Retail and E-Commerce, Transportation and Logistics, Hospitality and Food-Service, Government and Public Sector, Other Applications), and Geography (North America, Europe, Asia-Pacific, South America, Middle East, Africa). The Market Forecasts are Provided in Terms of Value (USD).
By Mode of Payment
| Point of Sales |
| Online Sales |
By Payment Type
| NFC |
| QR-Based |
| Other Payment Types |
By Transaction Type
| Peer-to-Peer (P2P) |
| Person to Business |
By Application
| Retail and E-Commerce |
| Transportation and Logistics |
| Hospitality and Food-Service |
| Government and Public Sector |
| Other Applications (Education, Healthcare) |
By Geography
| North America | United States |
| Canada | |
| Mexico | |
| Europe | United Kingdom |
| Germany | |
| France | |
| Italy | |
| Spain | |
| Rest of Europe | |
| Asia-Pacific | China |
| India | |
| Japan | |
| South Korea | |
| Rest of Asia-Pacific | |
| South America | Brazil |
| Argentina | |
| Rest of South America | |
| Middle East | United Arab Emirates |
| Saudi Arabia | |
| Rest of Middle East | |
| Africa | South Africa |
| Nigeria | |
| Rest of Africa |
| By Mode of Payment | Point of Sales | |
| Online Sales | ||
| By Payment Type | NFC | |
| QR-Based | ||
| Other Payment Types | ||
| By Transaction Type | Peer-to-Peer (P2P) | |
| Person to Business | ||
| By Application | Retail and E-Commerce | |
| Transportation and Logistics | ||
| Hospitality and Food-Service | ||
| Government and Public Sector | ||
| Other Applications (Education, Healthcare) | ||
| By Geography | North America | United States |
| Canada | ||
| Mexico | ||
| Europe | United Kingdom | |
| Germany | ||
| France | ||
| Italy | ||
| Spain | ||
| Rest of Europe | ||
| Asia-Pacific | China | |
| India | ||
| Japan | ||
| South Korea | ||
| Rest of Asia-Pacific | ||
| South America | Brazil | |
| Argentina | ||
| Rest of South America | ||
| Middle East | United Arab Emirates | |
| Saudi Arabia | ||
| Rest of Middle East | ||
| Africa | South Africa | |
| Nigeria | ||
| Rest of Africa | ||


Key Questions Answered in the Report
How large is the mobile payments market expected to be by 2031?
It is projected to reach USD 10.47 trillion by 2031, expanding at a 9.08% CAGR from 2026.
Which region currently generates the most mobile wallet volume?
Asia-Pacific leads, driven by China’s Alipay and WeChat Pay and India’s UPI.
What segment is growing fastest within mobile payments?
Online channels inside the mobile payments market are forecast to grow at an 11.43% CAGR through 2031.
Why are QR codes popular with merchants in emerging economies?
They avoid terminal hardware costs, attract subsidized MDRs, and interoperate across multiple wallets.
How are regulators reshaping competition on iOS devices?
The European Union’s Digital Markets Act forced Apple to open iPhone NFC hardware to third-party wallets, letting banks bypass Apple Pay fees.
What is the main challenge hindering cross-border wallet growth?
Elevated chargeback ratios and fragmented tokenization standards drive merchant reluctance to accept overseas wallet transactions.
Page last updated on:


