Market Overview
| Study Period | 2020 - 2031 |
|---|---|
| Forecast Data Period | 2026 - 2031 |
| Historical Data Period | 2020 - 2024 |
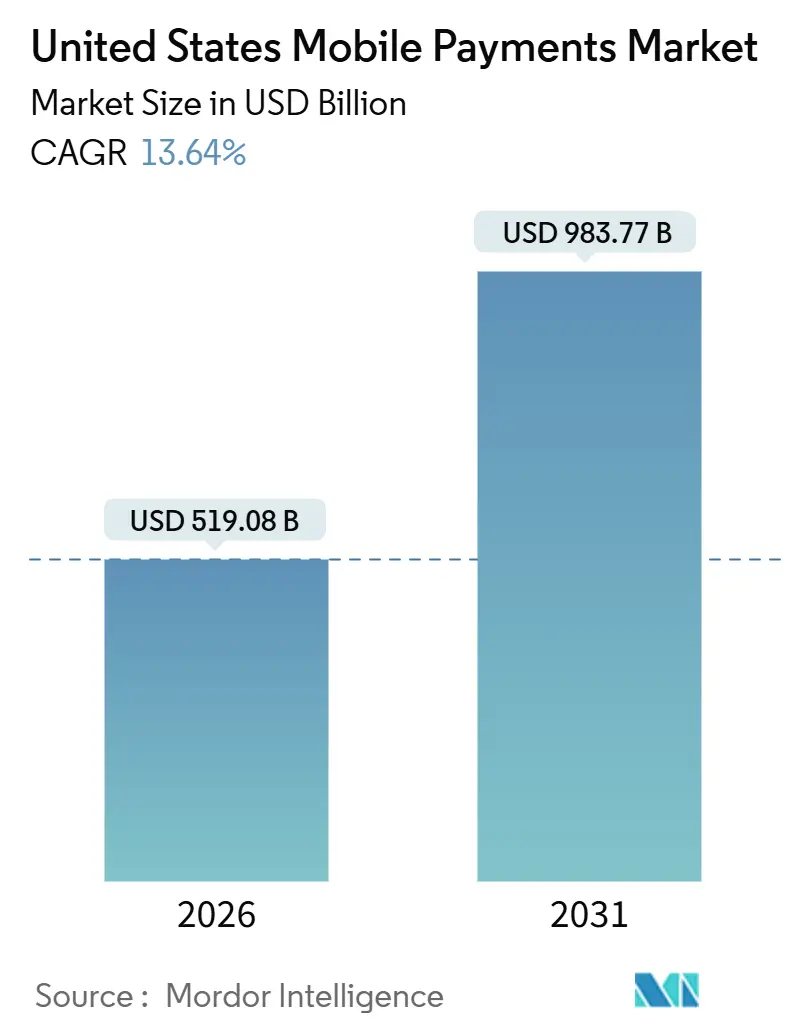
| Market Size (2026) | USD 519.08 Billion |
| Market Size (2031) | USD 983.77 Billion |
| Growth Rate (2026 - 2031) | 13.64% CAGR |
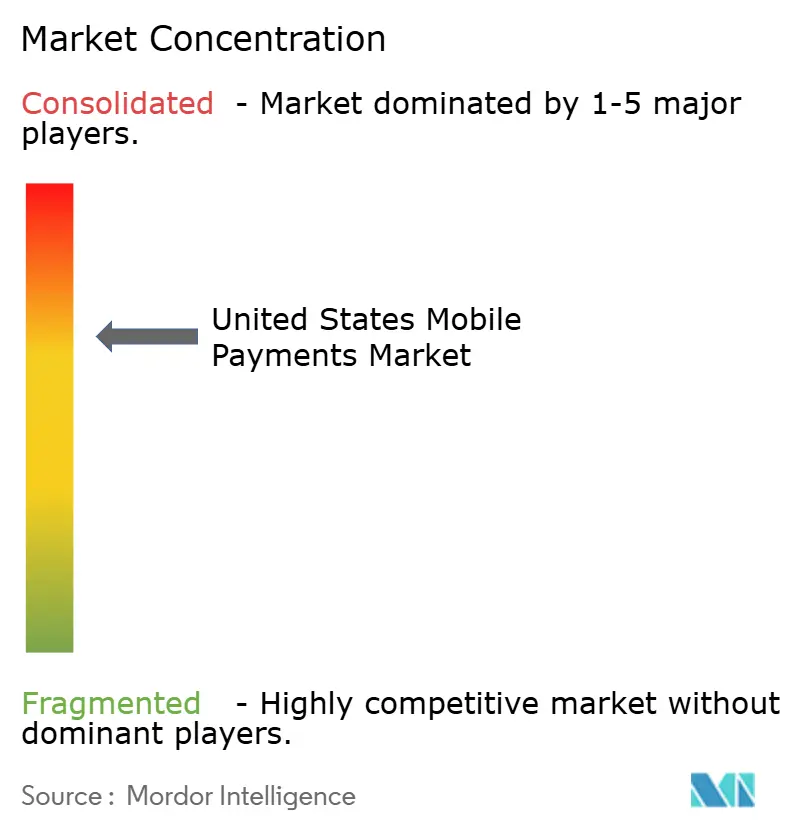
| Market Concentration | Medium |
Major Players *Disclaimer: Major Players sorted in no particular order Image © Mordor Intelligence. Reuse requires attribution under CC BY 4.0. | |
United States Mobile Payments Market Analysis by Mordor Intelligence
The mobile payments market size in the United States stood at USD 519.08 billion in 2026 and is on course to reach USD 983.77 billion by 2031, translating into a 13.64% CAGR over the forecast window. Momentum continues to shift from cash and checks toward token-secured, always-on digital rails as instant settlement, biometric authentication, and embedded peer-to-peer wallets become everyday options at point-of-sale, online checkouts, and inside banking apps. Real-time rails are eliminating overdraft risk and late fees, while tokenization is lifting authorization rates and shrinking fraud losses, reinforcing consumer confidence. Merchants are rolling out near-field-communication readers at record speed, and transit authorities are normalizing tap-to-pay for daily commuting, further anchoring behavioral change. Competitive intensity is high, yet no single platform dominates, creating openings in under-served use cases such as earned-wage access and cross-border remittances.
Key Report Takeaways
- By payment instrument, mobile wallets led with 47.83% of mobile payments market share in 2025, while real-time transfers are projected to expand at a 14.54% CAGR to 2031.
- By transaction channel, e-commerce commanded 47.83% of value in 2025, whereas peer-to-peer transfers are forecast to advance at a 14.62% CAGR through 2031.
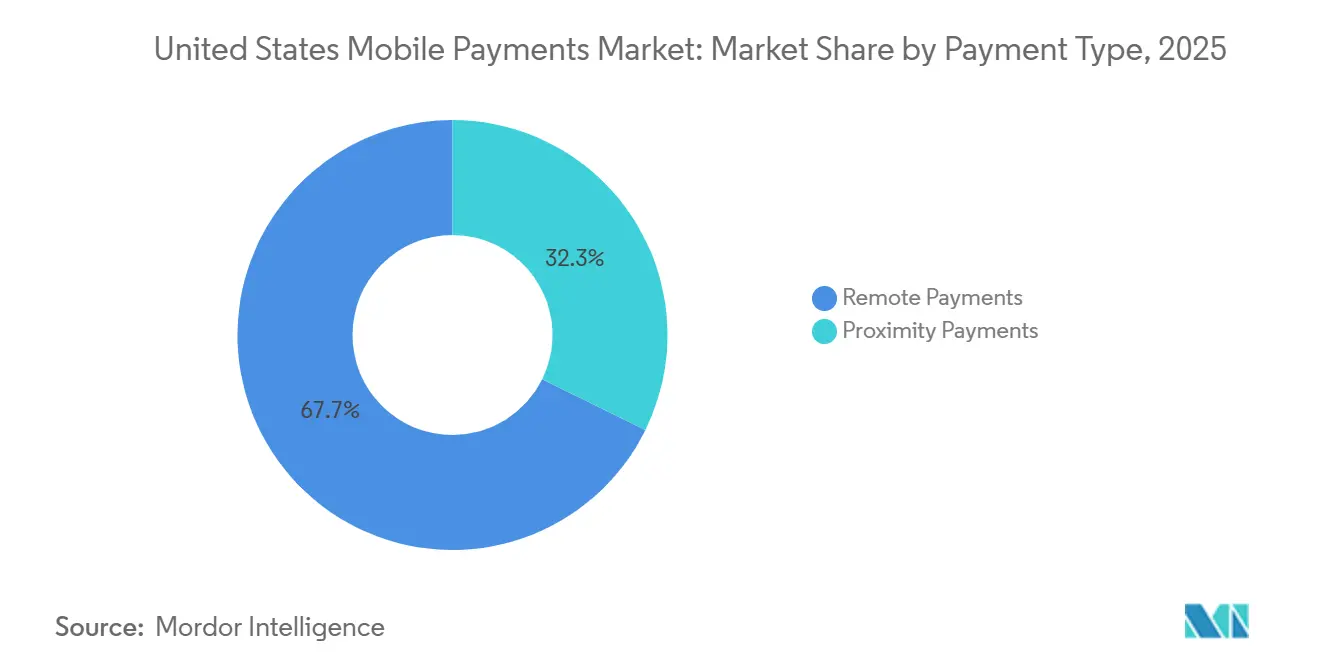
- By payment type, remote payments captured 67.72% share of the mobile payments market size in 2025 and are expected to grow at a 14.78% CAGR between 2026-2031.
- By end-user industry, retail and FMCG contributed 34.72% of spending in 2025; transportation and mobility is anticipated to post the fastest 14.34% CAGR to 2031.
Note: Market size and forecast figures in this report are generated using Mordor Intelligence’s proprietary estimation framework, updated with the latest available data and insights as of January 2026.
United States Mobile Payments Market Trends and Insights
Drivers Impact Analysis*
| Driver | (~) % Impact on CAGR Forecast | Geographic Relevance | Impact Timeline |
|---|---|---|---|
| Rising smartphone and 5G penetration | +2.1% | National, higher in urban centers and coastal states | Medium term (2-4 years) |
| Rapid merchant roll-out of NFC/contactless terminals | +2.3% | National, retail-dense metros and transit hubs | Short term (≤2 years) |
| P2P wallet adoption surge (Zelle, Venmo, Cash App) | +2.5% | National, Gen Z and millennials in urban markets | Short term (≤2 years) |
| Expansion of FedNow and RTP instant rails | +2.8% | National, early gains in community banks and credit unions | Medium term (2-4 years) |
| Tokenized card-on-file reduces fraud and boosts acceptance | +2.0% | National, e-commerce and subscription-heavy sectors | Medium term (2-4 years) |
| Earned-wage access fueling push-to-wallet payroll | +1.5% | National, hourly-wage industries | Long term (≥4 years) |
| Source: Mordor Intelligence | |||
Expansion Of FedNow And RTP Instant Rails
FedNow linked more than 1,400 financial institutions by October 2025, enabling sub-second, irrevocable transfers around the clock.[1]Federal Reserve, “FedNow Service,” federalreserve.gov The Clearing House’s RTP network already handled 343 million payments totaling USD 246 billion in 2024. Community banks and credit unions are quickly onboarding to match neobanks that market real-time fund availability, accelerating their mainstream reach. Same-day settlement removes batch-processing float, helping households avoid late fees and merchants improve cash flow. Wallet providers must plug into these rails or risk losing bill-pay and disbursement volumes to bank-native push-payments.
P2P Wallet Adoption Surge
Zelle crossed the USD 1 trillion annual transaction value threshold in 2024 and reached 151 million enrolled users.[2]Early Warning Services, “Zelle Network Data,” zellepay.com Venmo posted USD 85 billion in transaction volume in the third quarter of 2025, up 14% year over year. Cash App counted 57 million monthly active users in the first quarter of 2025. Zelle’s in-app bank integration eliminates the need for separate downloads, minimizing friction. Federal Reserve surveys show that 45% of remote payments were initiated on mobile in 2025. These trends tighten pressure on card-network interchange as more everyday payments bypass cards completely.
Tokenized Card-On-File Reduces Fraud And Boosts Acceptance
Visa’s token service exceeded 10 billion credentials by mid-2025, lifting authorization by up to 4 percentage points.[3]Visa, “Visa Token Service,” usa.visa.com Mastercard’s Click to Pay mirrors these gains across 500,000 merchant sites. EMVCo data indicate tokenization trims card-not-present fraud by 26%. Automatic credential updates prevent subscription churn when cards expire, making tokens attractive to streaming services and SaaS vendors. Apple Pay, Google Pay, and Samsung Pay all rely on device-specific tokens, setting a baseline that smaller wallets must match to win high-value merchants.
Rapid Merchant Roll-Out Of NFC/Contactless Terminals
Nearly 70% of U.S. merchants accepted tap-to-pay by 2024, and contactless transactions accounted for 40% of retail volume. The Metropolitan Transportation Authority logged more than 1 billion OMNY taps by mid-2024. JPMorgan Chase started nationwide deployment of biometric-enabled readers in 2025. Faster checkouts improve throughput and shrink lines, boosting merchant adoption across grocery, quick-service restaurants, and mass transit. Wallets tied to popular smartphones, especially the iPhone, ride this infrastructure wave and capture incremental proximity spend.
Restraints Impact Analysis*
| Restraint | (~) % Impact on CAGR Forecast | Geographic Relevance | Impact Timeline |
|---|---|---|---|
| Data-security and privacy concerns | -1.8% | National, stringent-law states | Medium term (2-4 years) |
| Credit/debit card rewards lock-in | -1.5% | National, affluent segments | Long term (≥4 years) |
| Patchwork state-level privacy laws raise compliance cost | -0.9% | National, fintech startups and regional banks | Medium term (2-4 years) |
| Wallet/bank-rail interoperability gaps cause liquidity silos | -0.6% | National, multi-wallet households and SMBs | Short term (≤2 years) |
| Source: Mordor Intelligence | |||
Data-Security And Privacy Concerns
It is estimated that most Americans worry about corporate data practices and the majority feel they lack control over personal information. A 2024 breach at a major processor exposed tokenized credentials for 12 million accounts, reinforcing skepticism. The Federal Trade Commission recorded 5.7 million fraud reports in 2024. State laws such as California’s Consumer Privacy Act elevate compliance demands, hitting smaller fintechs hardest. Providers now publicize encryption standards, biometric safeguards, and rapid-breach alerts to rebuild trust, especially among older consumers who trail Gen Z in wallet usage.
Credit/Debit Card Rewards Lock-In
It is estimated that most U.S. cardholders value rewards, and the majority choose payment methods based on points or cash-back offers. Interchange revenue funds these perks, yet U.S real time payments transfers carry negligible fees, limiting wallet economics to match equivalent benefits. Airlines and hotels deepen loyalty by tying elite status to co-branded credit card spend levels. While Venmo, Cash App, and PayPal experiment with merchant-funded discounts, breadth and predictability lag traditional card programs. The result is a two-tier market where high-ticket travel and electronics stay on cards, and wallets dominate low-value, high-frequency spend.
*Our forecasts treat driver/restraint impacts as directional, not additive. The impact forecasts reflect baseline growth, mix effects, and variable interactions.
Segment Analysis
By Payment Instrument: Instant Rails Outpace Wallet Growth
The payment-instrument landscape shows mobile wallets holding 47.83% share in 2025, yet real-time transfers are projected to post a 14.54% CAGR, the fastest within the mobile payments market. FedNow’s 1,400-member network and RTP’s 343 million transactions underscore readiness for scale. Wallet leaders must integrate these endpoints to stay relevant as consumers prize immediacy over brand affinity. Card-based flows act as a bridge for merchants tied to existing acquirer contracts, while carrier billing remains niche for digital-content micro-purchases.
Competitive dynamics reveal that PayPal’s Venmo logged USD 85 billion in the third quarter of 2025, while Zelle’s embedded model now reaches 151 million users without separate enrollment. Visa and Mastercard answer with tokenized Click to Pay, preserving interchange while promising one-click checkout. As settlement speed becomes table stakes, the mobile payments market size for real-time instruments is set to grow rapidly.


By Transaction Channel: P2P Transfers Accelerate Past E-Commerce
E-commerce contributed 47.83% of 2025 value, buoyed by USD 310.3 billion in online retail sales in Q3 2025. Yet P2P transfers are expected to grow at a 14.62% CAGR, propelled by Zelle’s USD 1 trillion milestone and Venmo’s strong double-digit expansion. Gen Z users treat P2P apps as default settlement tools for rent, group dining, and gig payments, displacing checks. Contactless transit programs such as New York’s OMNY, which recorded over 1 billion taps, reinforce mobile behavior in daily commuting.
In-store transactions gain from NFC terminal saturation, and card-network initiatives keep one-tap convenience device-agnostic. Bill payments and government remittances remain laggards as legacy systems persist, but the mobile payments market is beginning to see pilot instant bill-pay features riding FedNow. Cross-border flows still face FX friction; however, Visa Direct processed 7.5 billion transactions worldwide in 2024, signaling early traction.
By Payment Type: Remote Dominance Masks Proximity Opportunity
Remote payments captured 67.72% share in 2025 and are expected to maintain a 14.78% CAGR, supported by subscription commerce and app-based marketplaces that embed one-click checkouts. Tokenization, which trims card-not-present fraud by 26%, underpins the rise. Proximity payments are smaller but climbing as NFC readers and biometric POS units spread nationwide, exemplified by JPMorgan Chase rollouts. Apple Pay and Google Pay dominate proximity volumes through device secure elements, yet Visa’s device-agnostic tap-to-pay seeks to level the field.
Demand is also shifting toward biometric cardless experiences, where a fingerprint or face scan substitutes for a phone tap, cutting seconds off checkout queues. As these deployments scale, the mobile payments market share of proximity flows is expected to rise, narrowing the gap with remote channels.
By End-User Industry: Transportation And Mobility Outpaces Retail
Retail and FMCG accounted for 34.72% of 2025 spend, thanks to widespread adoption of contactless readers and QR codes. Yet transportation and mobility are forecast to grow at a 14.34% CAGR, driven by tap-to-ride projects and rideshare wallet integration. OMNY’s 1 billion taps showcase rail and bus demand. Uber and Lyft process more than 95% of fares via in-app wallets, underscoring mobility’s pull toward embedded payments.
Hospitality adoption is rising as hotels allow room access and incidentals via wallet taps, linking payments to loyalty upgrades. Utilities and telecom remain behind, but FedNow’s 24-hour settlement is prompting pilots for instant bill pay. Healthcare systems use earned-wage access tools such as DailyPay to push wages into nurses' wallets, reducing reliance on payday loans. These shifts suggest the mobile payments market size inside transportation corridors will expand faster than retail over the projection horizon.
Geography Analysis
Real-time payments adoption is higher on the West Coast and in the Northeast, where tech-savvy consumers and dense merchant networks accelerate the mobile payments market. California leads in NFC terminal penetration, aligning with early Apple Pay launches and stringent privacy rules that push providers to invest in trust-building. New York’s OMNY network anchors tap-to-pay ridership, reinforcing everyday wallet usage during commutes. Southern states follow closely behind in P2P growth, as community banks rapidly connect to FedNow to retain depositors seeking instant wage availability.
Midwestern adoption is anchored by retailer chains that rolled out contactless during the pandemic and kept momentum afterward. Rural pockets lag slightly due to slower 5G rollouts, yet earned-wage access programs gain traction in logistics hubs that employ hourly workers. Credit-union participation in RTP is narrowing geographic gaps by giving remote areas an alternative to cash without waiting two days for ACH settlement.
Cross-border tourism hot spots such as Florida receive an extra boost as foreign visitors increasingly carry NFC cards and wallets, expecting tap-to-pay acceptance at theme parks and hotels. Merchants in these regions are upgrading to accept multi-currency wallet payments, driving incremental merchant-service-provider revenue. Overall, geographic variance is shrinking, and the mobile payments market size advantage once held by coastal metros is slowly equalizing as nationwide instant rails mature.
Competitive Landscape
The United States mobile payments market supports a moderately concentrated yet still fragmented competitive field. Apple, Google, and Samsung capitalize on device integration, biometric security, and secure elements to lock in proximity spend. PayPal and Block focus on merchant tools, working-capital advances, and social P2P features that extend beyond pure payments. Visa and Mastercard have repositioned as tokenization infrastructure providers, with Visa’s 10 billion tokens boosting e-commerce auth rates by 4 points. Zelle embeds directly into 2,100+ banking apps, trading consumer brand visibility for instant network reach.
Stripe continues to serve platform merchants with API-driven checkout, adding bank-account linking to reduce card fees. Affirm and Klarna embed buy-now-pay-later installments, chipping away at credit card revolving balances. Fiserv’s Clover POS bundles inventory and analytics, giving small merchants a turnkey solution. Stablecoin pilot volumes reached USD 950 billion in July 2025, yet regulatory clarity on reserves and compliance remains uncertain. Market participants that fail to integrate real-time transfers or robust tokens risk erosion as instant, secure, and loyalty-rich alternatives proliferate.
United States Mobile Payments Industry Leaders
Cash App
PayPal Holdings Inc.
Apple Inc.
JPMorgan Chase and Co. (Chase Pay)
Google LLC (Google Pay)
- *Disclaimer: Major Players sorted in no particular order

Recent Industry Developments
- October 2025: The Federal Reserve confirmed more than 1,400 institutions live on FedNow, lifting real-time settlement reach nationwide.
- September 2025: PayPal processed USD 458 billion in total payment volume in Q3, with Venmo contributing USD 85 billion and 14% growth.
- July 2025: Visa crossed the 10 billion credential mark for its token service, reporting 30% of U.S. e-commerce already tokenized.
- June 2025: Cash App reached 57 million monthly users and added instant cashback at select merchants to rival card rewards.


United States Mobile Payments Market Report Scope
The United States Mobile Payments Market Report is Segmented by Payment Instrument (Real-Time Transfers, Mobile Wallets, Card-based Mobile Payments, Carrier Billing and Others), Transaction Channel (In-store POS, E-commerce, P2P Transfers, Bill and Government Payments, Cross-border and Tourist), Payment Type (Proximity Payments, Remote Payments), and End-User Industry (Retail and FMCG, Transportation and Mobility, Hospitality and Tourism, Utilities and Telecom, Healthcare and Education, Other End-User Industries). The Market Forecasts are Provided in Terms of Value (USD).
By Payment Instrument
| Real-Time Transfers (RTP/FedNow) |
| Mobile Wallets (Apple Pay, PayPal, etc.) |
| Card-based Mobile Payments |
| Carrier Billing / Others |
By Transaction Channel
| In-store POS |
| E-commerce |
| P2P Transfers |
| Bill and Government Payments |
| Cross-border / Tourist |
By Payment Type
| Proximity Payments |
| Remote Payments |
By End-User Industry
| Retail and FMCG |
| Transportation and Mobility |
| Hospitality and Tourism |
| Utilities and Telecom |
| Healthcare and Education |
| Other End-User Industries |
| By Payment Instrument | Real-Time Transfers (RTP/FedNow) |
| Mobile Wallets (Apple Pay, PayPal, etc.) | |
| Card-based Mobile Payments | |
| Carrier Billing / Others | |
| By Transaction Channel | In-store POS |
| E-commerce | |
| P2P Transfers | |
| Bill and Government Payments | |
| Cross-border / Tourist | |
| By Payment Type | Proximity Payments |
| Remote Payments | |
| By End-User Industry | Retail and FMCG |
| Transportation and Mobility | |
| Hospitality and Tourism | |
| Utilities and Telecom | |
| Healthcare and Education | |
| Other End-User Industries |


Key Questions Answered in the Report
How large is the United States mobile payments market today?
The mobile payments market size reached USD 519.08 billion in 2026 and is forecast to almost double to USD 983.77 billion by 2031.
Which payment instrument is growing fastest inside U.S. mobile payments?
Real-time transfers are expanding at a 14.54% CAGR through 2031, outpacing mobile wallets and other instruments as FedNow and RTP scale.
What segment holds the highest mobile payments market share?
Remote payments led with 67.72% share in 2025, driven by e-commerce and subscription services.
Why do consumers stick with credit cards despite wallet convenience?
Rewards lock-in is strong, with 84% of cardholders valuing points or cashback and 71% choosing instruments based on those perks.
How are merchants responding to mobile payment trends?
About 70% of U.S. merchants now support NFC tap-to-pay, and many are integrating tokenization to cut fraud and lift authorization rates.
Page last updated on:


