
Industrial Monitor Market Size and Share
Market Overview
| Study Period | 2020 - 2031 |
|---|---|
| Market Size (2026) | USD 11.85 Billion |
| Market Size (2031) | USD 15.74 Billion |
| Growth Rate (2026 - 2031) | 5.84 % |
| Fastest Growing Market | South America |
| Largest Market | Asia Pacific |
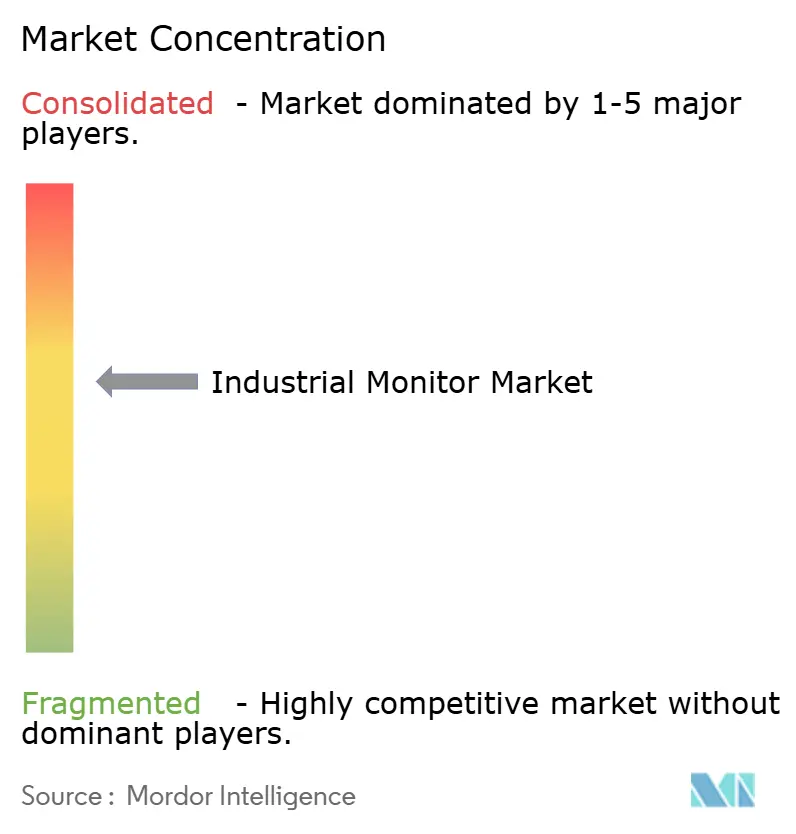
| Market Concentration | Medium |
Major Players *Disclaimer: Major Players sorted in no particular order Image © Mordor Intelligence. Reuse requires attribution under CC BY 4.0. | |
Industrial Monitor Market Analysis by Mordor Intelligence
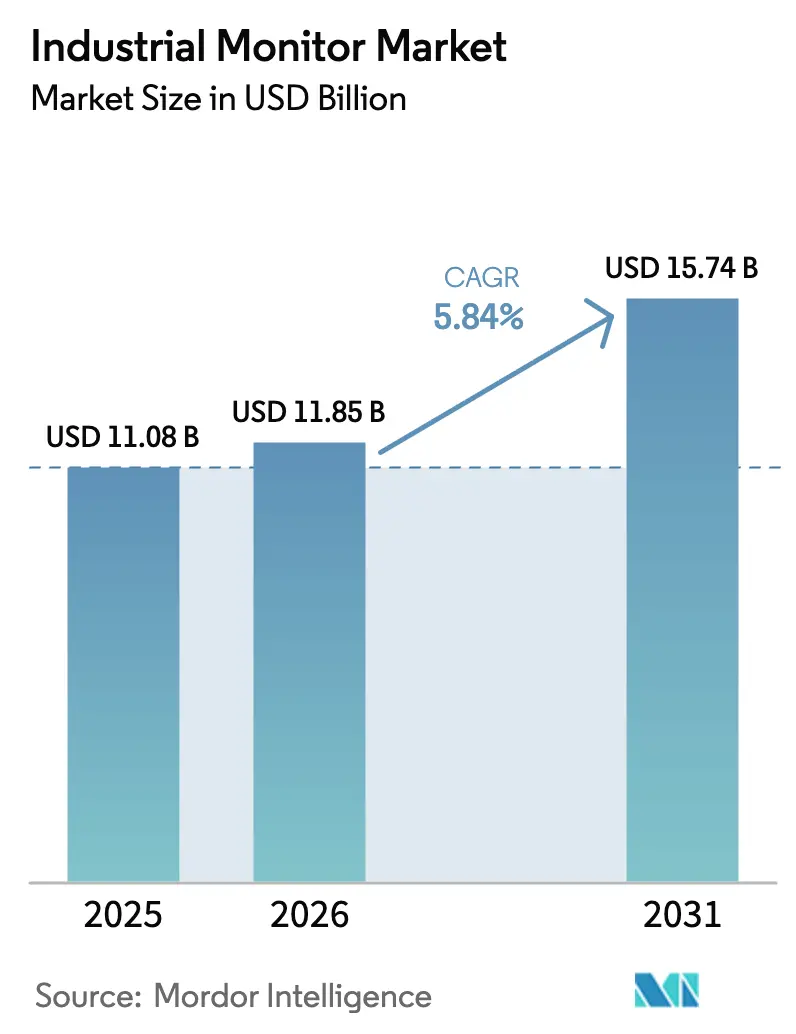
The Industrial Monitor Market size is USD 11.08 billion in 2025, USD 11.85 billion in 2026, and will reach USD 15.74 billion by 2031, growing at a CAGR of 5.84% from 2026 to 2031. The expansion tracks the retirement of cathode-ray and cold-cathode fluorescent lamp displays in favor of thin-film-transistor liquid-crystal and organic light-emitting diode panels that meet IEC 61010 and ATEX Group II compliance for hazardous sites. Upgrades are being accelerated by smart-factory retrofits that integrate human-machine interfaces into mature machines, by edge-AI vision stations that require low-latency local visualization, and by tighter OSHA and EU safety regulations that necessitate high-brightness screens that withstand vibration and electromagnetic noise. Shifting screen-size preferences toward large formats for statistical process control, rising orders from semiconductor cleanrooms for open-frame modules, and early adoption of self-emissive organic light-emitting diode panels in oil and gas drive incremental value. Suppliers with vertically integrated glass, backlight, and firmware teams are cushioning supply-chain shocks and spreading cybersecurity certification costs across multiple product lines, widening the gap with price-led challengers.
Key Report Takeaways
- By display technology, liquid-crystal displays led with 61.21% revenue share in 2025, while organic light-emitting diode panels are forecast to expand at a 21.53% CAGR through 2031.
- By screen size, the 12-23 inch bracket commanded 39.56% of the Industrial monitor market share in 2025, and displays larger than 32 inches are advancing at a 20.66% CAGR to 2031.
- By mounting type, panel-mount units held 43.47% of the Industrial monitor market size in 2025, whereas open-frame configurations are rising at a 21.05% CAGR over the forecast horizon.
- By end-use industry, automotive manufacturing accounted for 23.14% share in 2025 while medical and healthcare displays post the fastest 20.92% CAGR through 2031.
- By geography, Asia-Pacific dominated with 41.88% share in 2025 and South America is projected to register the highest 22.44% CAGR between 2026 and 2031.
Note: Market size and forecast figures in this report are generated using Mordor Intelligence’s proprietary estimation framework, updated with the latest available data and insights as of January 2026.
Global Industrial Monitor Market Trends and Insights
Drivers Impact Analysis*
| Driver | (~) % Impact on CAGR Forecast | Geographic Relevance | Impact Timeline |
|---|---|---|---|
| Surge in smart-factory retrofits | +1.2% | Global, with concentration in Germany, Japan, South Korea, United States | Medium term (2-4 years) |
| Expanding edge-AI vision inspection demand | +1.4% | APAC core (China, Taiwan, Vietnam), spill-over to North America automotive belt | Short term (≤ 2 years) |
| Tightening OSHA and EU Machinery Safety mandates | +0.9% | North America and EU, cascading to export-oriented ASEAN manufacturers | Long term (≥ 4 years) |
| Growth of battery-powered autonomous mobile robots | +1.1% | North America logistics hubs, EU warehousing, APAC e-commerce fulfillment centers | Medium term (2-4 years) |
| Phasing-out of cathode-ray and CCFL monitors and legacy lines | +0.7% | Global, accelerated replacement in regulated industries (pharma, aerospace) | Short term (≤ 2 years) |
| OEM bundling of panel PCs with industrial monitors | +0.5% | Global, strongest in vertically integrated suppliers (Germany, Taiwan, United States) | Long term (≥ 4 years) |
| Source: Mordor Intelligence | |||
Surge in Smart-Factory Retrofits
Small and medium manufacturers are grafting new human-machine interfaces onto long-lived machines to harvest live overall equipment effectiveness data without purchasing replacement assets. Plattform Industrie 4.0 reported that 68% of German SMEs added at least one networked display between 2024 and 2025.[1]Plattform Industrie 4.0, “Implementation Survey 2025,” plattform-i40.de Siemens observed retrofit monitor revenue rising 22% year on year in 2025 and noted a three-to-one sales ratio favoring retrofits over greenfield lines in Europe and North America. Retrofit buyers specify IP65 sealed bezels, VESA mounts, and protocol-agnostic Ethernet to shorten installation downtime. The specification trend funnels orders toward suppliers offering modular displays that interface with Profinet, EtherCAT, and Modbus TCP stacks.
Expanding Edge-AI Vision Inspection Demand
Electronics and auto assemblers now link compact vision sensors to nearby industrial monitors, allowing technicians to validate defect flags in real-time. Cognex shipped 1.2 million In-Sight SnAPP sensors in 2025, up 34% over 2024, with 61% deployed in Asia-Pacific battery and electronics plants.[2]Cognex Corporation, “Form 10-K 2025,” sec.gov Tesla’s Gigafactory Berlin installed 480 inspection cells in 2025, each featuring a 23-inch touchscreen that lets operators retrain convolutional networks on the spot. These stations require 4K resolution at 60Hz refresh and embedded graphics processors, driving demand for higher-performance panels in the industrial monitor market.
Tightening OSHA and EU Machinery Safety Rules
New regulations require control stations to keep warnings visible under 10,000 lux of light, withstand one-meter impacts, and maintain brightness during emergency stop events. The EU Machinery Regulation 2023/1230 became effective in January 2027 and directly influences 2026 purchase orders. OSHA citations for inadequate guarding climbed 19% in fiscal 2025, prompting pre-emptive upgrades of older lines with 1,200-nit sunlight-readable displays. Rockwell Automation saw safety-rated monitor sales jump 27% quarter on quarter in late 2025 as automotive and food processors prepared for stricter audits.
Growth of Battery-Powered Autonomous Mobile Robots
Warehouse and fulfillment operators equip mobile robots with small displays that permit on-unit rerouting and exception handling while in motion. OMRON’s LD fleet logged 4.8 million operating hours in 2025 across 620 sites and every robot carried a 10.1-inch rugged touchscreen. Amazon Robotics added 12,000 such units during 2025, reporting a 41% cut in manual scanner handoffs and faster pick cycles. Lithium-iron-phosphate batteries extend runtimes to 16 hours, sparking interest in low-power transflective panels that remain legible under high-bay LED lighting.
Restraints Impact Analysis*
| Restraint | (~) % Impact on CAGR Forecast | Geographic Relevance | Impact Timeline |
|---|---|---|---|
| Persistent supply-chain volatility for industrial-grade TFT glass | -0.8% | Global, acute in Japan and Taiwan glass-substrate production | Short term (≤ 2 years) |
| High capital cost of IEC-Ex/ATEX-rated displays | -0.6% | Oil and gas regions (Middle East, North Sea, Permian Basin), chemical processing zones | Medium term (2-4 years) |
| Margins squeezed by commoditization of mid-size LCD panels | -0.4% | Global, most severe in 15-21 inch standard-resolution segment | Long term (≥ 4 years) |
| Rising cybersecurity certification costs for IIoT-ready monitors | -0.5% | North America and EU manufacturing, extending to APAC export suppliers | Medium term (2-4 years) |
| Source: Mordor Intelligence | |||
Persistent Supply-Chain Volatility for Industrial-Grade TFT Glass
Only three vendors supply alkali-free glass that endures -30 °C to +80 °C duty cycles, so any outage hits the Industrial monitor market quickly. Corning reported 94% capacity utilization for Eagle XG in Q4 2025 and lead times ballooned to 18 weeks, double that for consumer glass. A March 2025 fire at AGC’s Takasago line sidelined 12% of global capacity for seven months, forcing monitor makers to redesign housings for thicker substrates or delay shipments.[3]Nikkei Asia, “AGC Plant Fire Disrupts Industrial Glass,” asia.nikkei.com Spot prices for 15-inch industrial sheets swung between USD 42 and USD 68 in 2025, compressing already thin gross margins.
Rising Cybersecurity Certification Costs for IIoT-Ready Monitors
Passing IEC 62443-4-2 security level 2 adds USD 30,000 to USD 80,000 in test fees per product family. Schneider Electric stated that cybersecurity accounted for 4.2% of its 2025 automation R&D expenditure and led to the discontinuation of 19% of its legacy models. UL Solutions rolled out its CAP test regime in January 2025, stretching development cycles by up to 14 months and deterring small firms. The requirement consolidates industrial monitor market share among vendors that can amortize the extra cost across wide product catalogs.
*Our forecasts treat driver/restraint impacts as directional, not additive. The impact forecasts reflect baseline growth, mix effects, and variable interactions.
Segment Analysis
By Display Technology: OLED Gains in Hazardous Zones
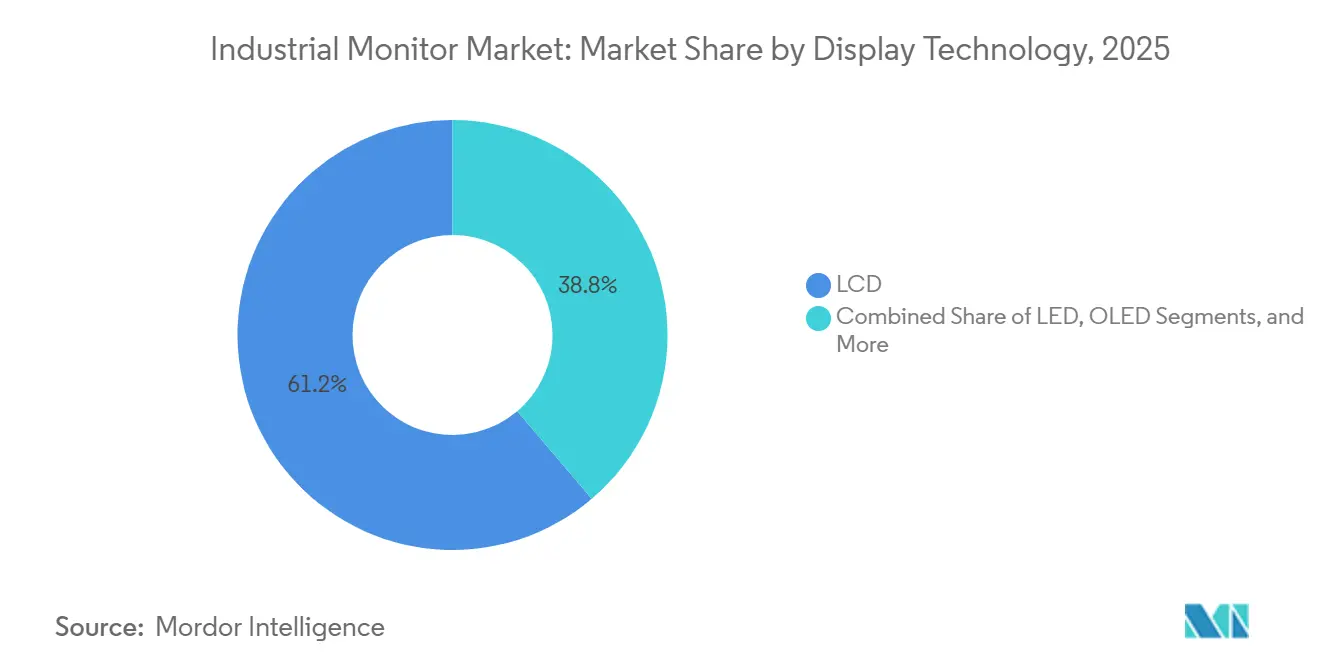
Liquid-crystal displays held 61.21% share in 2025, underpinned by entrenched backlight supply chains. Organic light-emitting diode panels are forecast to climb at a 21.53% CAGR as oil and gas operators favor self-emissive pixels that remove high-voltage inverters in ATEX Zone 1 rooms. LG Display secured IECEx certification for a 15.6-inch panel in October 2025, thereby unlocking opportunities in offshore and refinery projects. Light-emitting diode direct-view arrays are used in outdoor substations where ambient light exceeds 50,000 lux, while e-paper remains a niche solution for low-power picking stations.
In hospital surgical suites, infinite contrast enhances visualization under dim lights. Siemens Healthineers rolled out 27-inch organic light-emitting diode monitors to 340 operating rooms in 2025 and surgeons flagged anomalies 18% faster than with liquid-crystal models. The slim 6 millimeter profile eases ceiling boom integration and supports sterile airflow requirements.



By Screen Size: Large Formats Transform Automotive Lines
The 12-23 inch range maintained 39.56% share in 2025 owing to familiarity in discrete manufacturing. Displays above 32 inches are projected to grow at a rate of 20.66% annually as automakers deploy video walls that aggregate data from hundreds of programmable logic controllers. BMW’s Spartanburg plant installed 43-inch units in 2025 and cut unplanned downtime by 23%.
Pharmaceutical users are installing 55-inch touchscreens in aseptic suites to review batch records without leaving clean zones. Merck’s Darmstadt site shortened disposition cycles by five days after installing 56 large screens in 2025. Sub-12-inch rugged panels stay essential for mobile robots and handheld diagnostic devices where power budgets limit backlight wattage.
By Mounting Type: Open-Frame Dominates Cleanrooms
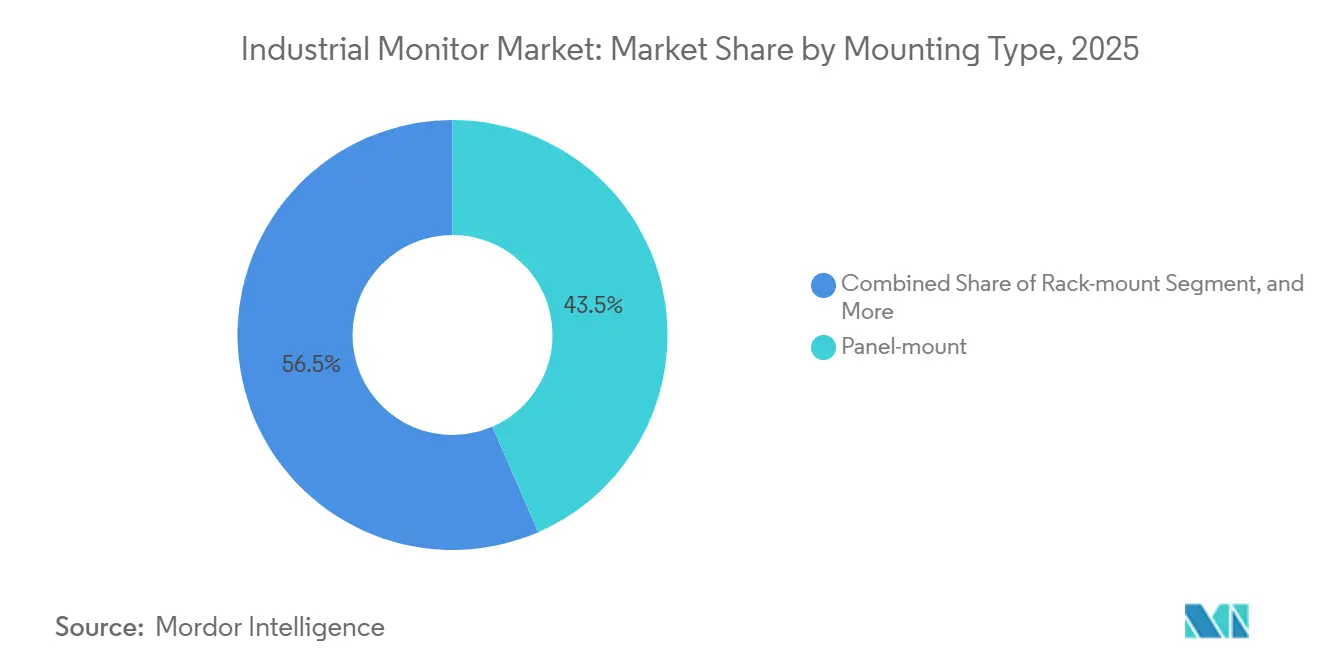
Panel-mount enclosures retained 43.47% share in 2025, valued in food and chemical plants that need IP69K and stainless bezels. Open-frame modules are expected to expand at a 21.05% CAGR through 2031 as fabs incorporate bare panels into laminar-flow cabinets. Intel retrofitted 1,200 open-frame monitors at Fab 34 in 2025, reducing contamination excursions by 31%.
Arm-mount systems are trending in collaborative robot cells that are reconfigured on a weekly basis. ABB’s YuMi deployments utilized articulating arms in 420 lines in 2025, allowing operators to bring screens within reach. Rack-mount displays stay common in data centers, while chassis-mount variants serve military platforms that prioritize shock resistance.
By End-Use Industry: Healthcare Outpaces Traditional Manufacturing
Automotive held 23.14% share in 2025 in the industrial monitor market, as battery production lines needed thermal imagery overlays. Medical and healthcare are poised to record a 20.92% CAGR because operating theaters demand 4K and 8K visualization. GE HealthCare shipped 87,000 Vscan Air ultrasound devices with 5.7-inch displays in 2025, with more than half of them destined for point-of-care settings.
Oil and gas upgrades accelerated after Shell replaced 340 cathode-ray monitors on the Prelude floating gas unit with 21-inch ATEX-rated touchscreens in 2025. Logistics installations prefer 1,000-nit transflective screens, while food processors specify IP69K housings that tolerate steam cleaning.
Geography Analysis
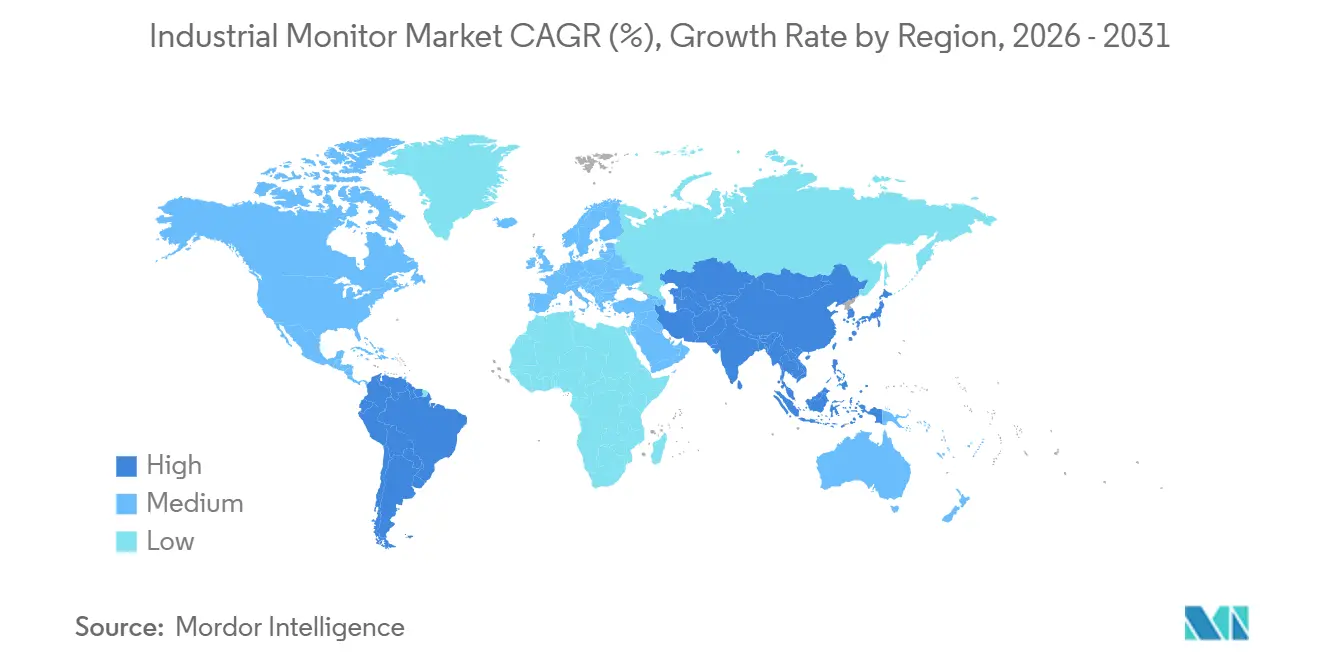
Asia-Pacific commanded 41.88% share in 2025 due to robotics mandates in China and subsidies in India that fuel electronics clusters. South Korea’s advanced fabs installed 18,000 open-frame displays in 2025 for extreme-ultraviolet lithography, and Japan’s Ministry of Economy, Trade, and Industry reported a 68% adoption rate of cobots among SMEs.[4]Ministry of Economy Trade and Industry Japan, “SME Cobot Survey 2025,” meti.go.jp These projects favor high-resolution panels that resist chemical mists in the industrial monitor market.
South America is forecast to grow at a rate of 22.44% annually, driven by the demand for explosion-proof monitors from Brazil’s Rota 2030 program and Argentina’s Vaca Muerta shale expansion. Petrobras awarded contracts for 2,400 such units in late 2025 for pre-salt platforms. Regional distributors are investing in São Paulo service hubs that offer on-site calibration compliant with ANATEL electromagnetic rules.
North America and Europe are expected to progress at mid-single-digit rates. Replacement cycles dominate but reshoring under the CHIPS and Science Act and the EU Net-Zero Industry Act promotes new semiconductor and battery gigafactories that need 4K large-format displays. Middle Eastern refineries are upgrading control rooms with video walls, while Africa’s mining sector modernizes operator booths with wide-temperature panels.

Regulatory Landscape
Industrial monitors sit within a layered compliance stack covering electrical safety, EMC, hazardous-location protection, and cybersecurity expectations for IIoT-connected models. In the European Union, the Machinery Regulation (EU) 2023/1230 becomes fully applicable on January 20, 2027, and it has already shaped 2026 procurement specifications for control-station visibility, impact resistance, and functional safety integration. For hazardous sites, suppliers continue to align to ATEX and IECEx expectations under the IEC 60079 series, while baseline requirements such as CE/UKCA, FCC Class A, and cULus support cross-border deployments.
Trade and standards updates in 2026 also add compliance checkpoints. Regulation (EU) 2026/1455 takes effect on July 1, 2026, removing customs duties on most US-origin industrial goods entering the EU, which prompts manufacturers and distributors to review origin documentation and product classification for duty-free treatment. On the standards side, IEC 62368-1:2026 was published on April 15, 2026, and certification programs are transitioning from the 2014 edition toward Q1 2027 deadlines, shaping qualification planning for monitors bundled with computing, networking, and AV/IT functions.
Value Chain Analysis
The industrial monitor value chain begins with concentrated upstream suppliers of alkali-free specialty glass, TFT-LCD/OLED cells, polarizers, backlights, touch sensor films, and display driver ICs, then moves into midstream ruggedization and system integration. Integrators combine panels with controller boards, power conditioning, projected-capacitive or resistive touch stacks, IP-rated bezels, and firmware stacks that support industrial protocols as well as cybersecurity hardening. Bottlenecks are most visible in industrial-grade TFT glass and in driver IC allocation, where industrial programs compete with higher-volume consumer demand, extending lead times for custom-configured units.
Downstream, products are sold via a mix of direct OEM channels (automation and machine builders), panel-PC and HMI ecosystem bundling, and regional industrial distributors that provide on-site calibration, spares, and lifecycle services. Manufacturing and integration for panels and electronics remain anchored in East and Southeast Asia, while final assembly and configuration are increasingly localized in places such as Eastern Europe and Mexico to shorten logistics cycles and manage tariff and origin constraints. Vendors with vertical integration across glass, backlight, and firmware reduce exposure to single-point supply disruptions and can spread certification costs across broader product families, including IEC 62443 and ATEX/IECEx programs.
Competitive Landscape
The Industrial monitor market is moderately concentrated. The top five suppliers, Advantech, Siemens, Rockwell Automation, Schneider Electric, and Kontron, held around 38% share in 2025, with none above 12%. Competitive leverage centers on vertical integration and ecosystem bundling that locks customers into software and hardware suites. Advantech reported that 61% of 2025 display revenue came from clients purchasing three or more categories in its automation portfolio, highlighting the power of cross-selling.
Taiwanese and South Korean entrants are compressing margins in the 15-21 inch liquid-crystal segment by pricing 30% below incumbents. Tier-1 vendors respond by adding predictive maintenance analytics, cybersecurity-as-a-service, and embedded AI accelerators. Siemens filed 14 patents in 2025 covering display-mounted inference engines that process vision data locally, indicating a shift toward edge computing.
Certification remains a moat. IEC 62443-4-2 and ATEX Group IIC testing extends lead times by 18-24 months and costs USD 50,000 or more per model, excluding cybersecurity fees. Established firms with in-house labs clear these hurdles faster, keeping smaller challengers in lower-margin niches, such as e-paper or unconnected displays.
Industrial Monitor Industry Leaders
Advantech Co., Ltd.
Kontron S&T AG
ADLINK Technology Inc.
Siemens AG
Sparton LLC
- *Disclaimer: Major Players sorted in no particular order

Market Opportunities and Future Outlook
White space is most visible in monitors that reduce installation complexity while meeting industrial ruggedness and safety requirements. Single-cable connectivity is emerging as a practical differentiator for machine retrofits and mobile workstations, where fewer connectors lower failure points and speed commissioning. This direction is already visible in 2026 product refreshes that emphasize USB-C for video, touch, and power. Another opportunity is in long-distance visualization architectures, such as HMI placements that require extended runs across large factory layouts, where technologies like HDBase-T enable remote placement of operator displays without major control-cabinet redesign.
A second opportunity sits at the intersection of higher-performance visualization and edge computing. As inspection cells and smart-factory retrofits push more data to the shop floor, they increase demand for local, low-latency viewing. Evidence in the market includes Siemens expanding its Industrial Edge ecosystem at Hannover Messe 2026 to integrate data and AI workflows, which supports demand for monitors intended to pair with edge nodes and secure connectivity requirements. In parallel, the qualification and procurement process itself creates whitespace for suppliers that can shorten compliance cycles and offer pre-certified configurations aligned with the IEC 62368-1:2026 transition and the tightening EU machinery safety environment ahead of the 2027 applicability date.
Recent Industry Developments
- May 2026: Advantech updated documentation for its IDP31-156WC industrial touch monitor emphasizing a single USB-C cable for video, touch, and power. The design supports faster deployments in retrofits and reduces wiring complexity at operator stations where downtime and connector failures carry high cost.
- April 2026: Advantech announced the SPC-800 V2 HMI series, including monitor variants with HDBase-T 2.0 to extend signal transmission up to 100 meters. This expands placement flexibility for HMIs on large lines and supports centralized compute with distributed visualization across the factory floor.
- October 2025: Schneider Electric acquired ETIC Telecom for EUR 210 million (USD 223 million), adding rugged, railway-certified and MIL-STD-810 communications capabilities that complement harsh-environment visualization requirements. The move supports tighter integration of secure connectivity and monitoring hardware in industrial deployments where compliance and reliability drive vendor selection.


Research Methodology Framework and Report Scope
Market Definition and Coverage
This market covers revenues from industrial-grade monitors used to visualize and operate equipment in factory and process environments, including fixed installations and harsh-duty settings where reliability and long service life are required.
Scope exclusions: We exclude consumer monitors and general office displays that are not designed or specified for industrial operating conditions.
Segmentation Overview
- By Display Technology
- LCD
- LED
- OLED
- E-papers and Others
- By Screen Size
- Less than 12 Inch
- 12- 23 Inch
- 23- 32 Inch
- Greater than 32-inch
- By Mounting Type
- Panel-mount
- Rack-mount
- VESA/Arm-mount
- Open-frame/Chassis
- By End-Use Industry
- Automotive Manufacturing
- Oil and Gas
- Logistics and Transportation
- Medical and Healthcare
- Metals and Mining
- Food and Beverage
- Semiconductors and Electronics
- Other End-Use Industries
- By Geography
- North America
- United States
- Canada
- Mexico
- South America
- Brazil
- Argentina
- Rest of South America
- Europe
- Germany
- United Kingdom
- France
- Italy
- Spain
- Rest of Europe
- Asia-Pacific
- China
- Japan
- India
- South Korea
- ASEAN
- Rest of Asia-Pacific
- Middle East
- Saudi Arabia
- United Arab Emirates
- Rest of Middle East
- Africa
- South Africa
- Nigeria
- Rest of Africa
- North America
Data Sources, Market Sizing, and Validation
Desk Research
Desk research was used to set the base structure of the market and to anchor our assumptions around industrial production and automation demand. We reviewed public sources such as US Census manufacturing indicators, Eurostat industrial production series, UN Comtrade trade statistics for relevant electronics categories, and International Energy Agency data for process-industry activity signals. We also used standards and regulatory references (such as IEC testing and hazardous-area rules published by official bodies) to understand where industrial-grade specifications tend to be mandatory.
On the supply side, we screened company filings, annual reports, investor presentations, product catalogs, and reputable press to map product positioning across screen sizes, mounting formats, and industrial usage. Select paid subscriptions were used only for company financials and intelligence, patent databases, and shipment-level trade tracking where it helped sanity-check directional movements. The sources named here are illustrative only, and many other public materials were also consulted for data collection, validation, and clarification.
Primary Interviews and Surveys
Primary interviews and structured surveys were used to confirm what gets counted as an industrial monitor versus adjacent display products, and to stress-test pricing and replacement-cycle assumptions. We spoke with executives, product leaders, and operations managers across manufacturers, distributors, system integrators, and industrial end users, with coverage balanced across APAC, EMEA, and the Americas so regional mix effects were not missed.
Distribution of primary research fieldwork respondents
| Company type | Respondent position | Region |
|---|---|---|
| Top tier: 27% | CXOs: 18% | APAC: 37% |
| Mid tier: 53% | Functional/Unit leaders: 28% | EMEA: 37% |
| Smaller Players: 20% | Managers: 54% | Americas: 26% |
Market-Sizing & Forecasting
Sizing starts with a top-down build that reconstructs the addressable demand pool using industrial activity and automation adoption signals, then filters it based on where monitors are actually deployed. We translate this into value using a practical ASP-by-spec approach, and then corroborate the totals with selective bottom-up checks such as supplier revenue clustering, distributor channel checks, and sampled unit volumes by screen-size bands.
Key inputs in the model include industrial production trends, automation and control system deployments, screen-size mix shifts (for example, 12 to 23 inch versus larger panels), mounting-format preferences (panel, rack, VESA/arm, and open-frame), and ASP movement tied to brightness, touch capability, and ruggedized ratings. Where direct unit visibility is patchy, we handle gaps through conservative proxying from comparable industrial electronics categories and then correct it through interview feedback.
For forecasting, we use scenario analysis supported by regression-based sensitivity on industrial output and automation capex indicators, followed by analyst adjustments when primary inputs indicate timing changes. Once the base case is locked, growth is distributed across regions and common industrial use settings to keep the year-by-year path aligned with observed procurement cycles.
Data Validation & Update Cycle
Outputs are validated through multiple cross-checks, including comparing implied unit volumes and implied ASPs against what practitioners say is achievable in each region and industrial setting. Large variances are flagged, reworked, and then reviewed again by another analyst before sign-off, and follow-up outreach is triggered when a key assumption moves or a new data point contradicts the model.
The model and narrative are refreshed annually, and interim updates are made when material events shift supply, pricing, or industrial demand. Before delivery, we do a final pass to confirm the latest macro indicators, trade signals, and major announcements are reflected in the numbers clients receive.
Mordor Intelligence's Industrial Monitor Market Estimate Compared With Other Published Estimates
Published market values for industrial monitors often do not match because firms choose different product boundaries and different ways to convert units to revenue. Differences also come from the forecast window used, how fast ASPs are assumed to decline or stabilize, and whether adjacent categories get bundled into the same total.
In this study, the main spread usually comes from whether industrial displays, embedded HMI panels, and ruggedized field displays are all rolled into one number, and from how screen-size and mounting mix are treated when pricing is modeled. Currency timing and refresh cadence also matter, since older estimates can lag real pricing changes and industrial spending cycles.
Benchmark comparison
| Source | Market Size | Gaps in Research Methodology |
|---|---|---|
| Mordor Intelligence | USD 11.08 B (2025) | |
| Industry Publisher A | USD 5.80 B (2025) | Uses a narrower revenue pool that appears to treat the category closer to monitor-only shipments, with limited inclusion of open-frame and arm-mount industrial formats, and a longer-range forecast that can amplify growth assumptions. |
| Market Publisher B | USD 3.20 B (2025) | Defines the space closer to classic HMI monitor demand in manufacturing automation, which can exclude several end-use settings and premium industrial specifications that lift ASPs in broader industrial monitor deployments. |
The table shows that scope choices and pricing logic drive most of the differences in totals. When adjacent industrial display types are kept separate and ASP progression is tied to spec-level mix (not a single blended price), the 2025 total lands higher in a way that stays traceable to screen-size, mounting, and end-use checks applied by Mordor Intelligence.


Key Questions Answered in the Report
What was the Industrial monitor market size in 2026?
It reached USD 11.85 billion, with a projected rise to USD 15.74 billion by 2031.
Which screen size segment is growing fastest?
Displays larger than 32 inches are set to grow at a 20.66% CAGR between 2026 and 2031 due to use in automotive video walls.
Why are organic light-emitting diode panels gaining share?
They eliminate high-voltage backlights, easing ATEX Zone 1 compliance and improving contrast in surgical rooms.
Which region is expected to see the highest growth through 2031?
South America, backed by Brazil’s Rota 2030 automotive initiative and energy projects, is forecast to expand at a 22.44% CAGR.
How are cybersecurity rules affecting suppliers?
IEC 62443-4-2 certification adds up to USD 80,000 per model and extends development by about a year, favoring integrated vendors.
What is the main restraint on near-term supply?
Tight availability of industrial-grade TFT glass, with only three global suppliers, can stretch lead times to 18 weeks.
Page last updated on:





