
Technology, Media and Telecom
5th MayPricing Strategy for Semiconductor Components
3 Min Read
The Laboratory Electronic Balance Market Report is Segmented by Type (Analytical Balances, Precision Balances, and More), Capacity (Up To 50 G, 51-200 G, and More), Readability (0. 1 Μg, 1 Μg, and More), Connectivity Feature (Standalone, and More), End-User (Pharmaceutical and Biotechnology, Chemical Industry, Food and Beverage QC Labs, and More), and Geography. The Market Sizes and Forecasts are Provided in Terms of Value (USD).
Market Overview
| Study Period | 2020 - 2031 |
|---|---|
| Market Size (2026) | USD 0.9 Billion |
| Market Size (2031) | USD 1.11 Billion |
| Growth Rate (2026 - 2031) | 4.41 % CAGR |
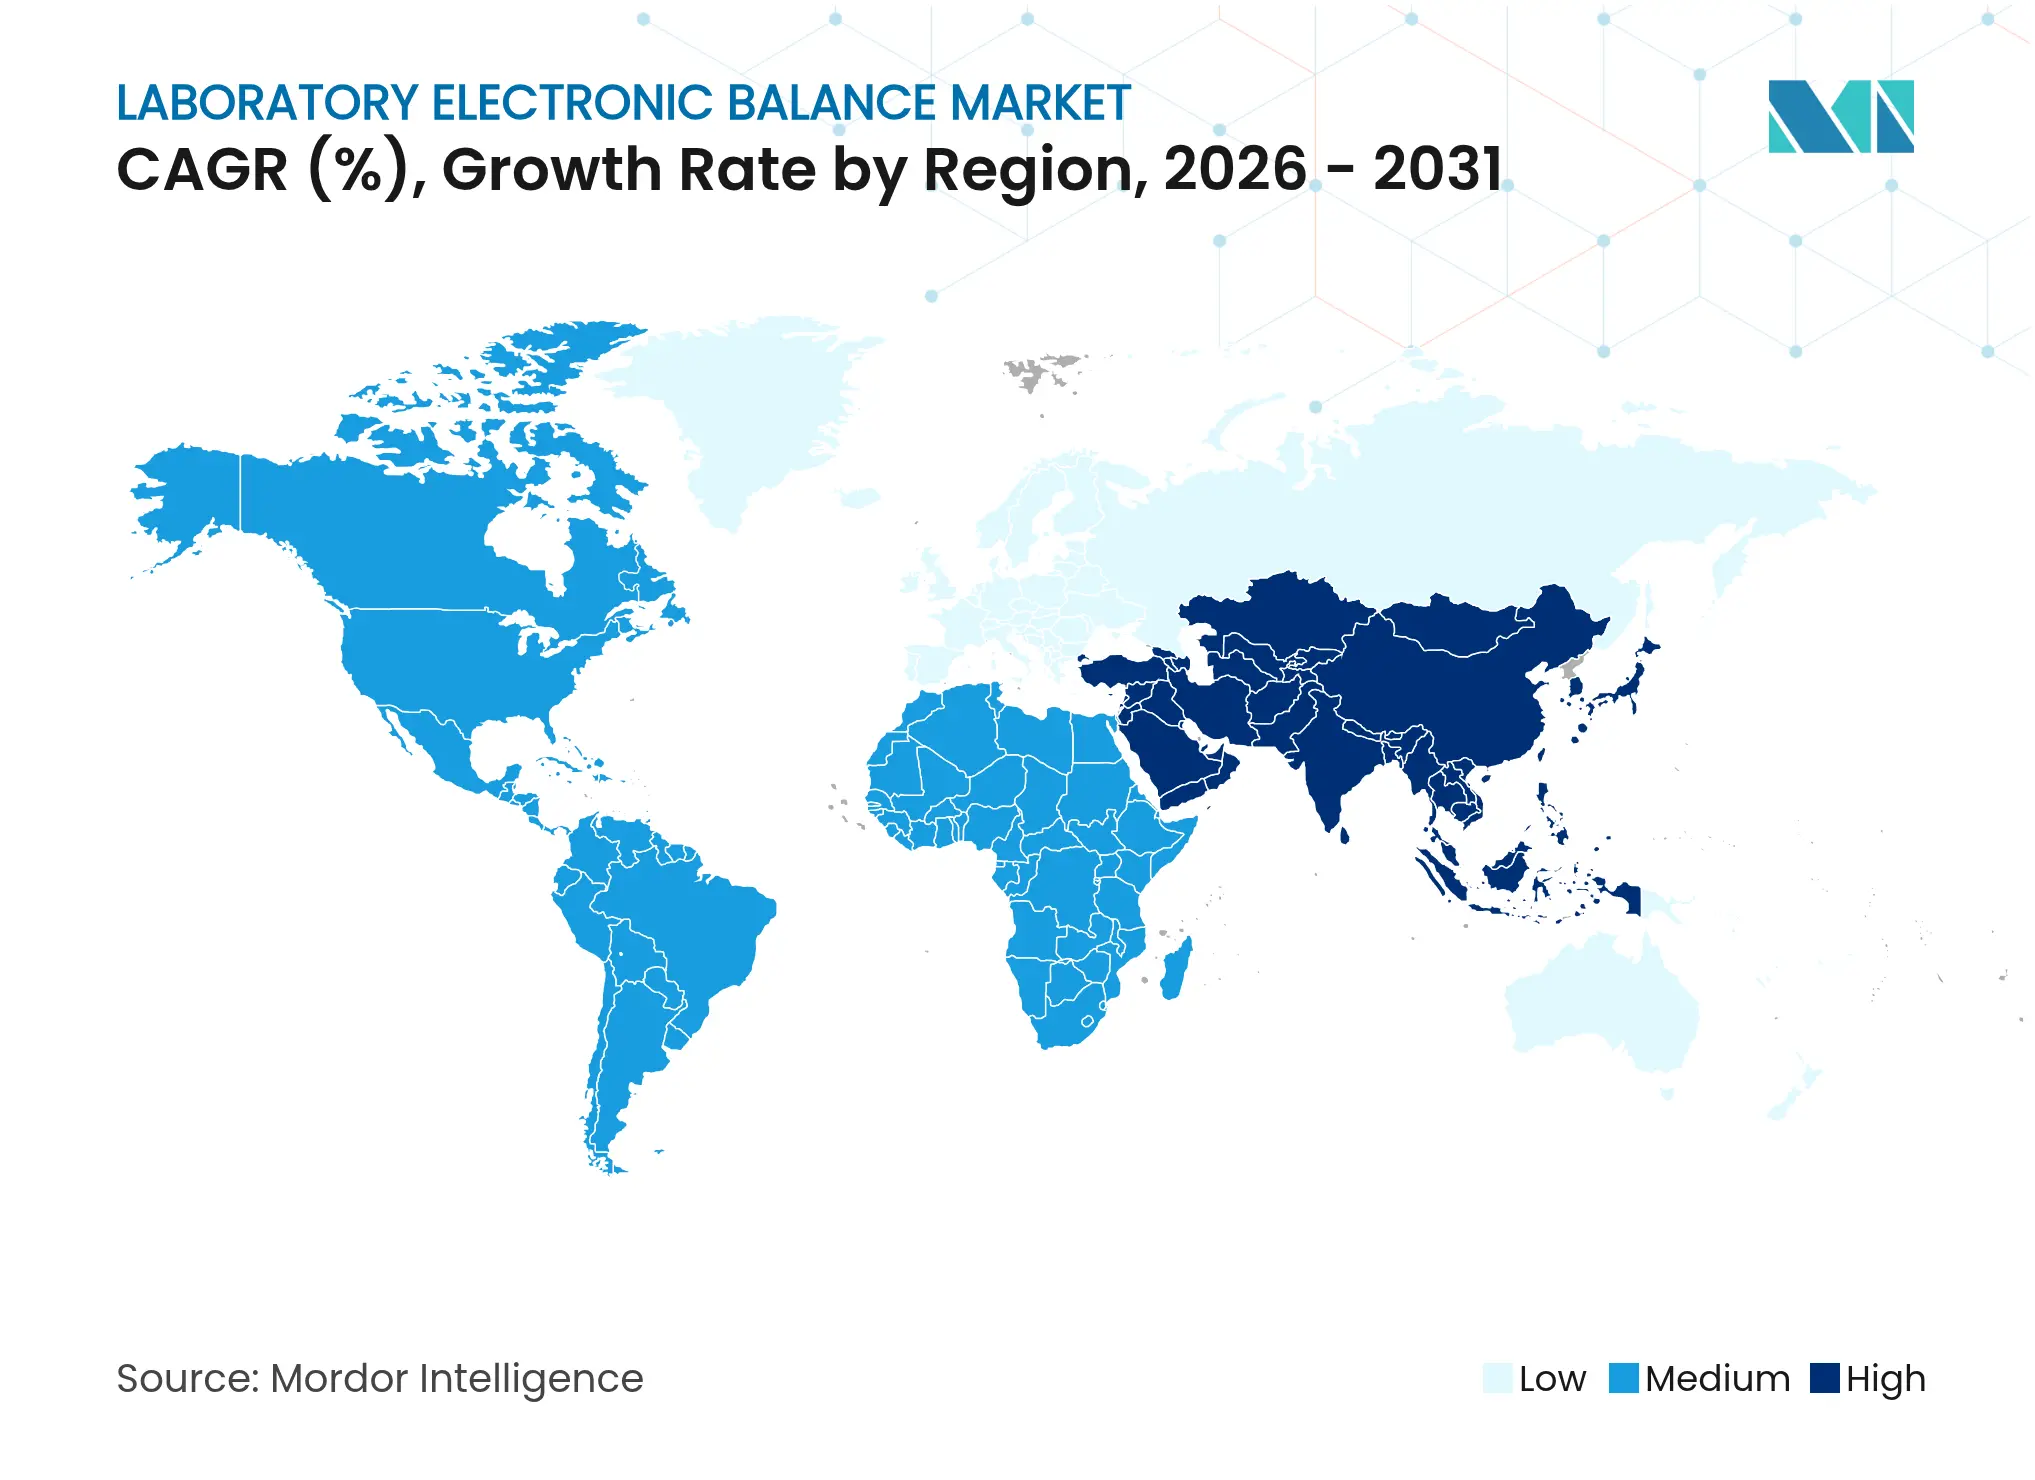
| Fastest Growing Market | Middle East and Africa |
| Largest Market | Asia Pacific |
| Market Concentration | Medium |
Major Players *Disclaimer: Major Players sorted in no particular order. Image © Mordor Intelligence. Reuse requires attribution under CC BY 4.0. |
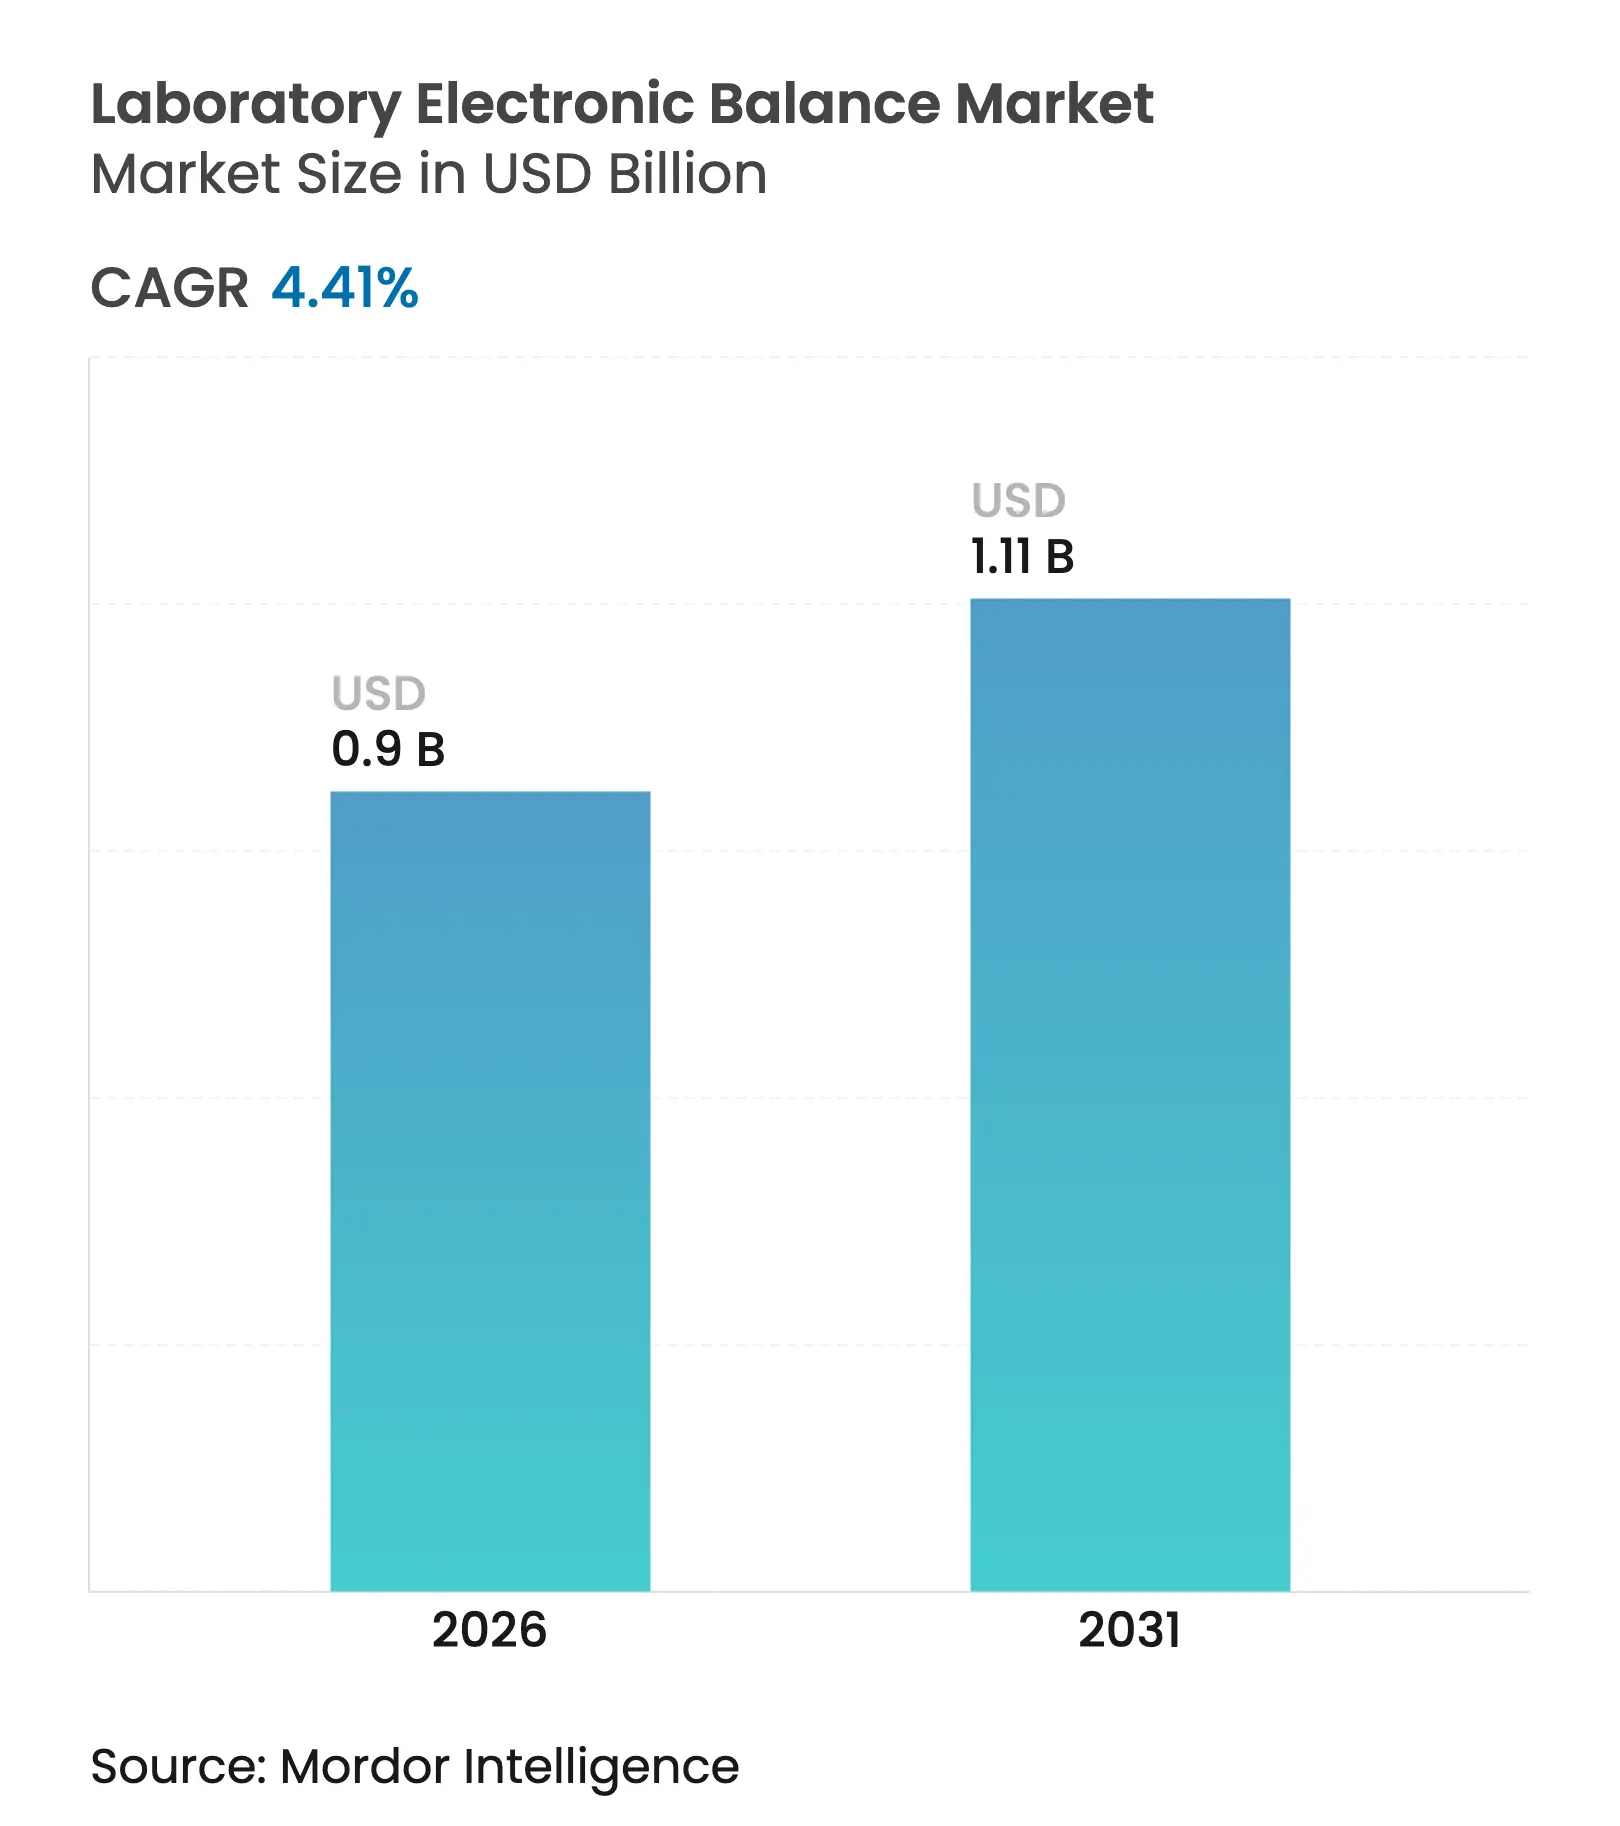
The laboratory electronic balance market size in 2026 is estimated at USD 0.9 billion, growing from 2025 value of USD 0.86 billion with 2031 projections showing USD 1.11 billion, growing at 4.41% CAGR over 2026-2031. Growth reflects continuing regulatory tightening, the rising complexity of biologic-drug and contaminant analyses, and accelerating demand for connected devices able to feed data directly into laboratory information systems. Analytical balances dominate because they match global pharmacopoeia and Good Manufacturing Practice requirements, while ultra-micro models grow the fastest as biologics, PFAS and trace-metal workflows demand microgram readability. Network-ready balances-especially Wi-Fi variants-are expanding quickly as laboratories roll out Internet-of-Laboratory Things (IoLT) infrastructure to eliminate manual transcription and enable predictive maintenance. Even so, multi-site calibration costs, price competition from low-cost Asian entrants and electromagnetic interference inside Industry 4.0 factories temper adoption among budget-constrained labs.
Key Report Takeaways
Note: Market size and forecast figures in this report are generated using Mordor Intelligence's proprietary estimation framework, updated with the latest available data and insights as of 2026.
Drivers Impact Analysis
| Driver | (~) % Impact on CAGR Forecast | Geographic Relevance | Impact Timeline | |||
|---|---|---|---|---|---|---|
Stringent GMP and Pharmacopoeia-based Weighing Compliance in Pharma Labs Stringent GMP and Pharmacopoeia-based Weighing Compliance in Pharma Labs | +1.2% | Global, with concentration in North America & EU | Medium term (2-4 years) | (~) % Impact on CAGR Forecast:+1.2% | Geographic Relevance:Global, with concentration in North America & EU | Impact Timeline:Medium term (2-4 years) |
IoT-Enabled Smart Labs Driving Demand for Networked Balances IoT-Enabled Smart Labs Driving Demand for Networked Balances | +0.8% | APAC core, spill-over to North America | Long term (≥ 4 years) | |||
Cannabis Testing Lab Expansion across North America Fueling Precision Balance Sales Cannabis Testing Lab Expansion across North America Fueling Precision Balance Sales | +0.3% | North America, with early gains in California, Colorado, New York | Short term (≤ 2 years) | |||
High-Value Biologic Drug Formulations Requiring Ultra-Microgram Weighing High-Value Biologic Drug Formulations Requiring Ultra-Microgram Weighing | +0.7% | Global, with concentration in US, Germany, Switzerland | Medium term (2-4 years) | |||
PFAS and Emerging Contaminant Regulations Boosting Environmental Testing Needs PFAS and Emerging Contaminant Regulations Boosting Environmental Testing Needs | +0.4% | Global, with early implementation in US & EU | Medium term (2-4 years) | |||
Decentralized Food and Beverage QC Labs in Asia Increasing Portable Balance Adoption Decentralized Food and Beverage QC Labs in Asia Increasing Portable Balance Adoption | +0.5% | APAC, with concentration in China, India, Southeast Asia | Long term (≥ 4 years) | |||
| Source: Mordor Intelligence | ||||||
Stringent GMP and pharmacopoeia weighing rules
Newly aligned FDA 21 CFR Part 11 and EU Annex 11 guidance obliges laboratories to secure electronic records and audit trails, making compliance-ready analytical balances indispensable.[1]Food and Drug Administration, “21 CFR Part 11 Subpart B — Electronic Records,” ecfr.govEurope’s Pharmacopoeia Chapter 2.1.7, effective since 2022, reinforced mandatory routine testing and calibration, further pushing upgrades toward devices with built-in test routines and electronic signatures.[2]Sartorius, “Use of Laboratory Balances in the Pharmaceutical Industry,” sartorius.com The proposed USP <1058> lifecycle-qualification update, open for comment until mid-2025, expands this requirement to continuous verification, encouraging purchases of balances with predictive-maintenance analytics. As a result, procurement plans increasingly specify automated internal adjustment, electronic signatures and CFR-compliant software modules.
IoT-enabled smart-lab adoption
The shift toward fully digital laboratories is accelerating. Wi-Fi-enabled balances transmit results directly to laboratory execution systems, trimming transcription labor and minimizing data-integrity deviations. Predictive-maintenance dashboards harness balance-generated sensor streams to flag drift or overload events before they trigger out-of-spec results, improving uptime. Continuous IoT monitoring has become central to 24/7 facility management, with early-warning alerts guarding against humidity or vibration spikes that compromise precision. Research on self-driving laboratories, which couple robotic sample handling with autonomous weighing steps, has multiplied since 2019, underscoring the long-term upside for connected balances.
Cannabis-testing lab rollout
NIST released hemp reference material RM 8210 in 2024, standardizing THC/CBD quantification and catalyzing a surge in accredited cannabis-testing laboratories.[3]National Institute of Standards and Technology, “NIST’s New Hemp Reference Material,” nist.gov Potency and contaminant workflows rely on milligram readability with anti-static shielding, prompting many labs to upgrade existing balances. Manufacturers now market complete cannabis workflow kits-Mettler-Toledo’s solution pairs solvent-resistant pans with embedded SOP guidance, showcasing niche-specific differentiation.[4]Mettler-Toledo International Inc., “10 Reasons Why It’s Crucial to Calibrate Laboratory Equipment,” mt.com Expanding state-level legalization and looming U.S. federal harmonization underpin near-term shipment gains.
High-value biologic drug formulations
Potent biologics demand weighing at microgram scale to maintain dose accuracy. The FDA’s Essential Drug Delivery Outputs draft emphasizes quantifiable precision across device-drug systems, tightening balance performance specifications. Ultra-micro models with 0.1 µg readability, such as Mettler-Toledo’s XPR line, integrate climate-controlled chambers to mitigate buoyancy and static forces. As cell- and gene-therapy pipelines lengthen, more R&D groups adopt these premium platforms, sustaining the fastest‐growing product niche through 2030.
Restraints Impact Analysis
| Restraint | (~) % Impact on CAGR Forecast | Geographic Relevance | Impact Timeline | |||
|---|---|---|---|---|---|---|
Escalating Multi-site Calibration Costs and Downtime Escalating Multi-site Calibration Costs and Downtime | -0.6% | Global, with higher impact in multi-national pharma operations | Short term (≤ 2 years) | (~) % Impact on CAGR Forecast:-0.6% | Geographic Relevance:Global, with higher impact in multi-national pharma operations | Impact Timeline:Short term (≤ 2 years) |
Price Erosion from Low-cost Entrants in East Asia Price Erosion from Low-cost Entrants in East Asia | -0.4% | Global, with concentration in price-sensitive markets | Medium term (2-4 years) | |||
Electromagnetic Interference within Industry 4.0 Factories Affecting Accuracy Electromagnetic Interference within Industry 4.0 Factories Affecting Accuracy | -0.3% | Industrial manufacturing hubs in Germany, China, US | Long term (≥ 4 years) | |||
Data-Integrity and 21 CFR Part 11 Compliance Barriers for Legacy Labs Data-Integrity and 21 CFR Part 11 Compliance Barriers for Legacy Labs | -0.5% | North America & EU, with concentration in smaller labs | Medium term (2-4 years) | |||
| Source: Mordor Intelligence | ||||||
Escalating multi-site calibration costs
Calibration and routine testing can consume 15-25% of a balance’s five-year ownership cost, and multinational pharmaceutical groups operate hundreds of units across dispersed sites. Service downtime directly delays batch release and R&D timelines. Global service firms such as Trescal have expanded through acquisitions to shorten on-site response and lower mean time-to-calibrate, yet laboratories still cite budget constraints as their top hurdle in adopting next-generation balances.
Price erosion from low-cost Asian entrants
Basic analytical balances sourced from emerging Asian vendors undercut premium brands by 20-40%. For laboratories that only need 0.1 g to 0.01 mg readability and have limited regulatory exposure, cut-price models are tempting. However, pharmaceutical and biotech buyers typically reject these options because they lack comprehensive ISO-17025 calibration, electronic-signature support and global service coverage. As a result, price pressure is felt most in industrial QA and academic segments, where substitution risk remains elevated.
By Type: analytical leadership, ultra-micro momentum
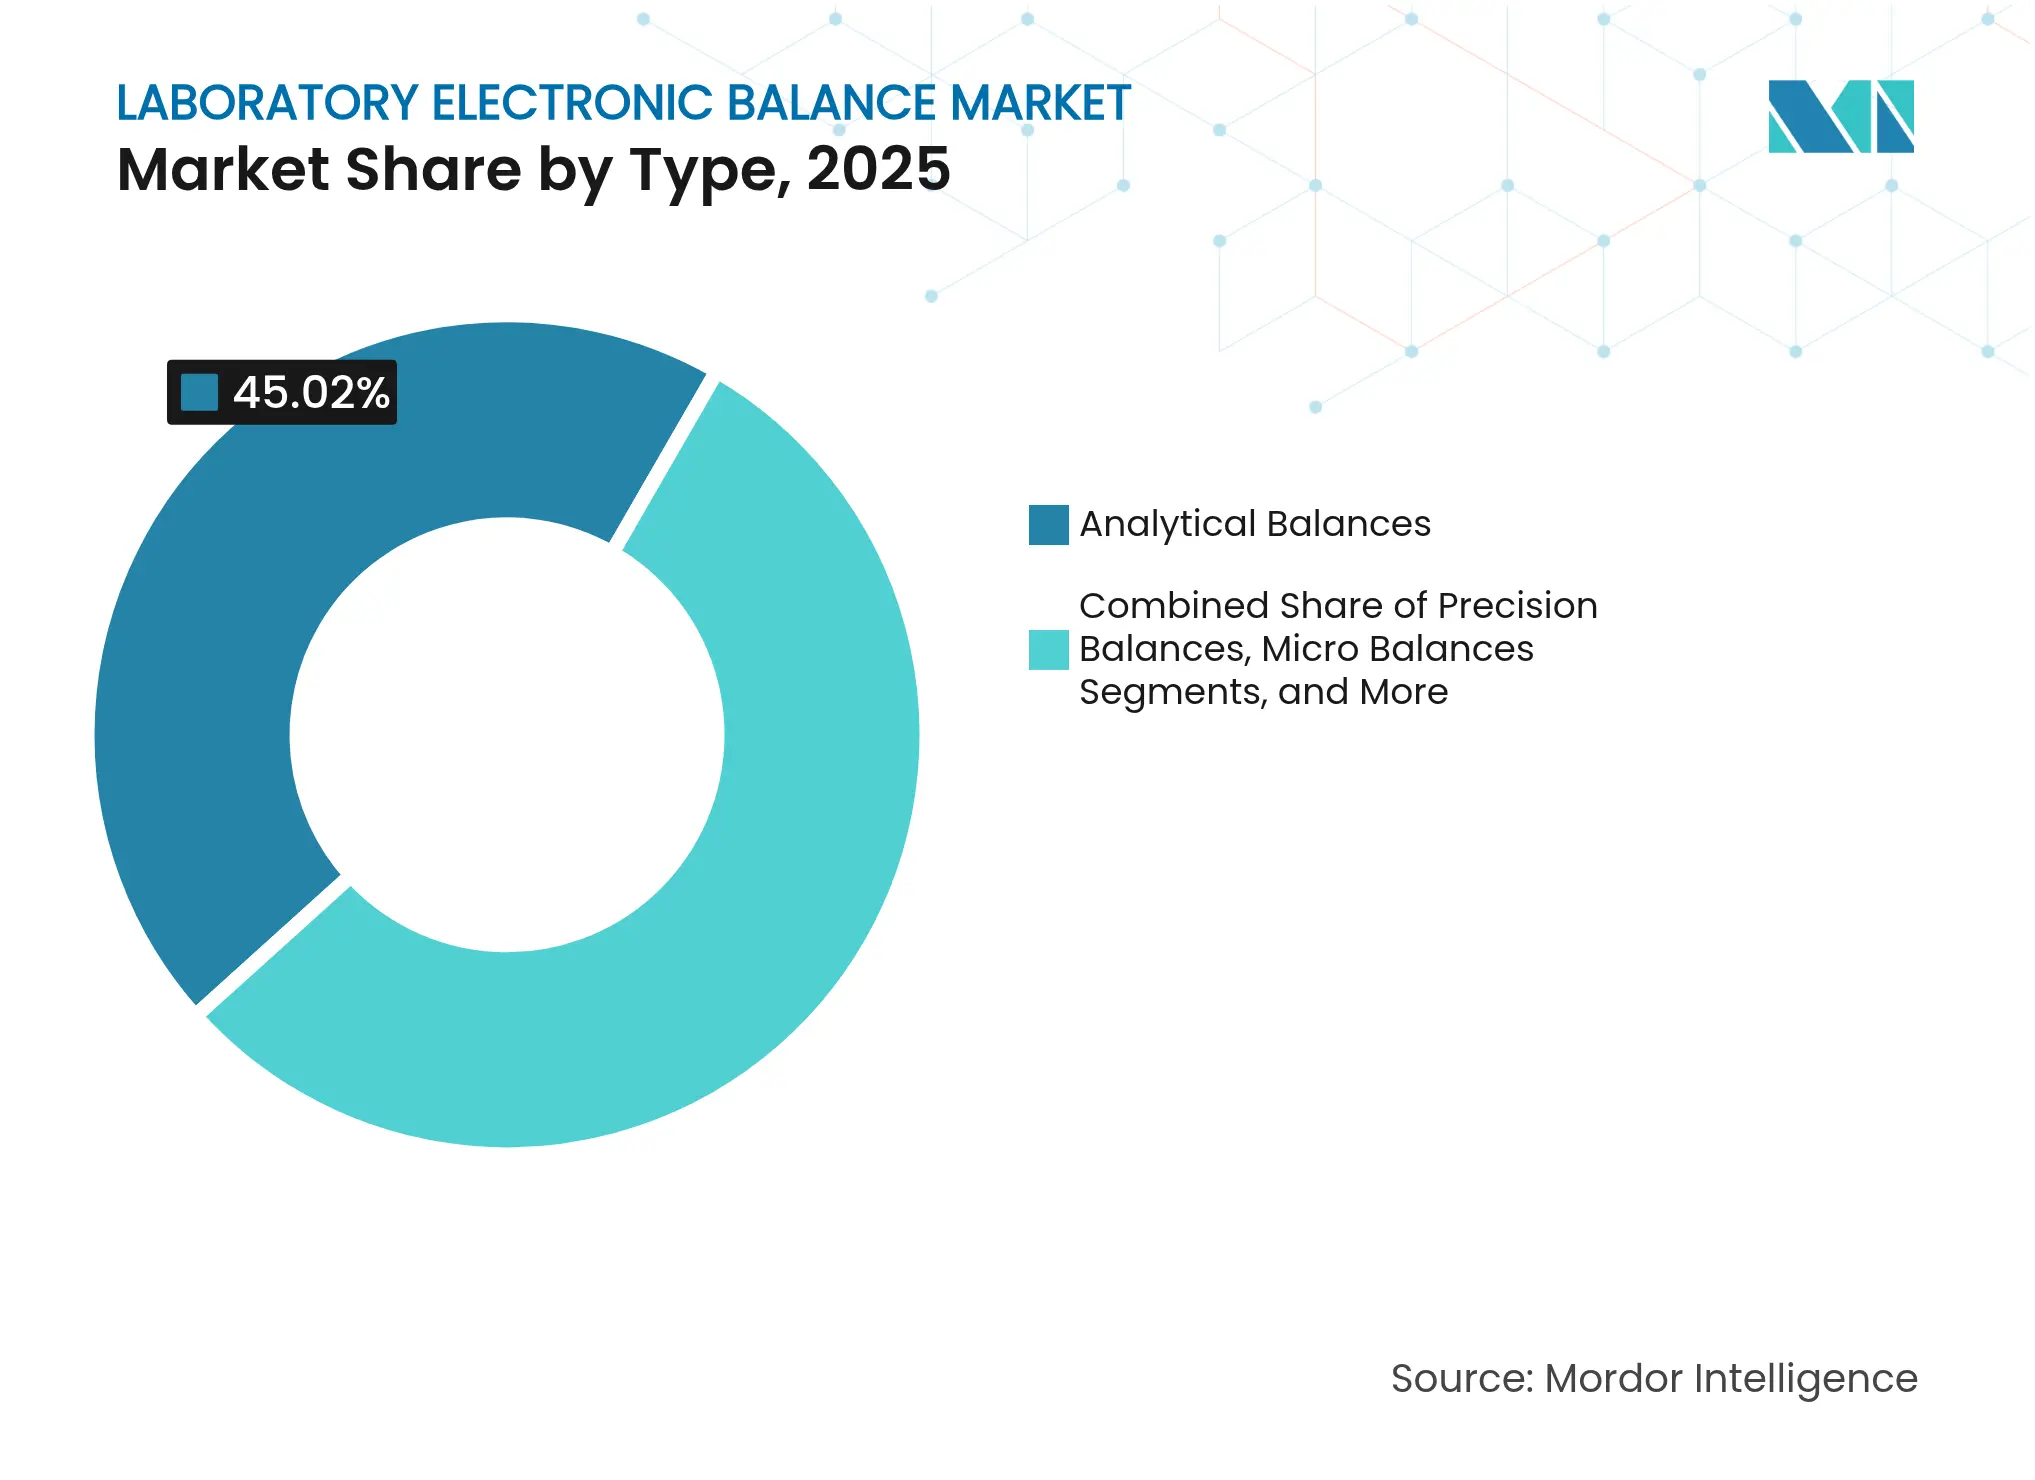
Analytical balances contributed USD 0.39 billion in 2025, translating into 45.02% of laboratory electronic balance market share. They remain the workhorse for GMP-mandated ingredient weighing, finished batch testing and academic research. Demand is sticky because any deviation from validated equipment triggers re-qualification costs. Ultra-micro instruments, while representing a smaller revenue base, post a 5.69% CAGR, fueled by biologics and PFAS studies that require 0.1 µg precision. Manufacturers now bundle protective anti-vibration tables, climate enclosures and software wizards into these top-end packages. Mettler-Toledo’s XPR Automatic platform demonstrates where the segment is heading: automated dosing of up to 288 samples with full CFR-compliant audit trails.
Competition among type categories is intensifying. Precision models (1 mg readability) hold a solid foothold in industrial QA, but compact or portable balances see tailwinds in decentralized lab networks and field operations. Laboratory electronic balance market size for compact units is benefiting from food-and-beverage QC teams that test raw materials nearer to suppliers to expedite release cycles. Micro balances continue to win specialized slots such as emissions testing, where samples may weigh below 10 mg yet still dictate regulatory compliance.
Note: Segment shares of all individual segments available upon report purchase
By Capacity: mid-range dominance with micro-capacity spike
Balances supporting 51-200 g loads commanded 37.72% share in 2025, as formulations rarely exceed 100 g yet still demand sub-milligram precision. Their versatility also aligns with chemical synthesis workflows where reagent quantities fall inside this bracket. In contrast, up-to-50 g devices-essentially ultra-micro and micro categories-are clocking a 5.99% CAGR to 2031. This surge parallels growth in high-potency API studies, where available material is inherently scarce. Laboratory electronic balance market size for the micro-capacity class is therefore expanding faster than any other capacity cohort. Sartorius’s Cubis II range showcases capacities down to 2 g coupled with 0.1 µg readability, pushing adoption in early-stage discovery groups.
Higher-capacity devices above 500 g retain importance for bulk excipient batching and battery-material testing, but their growth is modest because lower-cost floor scales can meet tolerance requirements. Still, some device makers are integrating higher-capacity load cells with analytical-grade readability so a single unit can weigh both reference standards and bulk powders, reducing bench-space constraints in crowded labs.
By Readability: 0.1 mg standard, 0.1 µg frontier
Balances offering 0.1 mg readability generated 40.18% of 2025 revenue and will remain the default for GMP-governed weighing. They satisfy USP and Ph. Eur minimum-weight calculations while ensuring auditability. Yet the 0.1 µg segment is on a 6.25% CAGR path because biologic R&D, trace-metal analysis and semiconductor-chemical QC all call for deeper precision. Laboratory electronic balance market size attributable to 0.1 µg devices will therefore outpace the broader market. Equipment makers are responding with enhanced draft shields, ionizers and machine-learning drift compensation.
Segments with 1 mg and 0.01 mg readability serve academic teaching labs and pilot plants; demand here tracks capex cycles rather than regulatory change. Conversely, the 1 µg niche, though small, is expanding inside cleanrooms where airborne particulate budgets are minimal and even a microgram of residue may jeopardize yield.

Recognized by Experts. Trusted by Leaders.
A trusted intelligence partner to global decision-makers across 90+ countries.


By Connectivity Feature: digital tipping point
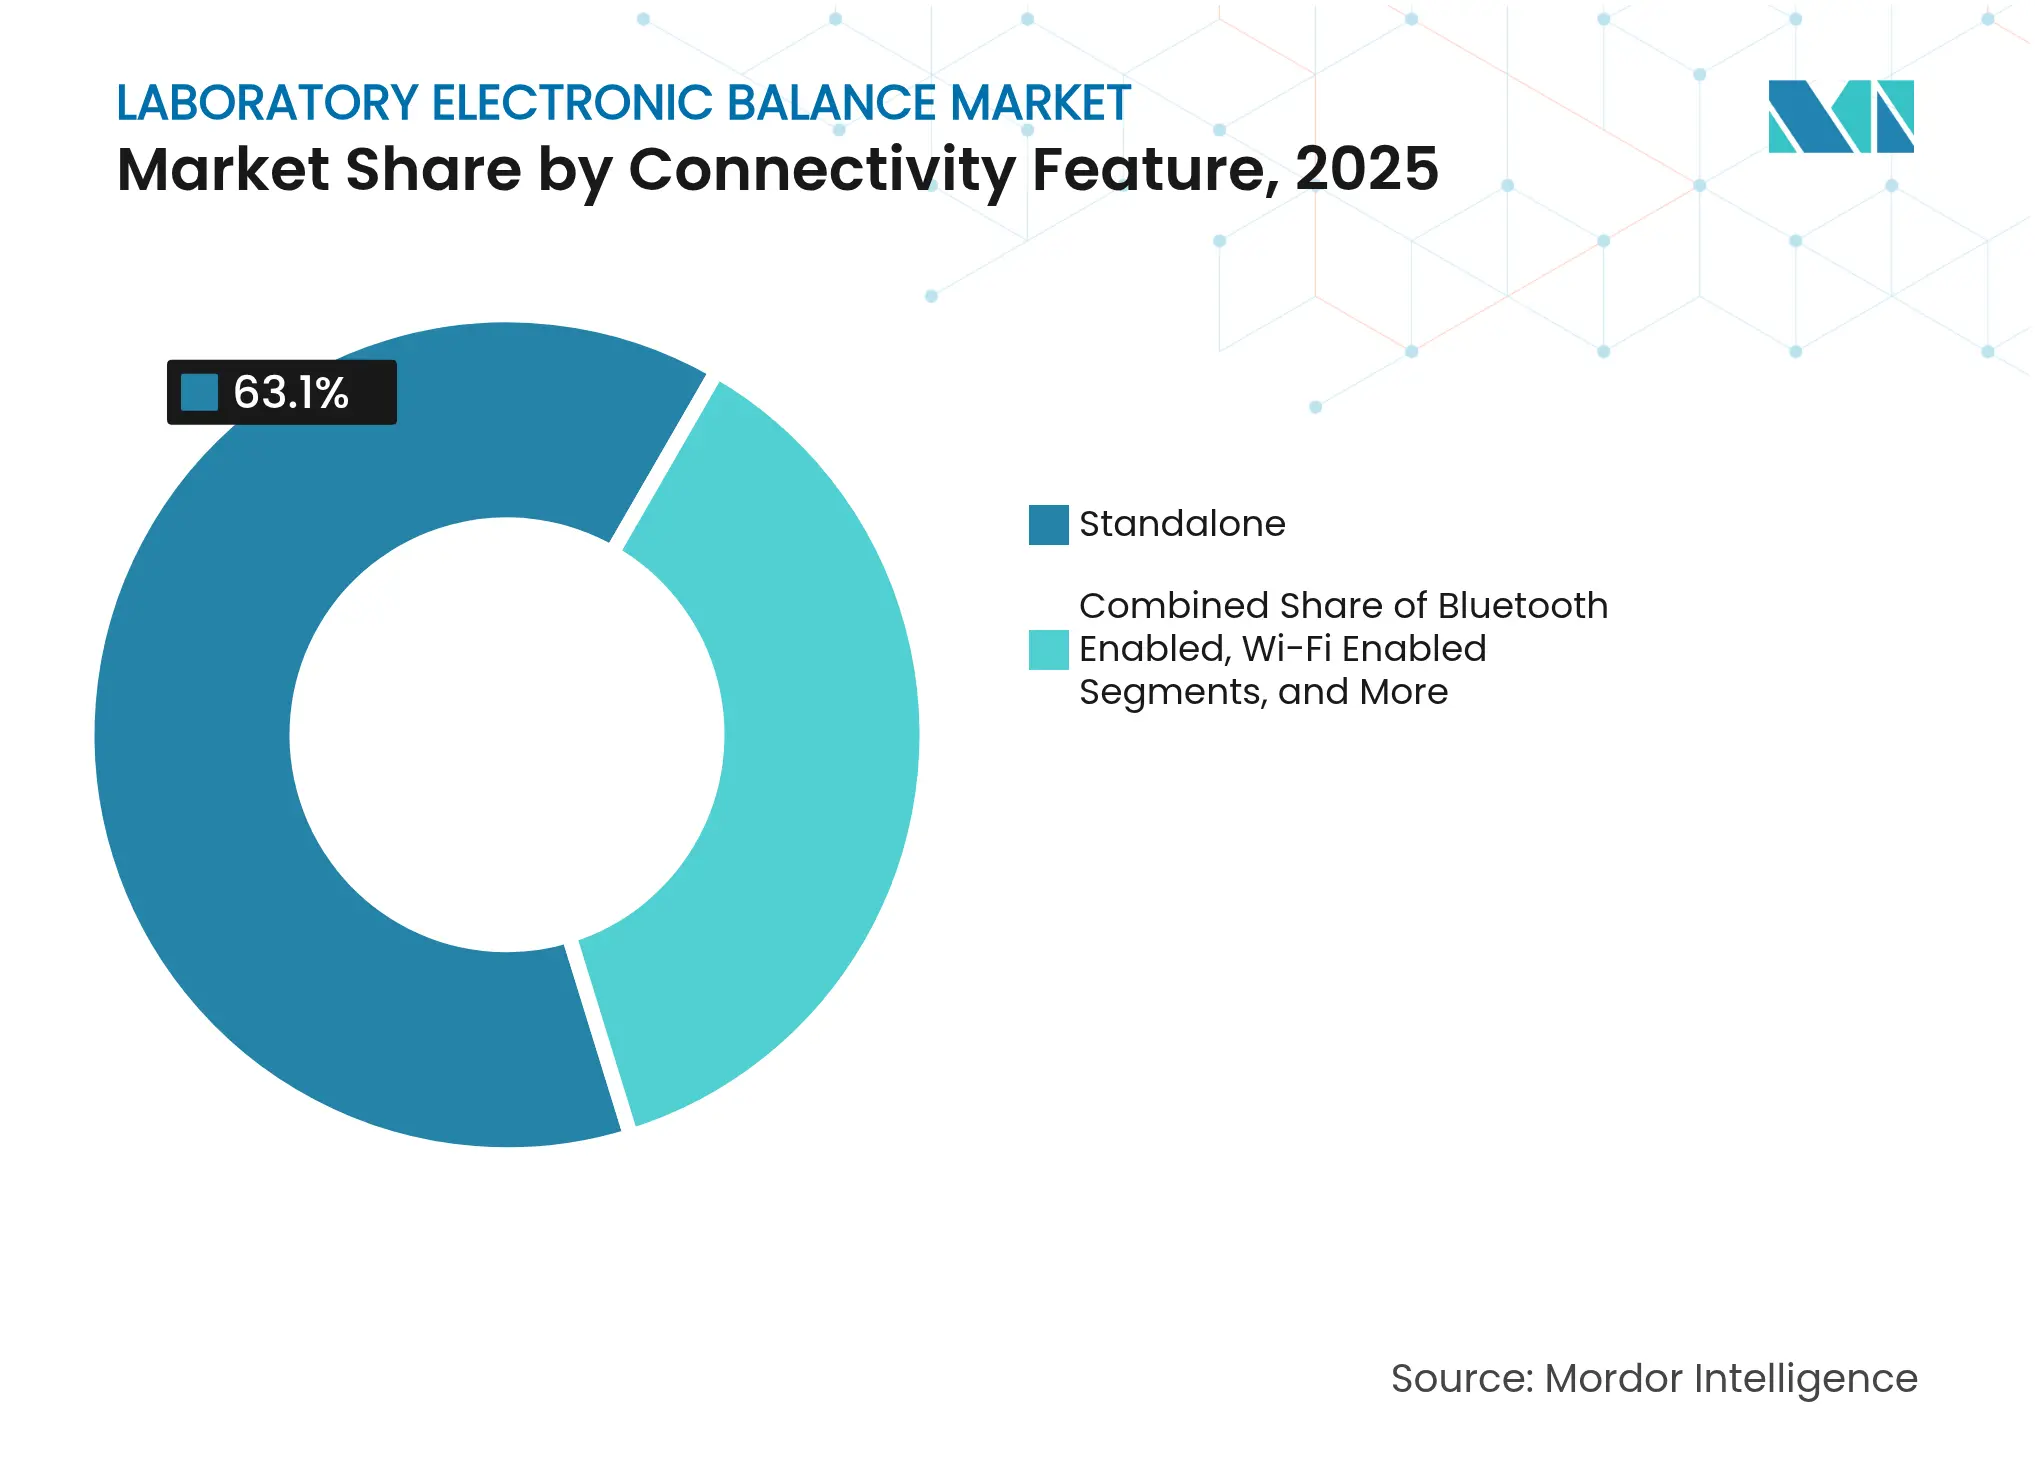
Standalone instruments still represent 63.10% of 2025 shipments, reflecting the installed base of legacy workflows. However, Wi-Fi-enabled models are growing at 6.64% CAGR as lab managers push for end-to-end electronic recordkeeping. Laboratory electronic balance market share attributable to connected devices will therefore climb every year of the forecast period. Bluetooth and USB variants satisfy moderate integration needs where direct LIMS upload is optional. Ethernet-ready models prevail in regulated pharma plants because hard-wired connections ease cybersecurity audits.
Manufacturers differentiate via open-API SDKs that let balances interface with robotic arms and MES software. Mettler-Toledo offers RS-232, USB, LAN, Bluetooth and WLAN in a single chassis, simplifying global SKU management. Smaller vendors compete by bundling cloud dashboards that aggregate multi-site weight logs for statistical process control.
Note: Segment shares of all individual segments available upon report purchase
By End-user: pharma leadership, environmental surge
Pharmaceutical and biotechnology labs held 32.55% of 2025 revenue, a function of GMP auditing rigor and high mix of analytical test points. They specify CFR-compliant audit trails, automated internal calibration and IQ/OQ documentation, making them the most lucrative segment for premium vendors. Environmental testing outfits show the fastest 5.11% CAGR as PFAS regulations force labs to detect contaminants at ng/L levels, pushing demand for balances that secure sub-mg measurement uncertainty. The laboratory electronic balance market size in environmental labs will therefore widen faster than the global average.
Academic institutions, food-and-beverage plants, chemical producers and forensic labs create a diverse tail of demand. Food labs in Asia have started installing portable balances to decentralize raw-material QC; forensic labs rely on anti-static micro balances to differentiate hemp from marijuana as legalization expands. Each sub-segment values specific features, but all converge on traceable data output, indicating long-term alignment with connected-device roadmaps
Asia-Pacific generated 29.35% of worldwide revenue in 2025, and national investments in pharmaceutical manufacturing keep the region in a leadership position. China’s push for self-reliant drug supply and India’s contract research growth guarantee recurrent balance demand. Shimadzu’s decision to build an analytical-instrument factory in Karnataka underscores the strategic shift toward local production as a hedge against logistics risk. Japan sustains a steady replacement cycle for ultra-micro balances used in specialty-chemical R&D. Southeast Asian labs spearheading decentralized QC in packaged foods increasingly install portable units that can be field-deployed.
North America ranks second, anchored by the United States’ biologic-drug pipeline and expanding cannabis-testing footprint. FDA Part 11 enforcement drives upgrades to audit-ready balances, especially as the agency’s January 2025 draft guidance raises the bar on statistical process control. NIST’s hemp reference materials further standardize weight-based potency testing, solidifying milligram-precision demand. Canada adds stable replacement revenues, while Mexico’s new Shimadzu subsidiary expands local service capability ahead of a planned 2025 demo lab launch.
Europe remains a mature, compliance-driven landscape. The Pharmacopoeia’s calibration rules ensure continuous purchases of balances with internal test weights and audit-ready firmware. Germany’s chemical majors and the United Kingdom’s biotech clusters stress ultra-micro readability; Nordic countries emphasize environmental monitoring. Meanwhile, the Middle East & Africa is on a 5.02% CAGR trajectory through 2031 as regional governments bankroll R&D hubs to diversify economies. Growing laboratory infrastructure in the Gulf states stimulates first-time purchases of analytical balances equipped with remote-service diagnostics to offset local skill shortages.
Market Concentration
The laboratory electronic balance market features moderate concentration. Mettler-Toledo captured the largest share in 2024, posting USD 3.788 billion total revenue with laboratory instruments contributing around 55%. Its Good Weighing Practice training program and worldwide service hubs underpin customer retention. Sartorius competes on modularity: the Cubis II platform lets users configure display, draft shield and connectivity options while holding full Part 11 compliance. A&D Company and OHAUS focus on price-performance niches, whereas Shimadzu leverages local manufacturing in India and Mexico to shorten delivery times.
Product innovation centers on automation and connectivity. Mettler-Toledo’s automatic weighing module dispenses powders directly into tare-weighed vials, cutting operator exposure to potent compounds and delivering 288 sample runs per batch. Sartorius introduced integrated ionizers and climate logging for its ultra-high-resolution models to neutralize static in less-controlled environments. Wi-Fi and cloud APIs are emerging as differentiators as procurement teams insist on plug-and-play LIMS integration rather than bespoke middleware.
Pricing pressure is most acute in entry-level segments where new Asian suppliers compete primarily on cost. Yet premium applications shield leading brands because validated processes, global calibration support and audit-grade firmware act as switching barriers. Service expansion remains a strategic lever: Trescal’s multi-country acquisitions aim to provide faster on-site calibration for top pharma clients, indirectly supporting premium vendors by reducing downtime linked to accredited service. Vendors investing in open APIs, predictive maintenance and regional service infrastructure are positioned to defend share against low-cost challengers.

*Disclaimer: Major Players sorted in no particular order
1. INTRODUCTION
2. RESEARCH METHODOLOGY
3. EXECUTIVE SUMMARY
4. MARKET LANDSCAPE
5. MARKET SIZE AND GROWTH FORECASTS (VALUES)
6. COMPETITIVE LANDSCAPE
7. MARKET OPPORTUNITIES AND FUTURE OUTLOOK
Electronic balances and essential lab equipment accurately measure material weights. They are designed for portability and are widely utilized in scientific and pharmaceutical research, bakeries, and chemical labs. Their rechargeable, battery-powered nature enhances user convenience. The study monitors the revenue generated from selling various laboratory electronic balances provided by several leading vendors and used across various applications. It also explores the market's driving forces, constraints, and growth patterns in emerging economies while considering geopolitical and macroeconomic impacts.
The laboratory electronic balance market is segmented by type (analytical balance, precision balance, compact balance, and other types), end-user vertical (pharmaceutical, food and beverage, chemical, biotechnology, and other end-user verticals), and geography (North America, Europe, Asia-Pacific, and Rest of the World). The market sizes and forecasts are provided in terms of value (USD) for all the above segments.
Pricing Strategy for Semiconductor Components
3 Min Read
Accelerating Additive Manufacturing Adoption in India
3 Min Read
When decisions matter, industry leaders turn to our analysts. Let’s talk.