Industrial Display Market Size and Share
Market Overview
| Study Period | 2020 - 2031 |
|---|---|
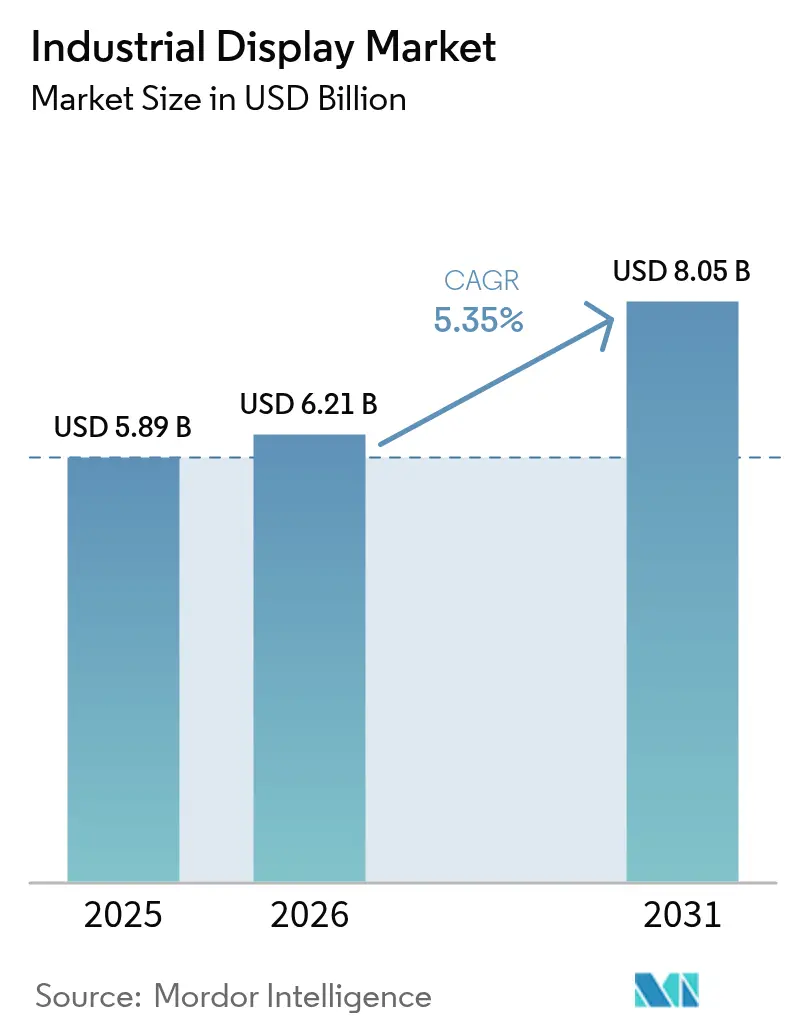
| Market Size (2026) | USD 6.21 Billion |
| Market Size (2031) | USD 8.05 Billion |
| Growth Rate (2026 - 2031) | 5.35% CAGR |
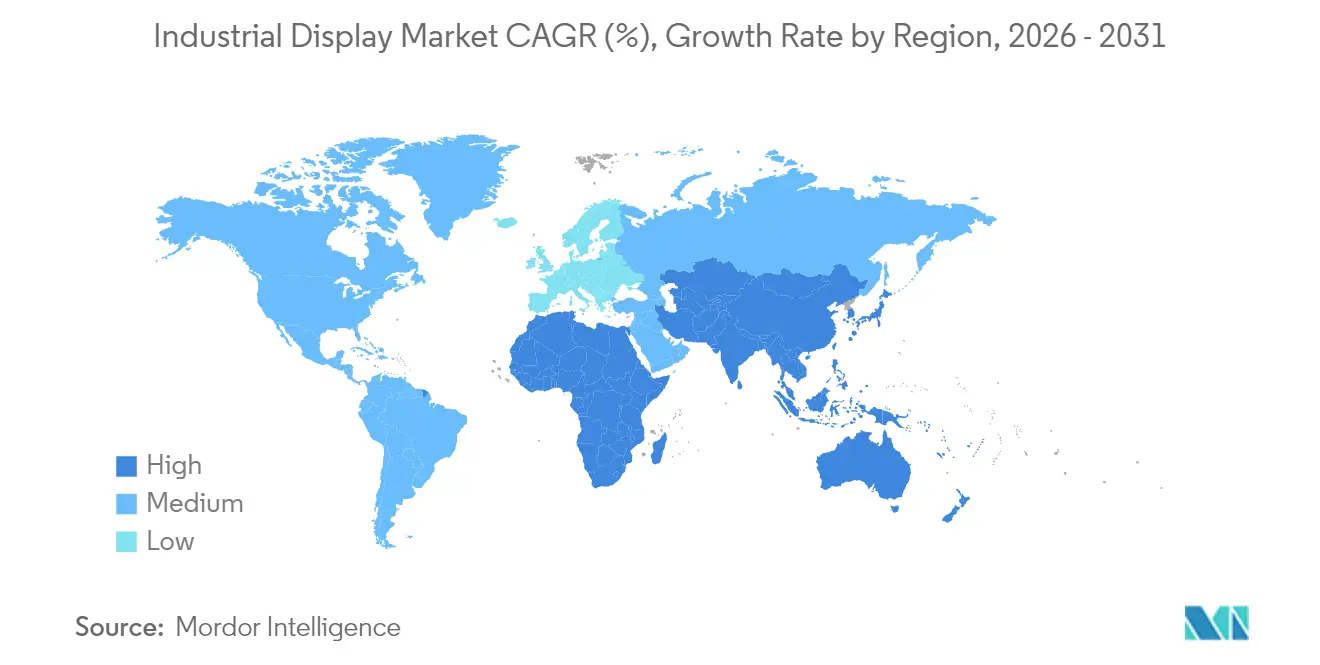
| Fastest Growing Market | Middle East and Africa |
| Largest Market | Asia Pacific |
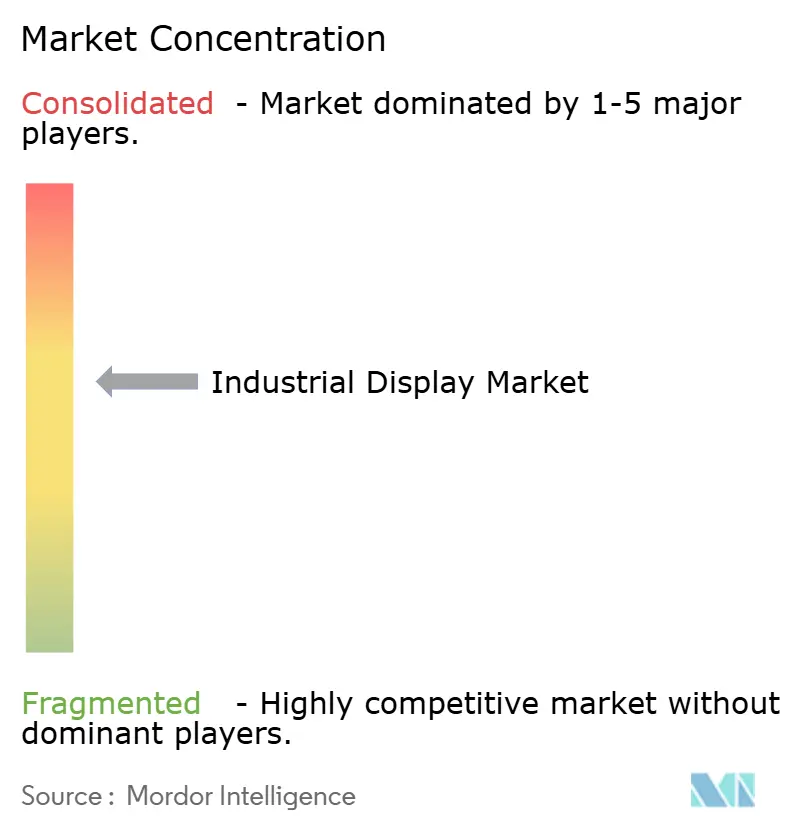
| Market Concentration | Medium |
Major Players *Disclaimer: Major Players sorted in no particular order Image © Mordor Intelligence. Reuse requires attribution under CC BY 4.0. | |
Industrial Display Market Analysis by Mordor Intelligence
Industrial display market size in 2026 is estimated at USD 6.21 billion, growing from 2025 value of USD 5.89 billion with 2031 projections showing USD 8.05 billion, growing at 5.35% CAGR over 2026-2031. Operators are moving from basic read-outs to multi-layered visualization hubs that connect plant-floor assets, edge gateways and cloud analytics platforms. Human-machine interface (HMI) consoles continue to dominate procurement, yet remote asset and pipeline visualization is scaling the fastest as energy firms centralize oversight of dispersed infrastructure. LCD panels preserve cost leadership, while OLED and AMOLED modules post the quickest growth as control rooms demand lower power draw and superior contrast for round-the-clock duty. Semiconductor shortages lengthen LCD controller lead times, pushing integrators to diversify technology roadmaps and pursue strategic component reserves. Regionally, Asia-Pacific leverages economies of scale in component fabrication, whereas the Middle East and Africa accelerates capital expenditure on explosion-proof visualization for oil and gas megaprojects.
Key Report Takeaways
- By application, HMI consoles held 46.05% of the industrial display market share in 2025; remote asset and pipeline monitoring is forecast to expand at a 6.12% CAGR through 2031.
- By technology, LCD maintained 61.45% revenue share in 2025, while OLED/AMOLED is projected to grow at 6.78% CAGR to 2031.
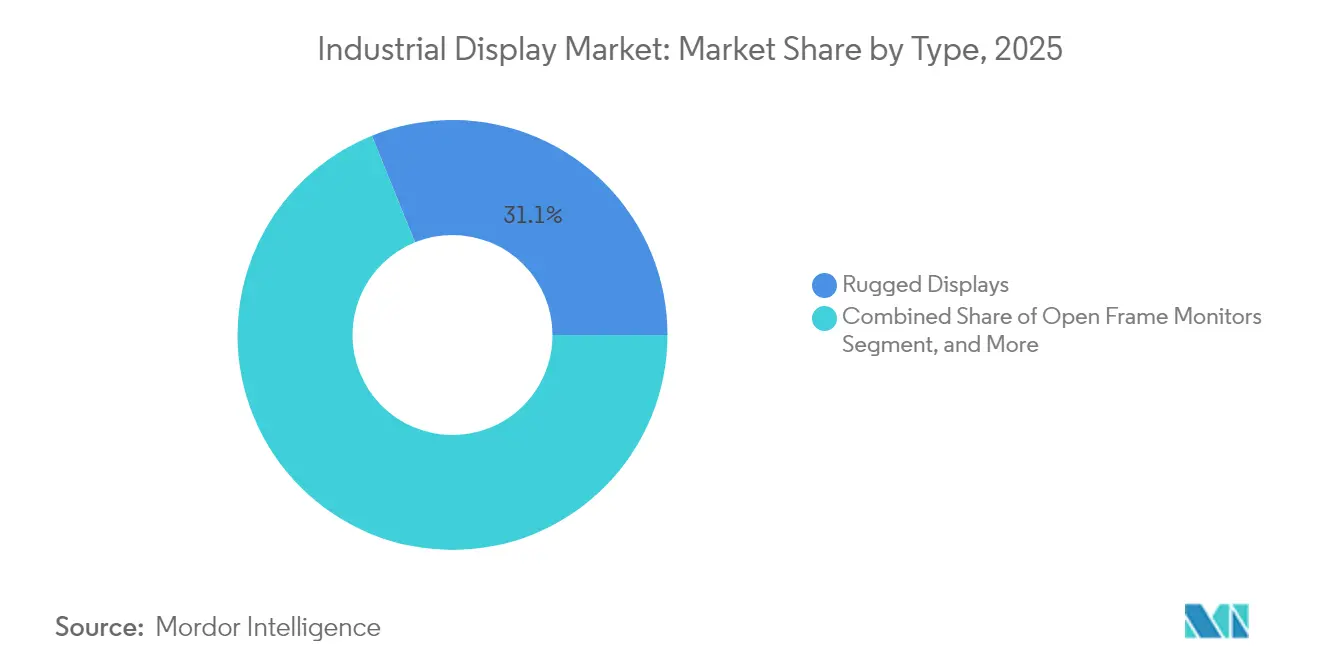
- By type, rugged displays accounted for 31.12% share of the industrial display market size in 2025; industrial video walls will post the highest 5.66% CAGR up to 2031.
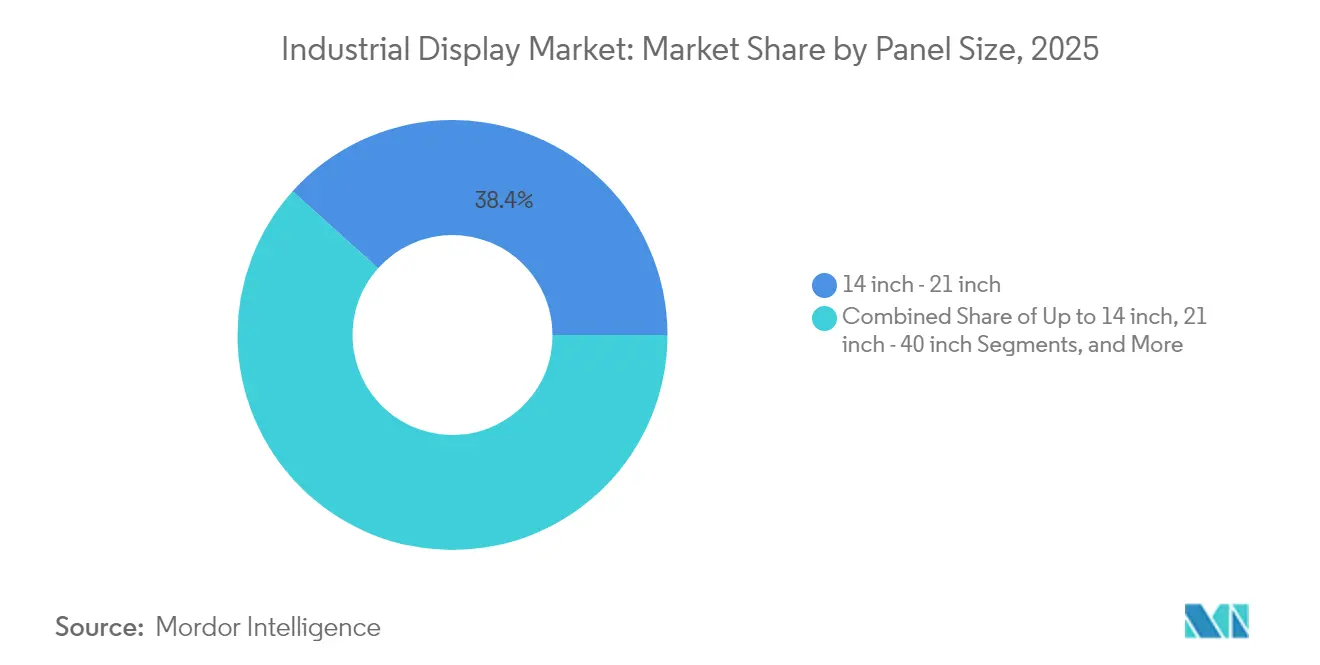
- By panel size, 14-21 inch units captured 38.35% share of the industrial display market size in 2025; the 40-inch-and-above class is projected to grow at a 5.98% CAGR through 2031.
- By end-use industry, manufacturing led with 34.05% revenue share in 2025; energy and power will advance at a 5.68% CAGR to 2031.
- By geography, Asia-Pacific contributed 36.55% of global revenue in 2025; the Middle East and Africa is set to grow at a 6.05% CAGR through 2031.
Note: Market size and forecast figures in this report are generated using Mordor Intelligence’s proprietary estimation framework, updated with the latest available data and insights as of 2026.
Global Industrial Display Market Trends and Insights
Drivers Impact Analysis*
| Driver | (~) % Impact on CAGR Forecast | Geographic Relevance | Impact Timeline |
|---|---|---|---|
| Adoption of Industrial IoT in discrete and process plants | +1.20% | Global; strongest in Asia-Pacific and North America | Medium term (2-4 years) |
| Demand surge for multi-featured HMI in hazardous chemical facilities | +0.80% | Middle East, Gulf Coast, Europe | Short term (≤ 2 years) |
| Lean-manufacturing digital signage (Andon) roll-outs across automotive lines | +0.60% | North America, Europe, Asia automotive hubs | Medium term (2-4 years) |
| Retrofit wave of aging North-American factories for electrification and automation | +0.70% | United States, Canada, Mexico | Long term (≥ 4 years) |
| Outdoor-grade sunlight-readable Micro-OLED/Micro-LED panels for oilfield operations | +0.40% | Middle East, shale regions in North America | Long term (≥ 4 years) |
| IECEx-2022 mandate for intrinsically safe offshore display hardware | +0.50% | North Sea, Gulf of Mexico, Persian Gulf | Short term (≤ 2 years) |
| Source: Mordor Intelligence | |||
Increasing Adoption of Industrial IoT in Discrete and Process Plants
Edge-ready HMIs now process millisecond latency data from Ethernet-based networks, enabling predictive maintenance dashboards that minimize unplanned shutdowns. Rockwell Automation identifies IIoT architecture as the principal digitization pathway for 2025, citing tighter coupling between controllers and visualization endpoints. HMS Networks confirms momentum, noting that Industrial Ethernet supplied 71% of new node installations in 2024, catalyzing demand for displays that support PROFINET, EtherNet/IP and EtherCAT stacks.
Demand Surge for Multi-featured HMI in Hazardous Chemical Facilities
The ISA-TR101.02-2019 technical report codifies usability and performance benchmarks that now influence every procurement brief. [1]International Society of Automation, “New ISA101 HMI Technical Report Focuses on Usability and Performance,” isa.org Suppliers such as VarTech Systems deliver C1D1 and C1D2 certified panels offering multi-touch, voice control and >1,000 nit brightness, aligning safety with functionality. These specifications support batch-to-batch integrity in chemicals and pharmaceuticals where micro-seconds matter for operator intervention.
Lean-Manufacturing Digital Signage (Andon) Roll-outs Across Automotive Lines
Automakers replacing mechanical lights with digital Andon boards document double-digit downtime reductions. MMCall cites 1,000 live installations delivering 23% uptime improvement on assembly lines. LineView and Mevisio showcase visual-factory deployments that combine OEE dashboards with root-cause logging, requiring high-resolution panels hardened for vibration.
Retrofit Wave of Aging North-American Factories for Electrification and Automation
Modernization initiatives merge legacy PLCs with cloud-secure OT networks. Siemens and ServiceNow jointly enable shop-floor threat dashboards that rely on industrial displays for real-time incident visualization. [2] Siemens AG, “Siemens and ServiceNow Strengthen Shopfloor Security,” press.siemens.com Phoenix Display International reports retrofit projects incurring 300-500% cost uplifts versus commercial screens due to environmental sealing and lifecycle validation.
Restraints Impact Analysis*
| Restraint | (~) % Impact on CAGR Forecast | Geographic Relevance | Impact Timeline |
|---|---|---|---|
| High cost of implementation and maintenance | -0.90% | Global; more acute in emerging markets | Medium term (2-4 years) |
| Prolonged LCD controller lead times amid chip shortage | -1.10% | Asia-Pacific manufacturing clusters | Short term (≤ 2 years) |
| Legacy PLC interface fragmentation | -0.60% | North America, Europe brownfield sites | Long term (≥ 4 years) |
| Accelerated panel burn-in in 24/7 control-room duty | -0.40% | Energy and process sectors worldwide | Medium term (2-4 years) |
| Source: Mordor Intelligence | |||
High Cost of Implementation and Maintenance
Explosion-proof enclosures, conformal coatings, and specialized mounting kits elevate upfront system outlays. Comark Corporation projects that IECEx compliance can double equipment budgets for offshore platforms while extending engineering schedules by several quarters.
Prolonged LCD Controller Lead-Times Amid Chip Shortage
Controller lead times have stretched to 52 weeks for wide-temperature or EMI-shielded variants, prompting redesign cycles and allocation strategies among OEMs. Samsung Electronics confirms panel makers moved to secure silicon under long-term agreements as part of a broader supply-chain resilience plan. [3]Samsung Electronics, “Samsung Electronics Announces First Quarter 2025 Results,” news.samsung.com
*Our forecasts treat driver/restraint impacts as directional, not additive. The impact forecasts reflect baseline growth, mix effects, and variable interactions.
Segment Analysis
By Type: Deployment Resilience Drives Rugged Display Leadership
Rugged housings rated to IP65-67 secured a 31.12% slice of the industrial display market in 2025, reflecting critical-duty requirements in drilling, mining and military platforms. Video walls are projected to compound at 5.66% annually, fueled by centralized control-room investment across petrochemical complexes. High-brightness open-frame modules integrate into kiosk enclosures, while panel-mount units remain the workhorse for machine-level HMIs. The industrial display market repeatedly favors vendors that combine shock resistance with modular I/O, ensuring rapid swap-out and minimal downtime. Marine-grade variants meet MIL-STD-167 vibration thresholds and salt-spray protocols, extending the industrial display market footprint to naval vessels and offshore rigs. Bar-type and stretch screens address multi-parameter dashboards in power plants, a niche translating to higher ASPs despite lower volumes.
Second-tier suppliers are blending ruggedization with narrow-bezel architectures, creating cross-over products that serve both field panels and command centers. Barco’s enterprise cinema contract for 4,000 laser screens underscores manufacturing scalability that later translates into industrial video walls. Hybrid enclosures now embed redundant power supplies and edge gateways, aligning with IEC 60079-2025 safety clauses while enlarging the serviceable industrial display market.


By Application: Remote Monitoring Challenges HMI Dominance
HMI stations delivered 46.05% of 2025 revenue, but remote asset visualization will outpace at a 6.12% CAGR as pipeline and well-pad telemetry shifts to centralized NOCs. The industrial display market size for remote monitoring is forecast to expand steadily as satellite and LPWAN connectivity proliferate in deserts and offshore locations. Andon boards in lean plants and interactive kiosks for maintenance crews reinforce human-centric visual workflows that shorten fault-to-fix cycles. Control-room video walls constitute the premium class where bezel-less LCD or emerging Micro-LED arrays craft immersive situational awareness environments. Integration with AI-driven analytics platforms means operators now act on prescriptive prompts rendered directly on the screen, reducing operator fatigue and error incidence.
Distributed solar-powered screens demonstrated by OnePetro field trials prove viability in regions lacking grid access, widening the install base of the industrial display market in remote extraction zones. As cybersecurity rises in priority, displays are increasingly paired with hardware-root-of-trust modules to secure on-screen data flows, a requirement accentuated in cross-border pipeline operations.
By Technology: LCD Stability Meets OLED Upswing
LCD panels held 61.45% revenue share in 2025 thanks to mature supply chains and broad temperature coverage, anchoring the cost-sensitive layer of the industrial display market. OLED and AMOLED modules will rise 6.78% per year because power reductions of up to 30% and outstanding contrast ratios suit 24/7 surveillance suites. Samsung Display achieved industry-first Pantone validation, signaling color-critical performance gains that resonate with pharmaceutical QC labs and semiconductor fabs. Micro-LED research documented in Nature demonstrates pixel densities that withstand direct sun at >10⁷ nits, foreshadowing next-generation outdoor panels.
Phase-difference film capacity expansions by Zeon Corporation confirm persistent investment in large-area LCD backplanes even as OLED ascends. The industrial display market now weighs cost per lumen against total cost of ownership, spurring dual-technology roadmaps among OEMs looking to hedge supply and technical risk.
By Panel Size: Consolidated Control Rooms Propel Large Formats
Panels above 40 inches are forecast to progress at a 5.98% CAGR to 2031 as operators transition from mosaics of small screens to single-panel canvases that simplify cabling and calibration. Conversely, 14-21 inch models retained 38.35% revenue in 2025, remaining the sweet spot for on-equipment HMIs. The industrial display market size associated with large-format panels benefits from falling Mini-LED backlight costs, which unlock higher contrast and localized dimming for process images. MDPI reports 100-200 μm chip spacing enabling thousands of dimming zones that enhance fault detection in live thermal imagery.
Compact panels under 14 inches reinforce mobility in maintenance tablets and helmet-mounted terminals, demonstrating the industrial display market diversification across wearable computing. AGC glass substrate investments ensure supply continuity for both TFT-LCD and OLED fabs, reinforcing scale economics that restrain per-inch premiums.
By End-Use Industry: Energy Sector Overtakes Growth Charts
Manufacturing retained 34.05% share in 2025 as discrete electronics, food, and pharmaceutical sites expanded digital dashboards. However, energy and power applications are set to grow 5.68% yearly on the back of grid modernization and renewable plant build-outs. The industrial display market share skews toward explosion-proof SKUs in oil and gas terminals where IECEx and ATEX compliance is non-negotiable. Mining projects adopt sunlight-readable panels with in-plane switching to sustain color fidelity under high dust loads, widening the industrial display industry footprint in Latin America and Australia.
Utilities are adding displays directly to switchgear: Siemens’ acquisition of Trayer Engineering extends medium-voltage cabinets with native visualization modules, underscoring convergence between power equipment and HMI design. Transportation yards rely on rugged screens for track-and-trace, while defense programs specify anti-glare and NVIS compliance, illustrating the breadth of use cases sustaining the industrial display market.
Geography Analysis
Asia-Pacific commanded 36.55% revenue in 2025, underpinned by China’s factory automation drive and Japan’s leadership in precision components. Samsung Display and LG Display operate global-scale OLED fabs, cementing the region’s supply advantage across the industrial display market. Component governments back capex tax credits that accelerate panel plant expansions, ensuring steady panel availability even during semiconductor shortages.
The Middle East and Africa is poised for the fastest 6.05% CAGR to 2031. Multi-billion-dollar hydrocarbon projects across the Gulf rely on intrinsically safe screens certified under IEC 60079-2025, enlarging the industrial display market size for explosion-proof hardware. National oil companies pair centralized NOCs with regional micro-control rooms, demanding synchronized video walls that sustain high brightness amid desert temperatures.
North America witnesses a retrofit wave across mid-century factories seeking energy efficiencies and cybersecurity hardening. Proactive replacement of CRTs and resistive-touch panels with IP-based glass surfaces boosts the industrial display market as factories embrace digital performance boards. Europe advances Industry 4.0 blueprints with a focus on ergonomic HMI layouts compliant with EN ISO 9241-210 usability guidance, promoting operator well-being. South America’s mining and hydroelectric sectors import hardy panels rated for high altitude and humidity, further diversifying geographic revenue.

Competitive Landscape
The industrial display market features moderate fragmentation: the top five players control just under 60% of global turnover. Samsung Display and LG Display lead technology development, with Samsung Electronics reporting KRW 5.9 trillion display revenue in Q1 2025 on the strength of QD-OLED and mobile panels. Schneider Electric completed the USD 11 billion AVEVA deal in 2024, fusing software and visualization to create vertically integrated platforms that blur traditional HMI boundaries.
VarTech Systems competes through purpose-built C1D2 devices, while Phoenix Display International differentiates via lifecycle design services that mitigate heat, shock and vibration. Siemens, Rockwell Automation and Honeywell embed native display modules inside control architectures, locking in aftermarket revenues through proprietary firmware ecosystems. Certification expertise under IECEx and ISA 60079 positions incumbents to defend share as emerging rivals face costly compliance hurdles.
OLED entrants chase power-sensitive niches, whereas Micro-LED consortia target extreme-brightness outdoor roles. The IEC 60079-2025 standard acts as a gatekeeper, advantaging players with mature QA frameworks and dedicated test labs. Supply-chain resilience remains a strategic priority; leading firms pre-book driver IC capacity and cultivate second-source glass vendors to shield production from ongoing semiconductor volatility.
Industrial Display Industry Leaders
LG Display Co. Ltd.
Schneider Electric SE
Siemens AG
Samsung Display Co., Ltd.
Panasonic Holdings Corp.
- *Disclaimer: Major Players sorted in no particular order

Recent Industry Developments
- May 2025: Samsung Display confirmed construction of an 8.6-generation OLED line in Asan City, scheduled for 2026 mass production to serve industrial and professional monitors.
- April 2025: Zeon Corporation announced a 20% capacity lift for phase-difference films used in large LCDs, bringing annual output to 26.4 million m².
- November 2024: AMETEK acquired Virtek Vision International for USD 40 million, adding AI-driven projection capabilities for factory inspection applications.
- October 2024: Advantech closed the AURES acquisition, expanding POS and industrial display portfolios under the ADVANTECH-AURES brand.


Global Industrial Display Market Report Scope
The industrial displays areLCD, LED displays, touch screen panels, outdoor displays, digital signage displays, and various industrial monitors. Vendors in this marketprovidea wide range ofdisplays in various sizes as per the end-users such as transportation, manufacturing, oil & gas among others.
| Rugged Displays |
| Open Frame Monitors |
| Panel-Mount Monitors |
| Marine and Naval-Grade Displays |
| Industrial Video Walls |
| Bar-Type/Stretch Displays |
| Human-Machine Interface (HMI) |
| Remote Asset and Pipeline Monitoring |
| Interactive Kiosks and Operator Terminals |
| In-plant Digital Signage and Andon Boards |
| Control-Room Video Walls |
| LCD |
| LED Backlit LCD |
| OLED/AMOLED |
| E-Paper and Reflective Displays |
| Micro-LED |
| Up to 14 inch |
| 14 inch - 21 inch |
| 21 inch - 40 inch |
| 40 inch and Above |
| Manufacturing |
| Energy and Power |
| Oil and Gas |
| Mining and Metals |
| Chemical and Pharmaceutical |
| Transportation and Logistics |
| Others (Water and Wastewater, Defense) |
| North America | United States | |
| Canada | ||
| Mexico | ||
| Europe | Germany | |
| United Kingdom | ||
| France | ||
| Nordics | ||
| Rest of Europe | ||
| South America | Brazil | |
| Rest of South America | ||
| Asia-Pacific | China | |
| Japan | ||
| India | ||
| South-East Asia | ||
| Rest of Asia-Pacific | ||
| Middle East and Africa | Middle East | Gulf Cooperation Council Countries |
| Turkey | ||
| Rest of Middle East | ||
| Africa | South Africa | |
| Rest of Africa | ||
| By Type | Rugged Displays | ||
| Open Frame Monitors | |||
| Panel-Mount Monitors | |||
| Marine and Naval-Grade Displays | |||
| Industrial Video Walls | |||
| Bar-Type/Stretch Displays | |||
| By Application | Human-Machine Interface (HMI) | ||
| Remote Asset and Pipeline Monitoring | |||
| Interactive Kiosks and Operator Terminals | |||
| In-plant Digital Signage and Andon Boards | |||
| Control-Room Video Walls | |||
| By Technology | LCD | ||
| LED Backlit LCD | |||
| OLED/AMOLED | |||
| E-Paper and Reflective Displays | |||
| Micro-LED | |||
| By Panel Size | Up to 14 inch | ||
| 14 inch - 21 inch | |||
| 21 inch - 40 inch | |||
| 40 inch and Above | |||
| By End-Use Industry | Manufacturing | ||
| Energy and Power | |||
| Oil and Gas | |||
| Mining and Metals | |||
| Chemical and Pharmaceutical | |||
| Transportation and Logistics | |||
| Others (Water and Wastewater, Defense) | |||
| By Geography | North America | United States | |
| Canada | |||
| Mexico | |||
| Europe | Germany | ||
| United Kingdom | |||
| France | |||
| Nordics | |||
| Rest of Europe | |||
| South America | Brazil | ||
| Rest of South America | |||
| Asia-Pacific | China | ||
| Japan | |||
| India | |||
| South-East Asia | |||
| Rest of Asia-Pacific | |||
| Middle East and Africa | Middle East | Gulf Cooperation Council Countries | |
| Turkey | |||
| Rest of Middle East | |||
| Africa | South Africa | ||
| Rest of Africa | |||


Key Questions Answered in the Report
What is the current value of the industrial display market?
The industrial display market size is USD 6.21 billion in 2026.
Which application segment is growing the fastest?
Remote asset and pipeline monitoring is projected to grow at a 6.12% CAGR up to 2031.
Why are OLED and AMOLED panels gaining share in industrial control rooms?
They deliver lower power consumption and higher contrast, which improves 24/7 readability and reduces operating costs.
What regions will offer the highest growth opportunities through 2031?
The Middle East and Africa, driven by large-scale oil and gas projects, will advance at a 6.05% CAGR.
How are chip shortages affecting industrial display deliveries?
Specialized LCD controller lead times have stretched to around 52 weeks, forcing OEMs to redesign products or secure alternate suppliers.
Which standards govern explosion-proof industrial displays?
IEC 60079-2025 defines safety requirements for equipment used in explosive atmospheres, including offshore platforms and chemical plants.
Page last updated on:


