Display Market Size and Share
Market Overview
| Study Period | 2020 - 2031 |
|---|---|
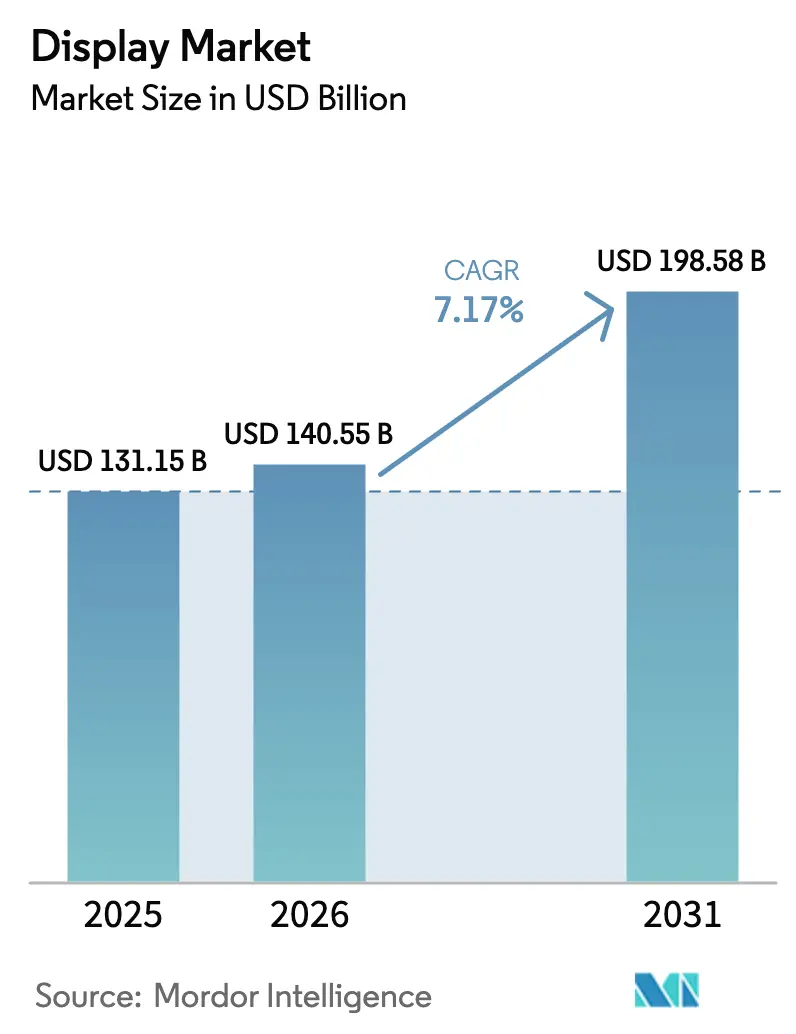
| Market Size (2026) | USD 140.55 Billion |
| Market Size (2031) | USD 198.58 Billion |
| Growth Rate (2026 - 2031) | 7.17% CAGR |
| Fastest Growing Market | Middle East and Africa |
| Largest Market | Asia Pacific |
| Market Concentration | Medium |
Major Players
*Disclaimer: Major Players sorted in no particular order Image © Mordor Intelligence. Reuse requires attribution under CC BY 4.0. |
|
Display Market Analysis by Mordor Intelligence
The display market size was valued at USD 131.15 billion in 2025 and estimated to grow from USD 140.55 billion in 2026 to reach USD 198.58 billion by 2031, at a CAGR of 7.17% during the forecast period (2026-2031). The upward trajectory mirrors a shift away from LCD dominance toward OLED and MicroLED, spurred by smartphone upgrades, automotive digitization, and adoption in AR/VR headsets. Intensified investment in Asian fabs, European eco-design mandates, and Middle-East smart-city projects sustain demand while encouraging technology diversification. Meanwhile, subsidies exceeding USD 19 billion in South Korea and rapid capacity build-outs in China reinforce regional competitiveness. Supply-chain fragility-especially rare-earth volatility and display-glass shortages-adds cost pressure yet opens opportunities for localized sourcing and materials innovation. Moderate market concentration, patent disputes over MicroLED transfer, and oversupply in Gen 10.5+ LCD lines shape capital-allocation decisions for incumbents.
Key Report Takeaways
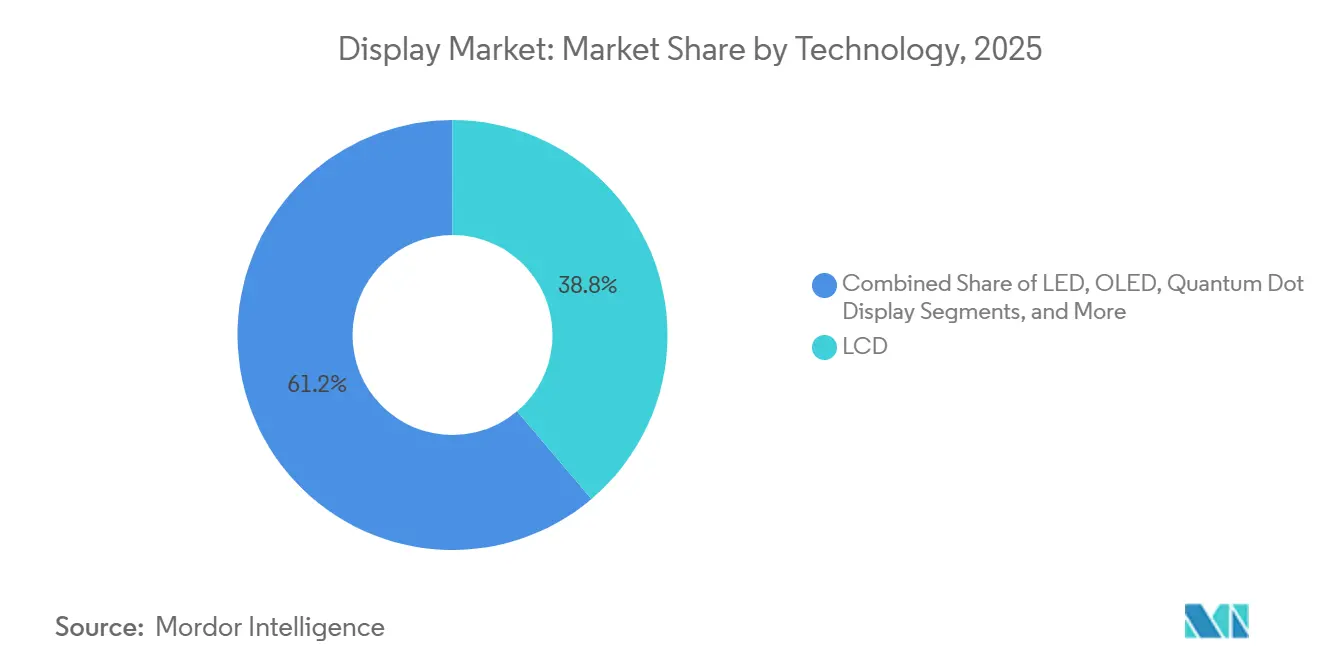
- By technology, LCD held 38.82% of display market share in 2025, while MicroLED is projected to advance at a 9.74% CAGR to 2031.
- By panel type, flat panels commanded 68.65% revenue share in 2025; flexible panels are set to expand at an 8.59% CAGR through 2031.
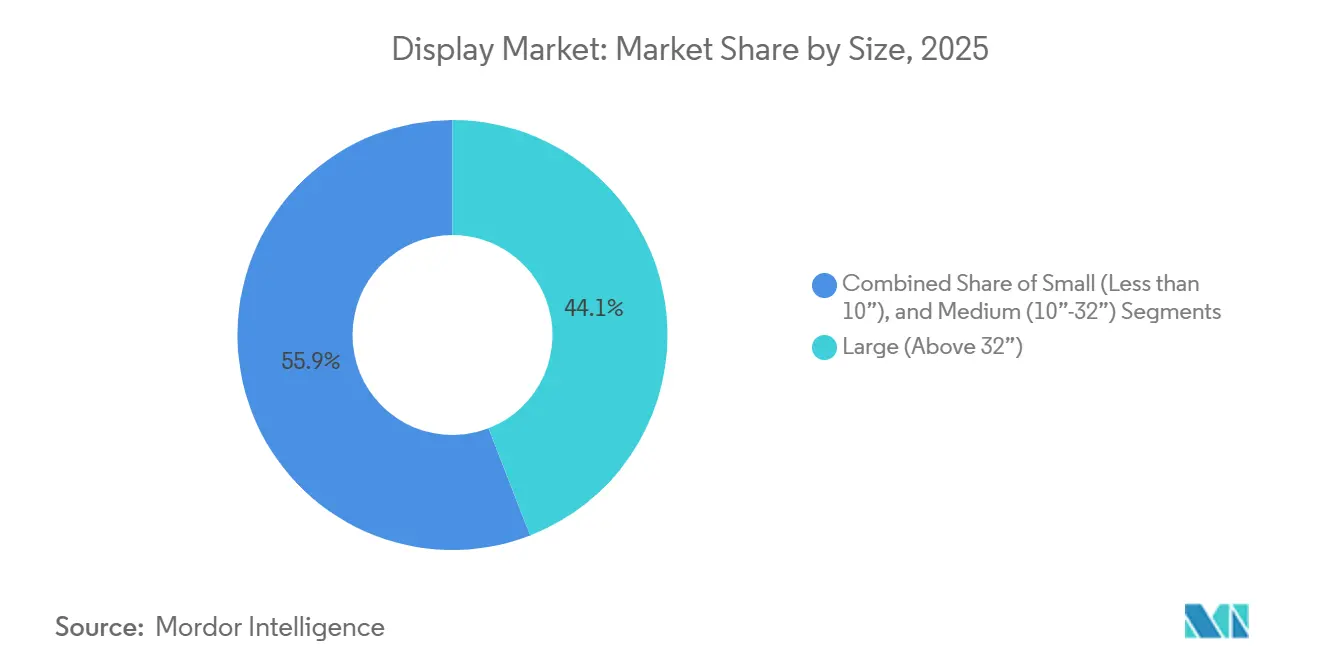
- By size, large displays (>32 in.) accounted for 44.12% of the display market size in 2025, whereas small displays (<10 in.) are forecast to grow at 9.08% CAGR to 2031.
- By application, smartphones and tablets captured 54.25% share of the display market size in 2025, while automotive displays will register the fastest 8.29% CAGR through 2031.
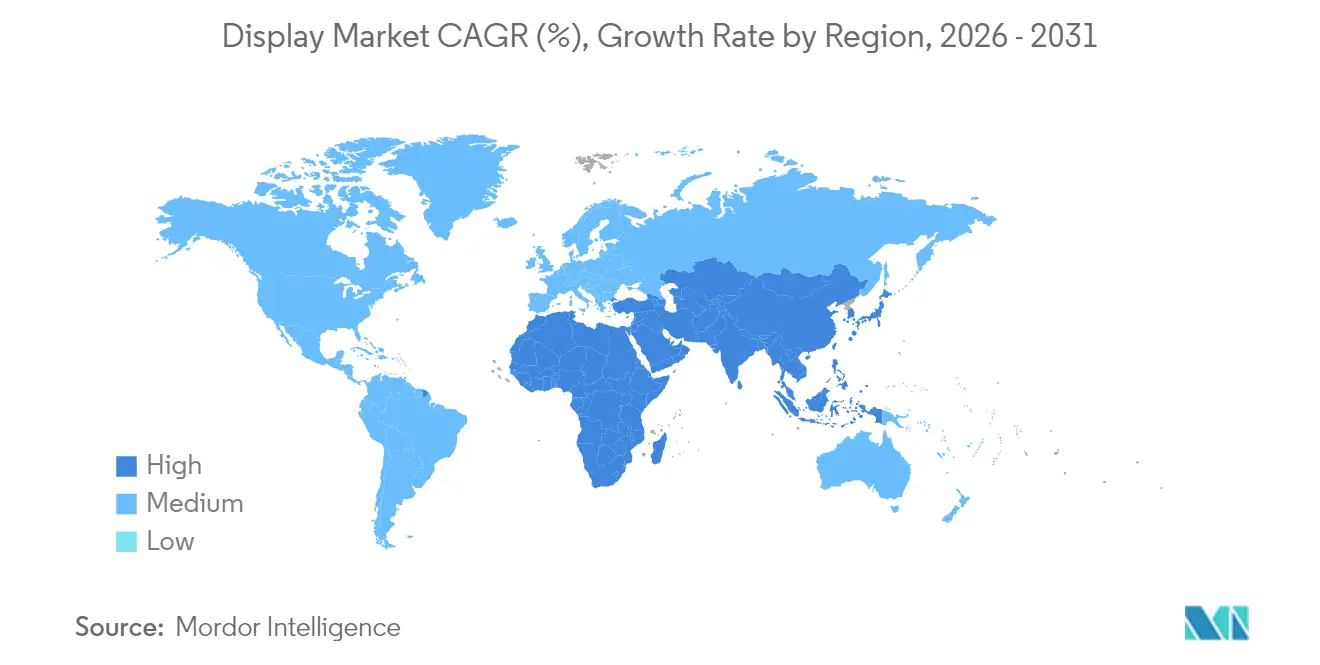
- By geography, Asia led with 48.45% share in 2025; the Middle East is poised for a 7.61% CAGR to 2031 on the back of mega-projects such as NEOM.
Note: Market size and forecast figures in this report are generated using Mordor Intelligence’s proprietary estimation framework, updated with the latest available data and insights as of 2026.
Global Display Market Trends and Insights
Drivers Impact Analysis*
| Driver | (~) % Impact on CAGR Forecast | Geographic Relevance | Impact Timeline |
|---|---|---|---|
| Proliferation of OLED in premium smartphones | +1.8% | Asia-Pacific with spillover to Vietnam and India | Medium term (2-4 years) |
| Automotive shift to integrated cockpit displays | +1.2% | Europe & North America, early adoption in Germany | Medium term (2-4 years) |
| MicroLED signage roll-out in Gulf mega-projects | +0.9% | Middle East, concentrated in Saudi Arabia and UAE | Long term (≥ 4 years) |
| AR/VR headset production boosting Micro-OLED demand | +1.1% | Global, manufacturing hub in China | Short term (≤ 2 years) |
| State subsidies for Gen 8.5+ OLED & 12-inch MicroLED lines | +0.8% | Korea and China | Long term (≥ 4 years) |
| EU eco-design rules for energy-efficient medical panels | +0.4% | Europe with global compliance reach | Medium term (2-4 years) |
| Source: Mordor Intelligence | |||
Proliferation of OLED in Premium Smartphones Fueling Asian Fab Expansions
OLED overtook LCD as the dominant smartphone panel in 2024 with 56% share, aided by mid-range pricing from Chinese makers.[1]Rasmus Larsen, “OLED Surpasses LCD as Leading Smartphone Display Type,” FlatpanelsHD, flatpanelshd.com Samsung Display responded with a USD 1.8 billion Vietnamese plant that can process 10 million units yearly, a hedge against trade friction.[2]Quy Nguyen, “Samsung Display to Build $1.8 Billion OLED Plant in Vietnam,” KED Global, kedglobal.com Apple’s 2025 iPhone SE 4 extends full OLED adoption, driving panel orders to BOE and LG at USD 25 each, a level Samsung considers unsustainable. The price squeeze accelerates commoditization and compels scale expansion. By 2025, Chinese capacity reaches 76% of global OLED output, reshaping the display market geography.
Automotive Shift to Integrated Cockpit Displays in EU and NA
More than 32 million automotive displays shipped in Q1 2024, reflecting regulatory pressure and consumer appetite for digital dashboards. AUO’s Smart Cockpit 2025 uses MicroLED in a transparent sunroof and morphing center console, highlighting design freedom. Larger screens aid advanced-driver assistance, while TomTom’s collaboration with 3SS opens in-car content monetization. Electrification reinforces the trend as passengers seek richer media during charging. Continental’s research integrates AR overlays and biometrics, anchoring displays in vehicle safety and comfort.
Commercial Roll-out of MicroLED Signage Across Gulf Cooperation Council Countries Mega-Projects
Saudi Arabia’s USD 500 billion NEOM doubles its workforce to 140,000, creating unmatched MicroLED signage demand for navigation and architecture.[3]Riyadh Bureau, “NEOM Smart-City Progress,” Al Arabiya, alarabiya.net OXAGON hubs and THE LINE require thousands of high-brightness, energy-efficient panels resilient to desert heat. Port of NEOM adds industrial display needs for automated logistics. Similar smart-city agendas in UAE and Qatar reinforce regional growth prospects in the display market.
Surge in AR/VR Headset Production Driving Micro-OLED Demand from China
SidTek’s USD 6 billion Wuhu plant commenced trial runs, targeting 6,000 micro-OLED panels monthly for immersive wearables. Global micro-OLED demand could reach 21 million units by 2028, buoyed by Meta’s Orion glasses employing JBD’s LEDoS architecture. Samsung’s move to glass substrates lowers costs on future micro-OLED lines. Apple’s outreach for 2-inch, 1,700 PPI microdisplays signals further supplier diversification.
Restraints Impact Analysis*
| Restraint | (~) % Impact on CAGR Forecast | Geographic Relevance | Impact Timeline |
|---|---|---|---|
| Capital-intensive Gen 10.5+ LCD fabs facing oversupply ROI pressure | -1.4% | Global, notably Taiwan and Korea | Short term (≤ 2 years) |
| Patent litigation over MicroLED transfer tech | -0.8% | United States with global spillover | Medium term (2-4 years) |
| High scrap rates from large-area flexible OLED yield issues | -1.1% | Asian manufacturing hubs | Short term (≤ 2 years) |
| Rare-earth-based QD phosphor cost volatility | -0.9% | China-dependent supply chains | Medium term (2-4 years) |
| Source: Mordor Intelligence | |||
Capital-Intensive Gen 10.5+ LCD Fabs Facing Oversupply ROI Pressure
Fab utilization slipped from 80% in early 2025 to 76% by May as tariff uncertainty curbed brand orderst. LG Display exited LCD by divesting two Chinese lines to TCL CSoT for USD 1.5 billion. DSCC forecasts a swing from oversupply to shortage within five years as capacity growth lags rising demand for larger screens. Samsung’s review of chip spending, including potential pauses at Pyeongtaek and Taylor, underscores capital strain.
High Scrap Rates from Large-Area Flexible OLED Yield Issues
Defect accumulation in large flexible substrates elevates material waste. Apple rejected a sizeable portion of BOE’s 40 million-panel order, demanding six weeks of corrective action. Applied Materials’ MAX OLED promises 5X lifetime and 30% energy savings, mitigating yield pain points.[4]Applied Materials, “MAX OLED Manufacturing Breakthrough,” ir.appliedmaterials.com Research on hidden active areas achieves 95% stretchability and 100,000 cycles, hinting at future durability gains for wearables. Tandem OLED stacks double lifespan and triple brightness but add process complexity
*Our forecasts treat driver/restraint impacts as directional, not additive. The impact forecasts reflect baseline growth, mix effects, and variable interactions.
Segment Analysis
By Technology: MicroLED Emerges Despite LCD Dominance
LCD held 38.82% of display market share in 2025 owing to entrenched infrastructure and cost advantages. MicroLED shows the steepest 9.74% CAGR, supported by breakthroughs in mass-transfer lasers and government incentives. Samsung’s 4 K micro-OLED for VR and LG’s 4,000-nit platform push premium boundaries.
Aledia’s 3D GaN-on-silicon line in France and Q-Pixel’s 6,800 PPI record extend Europe’s stake in the display market. OLED benefits from smartphone scale and automotive cockpit penetration. Quantum-Dot variants wrestle with rare-earth volatility, while e-paper secures niche signage and low-power IoT roles.


By Panel Type: Flexible Panels Drive Innovation
Flat panels dominated revenue with 68.65% in 2025 due to maturated TV and monitor lines. Flexible formats log the fastest 8.59% CAGR, lifted by foldable handsets and curved dashboards. Samsung’s 18.1-inch foldable and Slidable Flex prototypes underscore a race for portability.
Yield-management advances such as hybrid organic-inorganic encapsulation deliver 100,000 stretch cycles in lab tests. Ultra-thin OLEDs at 0.6 mm reduce device weight by 30% and power by 30%, slated for 2026 mass production. Rigid panels remain staples in value-tier TVs.
By Size: Small Displays Accelerate Growth
Large screens above 32 in. held 44.12% of the display market size in 2025, buoyed by television replacement cycles and digital signage. Small panels below 10 in. post a 9.08% CAGR as wearables and AR devices multiply.
Mojo Vision’s monolithic 6,350 PPI RGB micro-LED accelerates pixel density gains for smart-glasses. LG’s 45-inch WOLED gaming monitor with Dynamic Frequency & Resolution adapts refresh rates for e-sports. Samsung’s 1.4-inch 20,000-nit microdisplay targets outdoor XR use cases.
By Application: Automotive Displays Emerge as Growth Drive
Smartphones and tablets controlled 54.25% of display market share in 2025, yet cockpit screens chart the briskest 8.29% CAGR on EV adoption. AUO’s Virtual Sky Canopy transforms sunroofs into ambient displays, while Morphing Center Control offers tactile reconfigurability. EU eco-design rules spur demand for energy-efficient medical imaging, nudging suppliers toward low-power panels. AR/VR ecosystems anticipate 25.5 million headset shipments by 2030, propelling micro-OLED backplanes.
Geography Analysis
Asia dominated the display market with 48.45% share in 2025, anchored by China’s 76% slice of global OLED capacity and Samsung’s manufacturing shift to Vietnam. South Korea’s USD 19 billion subsidy plan underpins local Gen 8.5+ OLED and 12-inch MicroLED lines, reinforcing supply-chain depth. Japan complements regional strength through JDI and OLEDWorks’ US capacity partnership, highlighting cross-border technology flows
Europe records steady gains as German automakers adopt integrated cockpits and the EU’s Ecodesign Regulation incentivizes energy-efficient panels eur-lex.europa.eu. Nordic suppliers leverage expertise in ruggedized displays for extreme environments. Sustainability mandates ripple through procurement, making circular-economy metrics part of tender evaluations and elevating recyclability innovations within the display market.
The Middle East posts the fastest 7.61% CAGR to 2031, propelled by the USD 500 billion NEOM city along with UAE and Qatar smart-city blueprints. Bulk demand concentrates on large-format MicroLED signage and integrated building façades designed to withstand high ambient temperatures. North America maintains a stable outlook amid smartphone replacement cycles and automotive digitization, yet faces headwinds from MicroLED patent disputes that may slow roll-outs. South America emerges as a secondary growth pole as economic modernization raises electronics penetration and fuels digital-signage projects in transport hubs.

Competitive Landscape
Competition is moderate with Korean titans Samsung Display and LG Display confronting aggressive Chinese expansion. BOE’s yield missteps prompted Apple to divert orders back to Korean suppliers, illustrating the value of process stability. Samsung earmarked USD 3.1 billion for IT-grade OLED lines yet is reassessing other semiconductor outlays, signaling selective capital allocation.
Technology roadmaps dictate strategic posture. Applied Materials’ MAX OLED, promising 3X brightness and 5X life, could advantage adopters while disadvantaging laggards. Patent estates become revenue levers and defensive shields: Meta protects high-extraction MicroLED micro-optics, whereas Samsung fortifies manufacturing IP.. White-space plays surface in AR micro-displays, eco-compliant medical panels, and transparent automotive HUDs where incumbents hold limited share.
New entrants pursue leapfrog strategies. Aledia’s USD 200 million GaN-on-silicon fab targets ultrabright micro-LEDs for AR eyewear. Q-Pixel’s 6,800 PPI prototype outstrips Apple Vision Pro resolution, signaling disruptive potential. Foxconn’s tie-up with Porotech sets the stage for vertically integrated AR glasses, complicating established value chains.
Display Industry Leaders
-
Samsung Display (Samsung Electronics)
-
LG Display (LG Electronics)
-
BOE Technology Group Co., Ltd.
-
AUO Corporation
-
Japan Display Inc.
- *Disclaimer: Major Players sorted in no particular order

Recent Industry Developments
- June 2025: Samsung introduced 4 K micro-OLEDs targeting next-generation VR headsets.
- May 2025: Samsung Display confirmed production of ultra-thin OLEDs in 2026, trimming thickness to 0.6 mm.
- February 2025: OLEDWorks and Japan Display Inc. revealed plans for a US display plant.
- January 2025: LG Display achieved 4,000 nits peak brightness in its 4th-generation architecture
- January 2025: Samsung Display showcased new OLED technologies at CES 2025, including the world’s largest 18.1-inch foldable OLED display.


Global Display Market Report Scope
A display is an electronic device used to visually present information, graphics, text, or videos to users. Displays are integral componenets in various devices, including televisions, smartphones, computers, digital signage, and wearable gadgets. They convert digital signals into visual content, enabling users to interact with and understand data or media.
The study tracks the revenue generated from the sale of displays used in various applications, such as smartphones, televisions, laptops, tablets, automotive displays, digital signage, medical equipment, etc., by various worldwide manufacturers. It also tracks the key market parameters, underlying growth influencers, and major manufacturers operating in the industry, which supports the market estimations and growth rates over the forecast period. The study further analyses the overall impact of macroeconomic factors on the market. The report’s scope encompasses market sizing and forecasts for the various market segments.
The display market is segmented by technology (LCD, OLED, LED, microLED, and e-paper), by application (consumer electronics, automotive, healthcare, retail and hospitality, industrial, and education and corporate), by size (small displays, medium displays, and large displays), and by geography (North America, Europe, Asia-pacific, Latin America, and Middle East and Africa). The market sizes and forecasts are provided in terms of value (USD) for all the above segments.
| LCD |
| LED |
| OLED |
| Quantum Dot Display |
| MicroLED |
| MiniLED |
| E-Paper |
| Flat Panel |
| Flexible Panel |
| Transparent Panel |
| Rigid Panel |
| Small (Less than 10") |
| Medium (10"-32") |
| Large (Above 32") |
| Smartphones and Tablets |
| Televisions and Home Entertainment |
| Wearables |
| Automotive Cockpit and Infotainment |
| Digital Signage and Retail |
| Healthcare and Medical Devices |
| Industrial and HMI |
| Education and Corporate Collaboration |
| AR/VR Headsets |
| North America | United States | |
| Canada | ||
| Mexico | ||
| Europe | Germany | |
| United Kingdom | ||
| France | ||
| Nordics | ||
| Rest of Europe | ||
| South America | Brazil | |
| Rest of South America | ||
| Asia-Pacific | China | |
| Japan | ||
| India | ||
| South-East Asia | ||
| Rest of Asia-Pacific | ||
| Middle East and Africa | Middle East | Gulf Cooperation Council Countries |
| Turkey | ||
| Rest of Middle East | ||
| Africa | South Africa | |
| Rest of Africa | ||
| By Technology | LCD | ||
| LED | |||
| OLED | |||
| Quantum Dot Display | |||
| MicroLED | |||
| MiniLED | |||
| E-Paper | |||
| By Panel Type | Flat Panel | ||
| Flexible Panel | |||
| Transparent Panel | |||
| Rigid Panel | |||
| By Size | Small (Less than 10") | ||
| Medium (10"-32") | |||
| Large (Above 32") | |||
| By Application | Smartphones and Tablets | ||
| Televisions and Home Entertainment | |||
| Wearables | |||
| Automotive Cockpit and Infotainment | |||
| Digital Signage and Retail | |||
| Healthcare and Medical Devices | |||
| Industrial and HMI | |||
| Education and Corporate Collaboration | |||
| AR/VR Headsets | |||
| By Geography | North America | United States | |
| Canada | |||
| Mexico | |||
| Europe | Germany | ||
| United Kingdom | |||
| France | |||
| Nordics | |||
| Rest of Europe | |||
| South America | Brazil | ||
| Rest of South America | |||
| Asia-Pacific | China | ||
| Japan | |||
| India | |||
| South-East Asia | |||
| Rest of Asia-Pacific | |||
| Middle East and Africa | Middle East | Gulf Cooperation Council Countries | |
| Turkey | |||
| Rest of Middle East | |||
| Africa | South Africa | ||
| Rest of Africa | |||


Key Questions Answered in the Report
What is the current value of the display market?
The display market is valued at USD 140.55 billion in 2026 and is on track to reach USD 198.58 billion by 2031.
Which technology segment is growing the fastest?
MicroLED registers the highest 9.74% CAGR through 2031, benefiting from mass-transfer innovations and smart-city demand.
Why are automotive displays important to future growth?
Integrated cockpits in electric and autonomous vehicles push automotive displays to an 8.29% CAGR, making them the fastest-growing application.
How concentrated is the competitive landscape?
Market concentration is moderate: the top five suppliers hold roughly two-thirds of revenue, but yield issues and patent disputes offer openings for challenger
Which region shows the strongest growth prospects?
The Middle East leads with a 7.61% CAGR to 2031, fueled by mega-projects like Saudi Arabia’s NEOM that demand high-brightness, durable MicroLED signage.
What supply-chain risk should executives monitor?
Volatile pricing of rare-earth phosphors-exacerbated by China’s export restrictions-can inflate material costs and squeeze margins across the display industry
Page last updated on:


