Display Panel Market Size and Share
Market Overview
| Study Period | 2020 - 2031 |
|---|---|
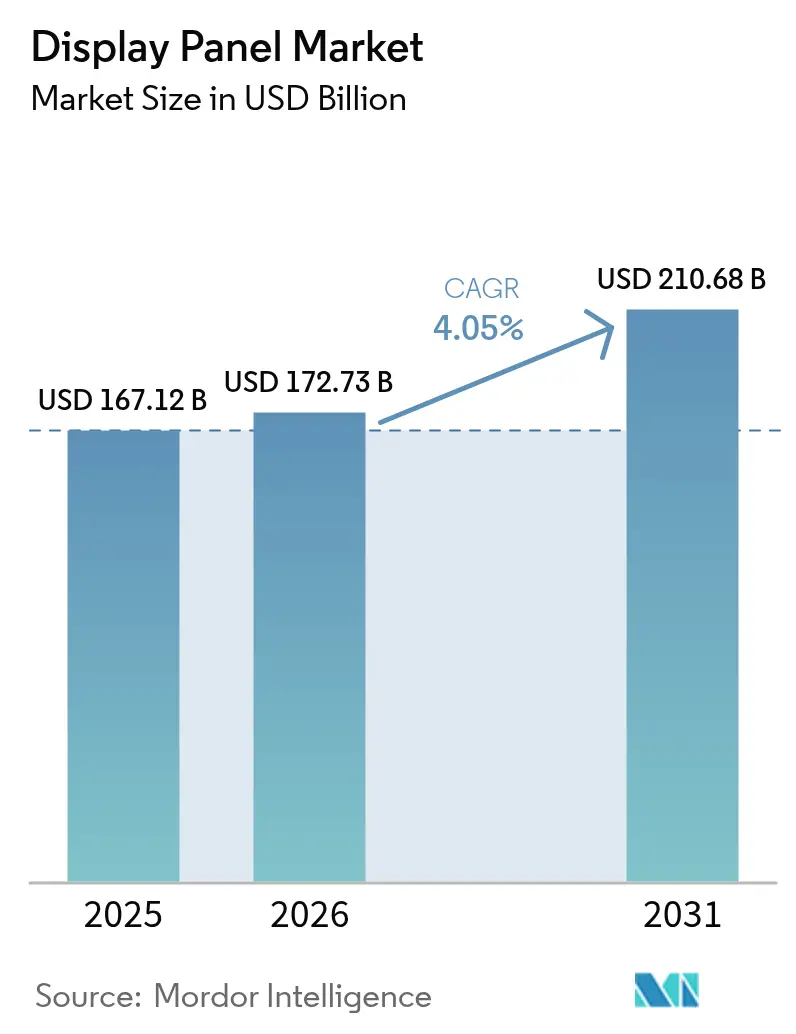
| Market Size (2026) | USD 172.73 Billion |
| Market Size (2031) | USD 210.68 Billion |
| Growth Rate (2026 - 2031) | 4.05% CAGR |
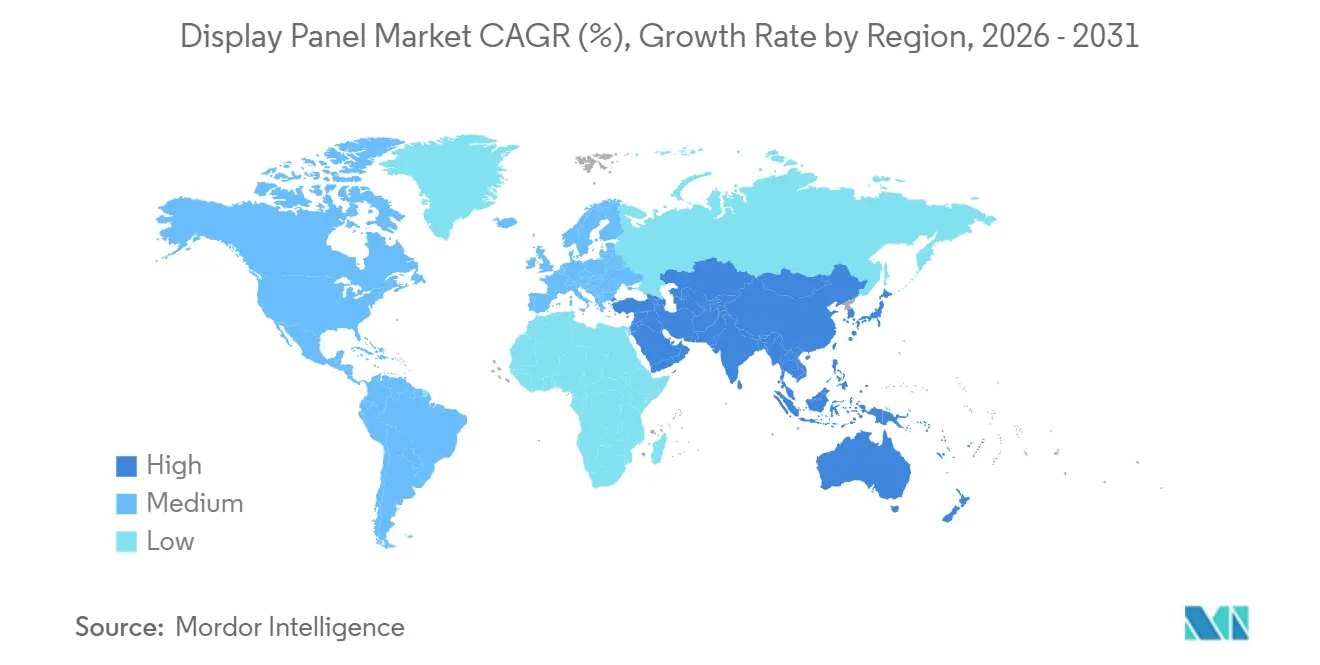
| Fastest Growing Market | Middle East |
| Largest Market | Asia Pacific |
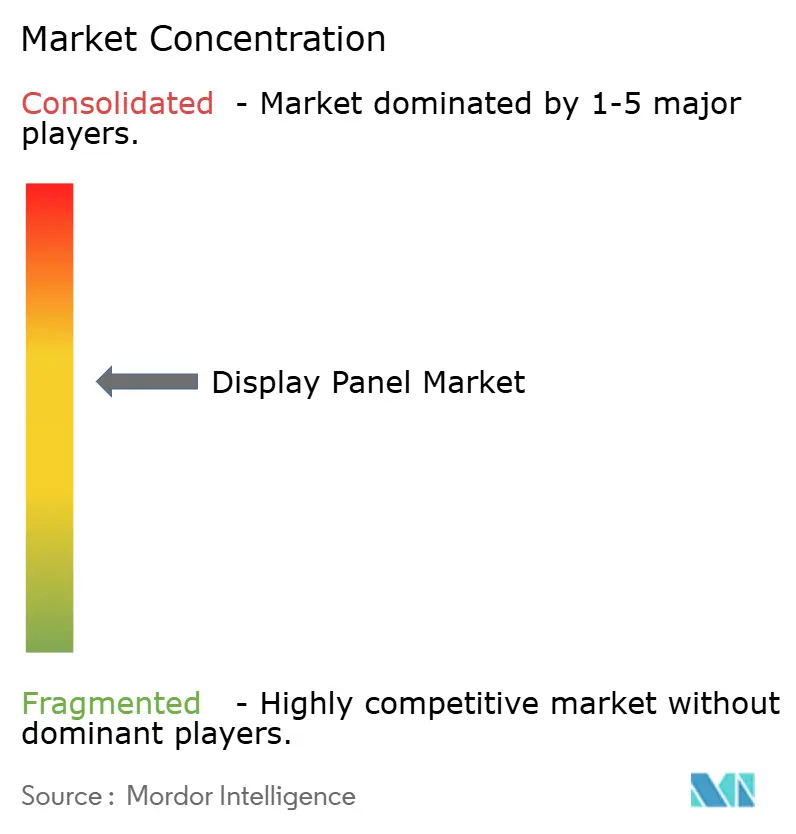
| Market Concentration | Medium |
Major Players
*Disclaimer: Major Players sorted in no particular order Image © Mordor Intelligence. Reuse requires attribution under CC BY 4.0. |
|
Display Panel Market Analysis by Mordor Intelligence
The display panel market size is projected to expand from USD 167.12 billion in 2025 and USD 172.73 billion in 2026 to USD 210.68 billion by 2031, registering a 4.05% CAGR between 2026 and 2031. The transition toward high-efficiency OLEDs and emerging Micro-LED architectures is reshaping competitive dynamics as smartphone brands seek lower power budgets and automakers integrate multi-screen cockpits. Large-screen television demand, the roll-out of foldable phones and tablets, and rising volumes of AR/VR headsets are sustaining shipment momentum. Capacity additions in China’s Gen-8.6 and Gen-10.5 fabs, combined with steady investments in Gen-6 OLED lines in South Korea and Taiwan, underpin near-term supply, yet glass substrate and skilled-labor shortages continue to stretch lead-times. Regulatory pressure on PFAS-based polarizer films and the high capital intensity of Gen-10.5 fabs are reinforcing scale advantages for incumbents.
Key Report Takeaways
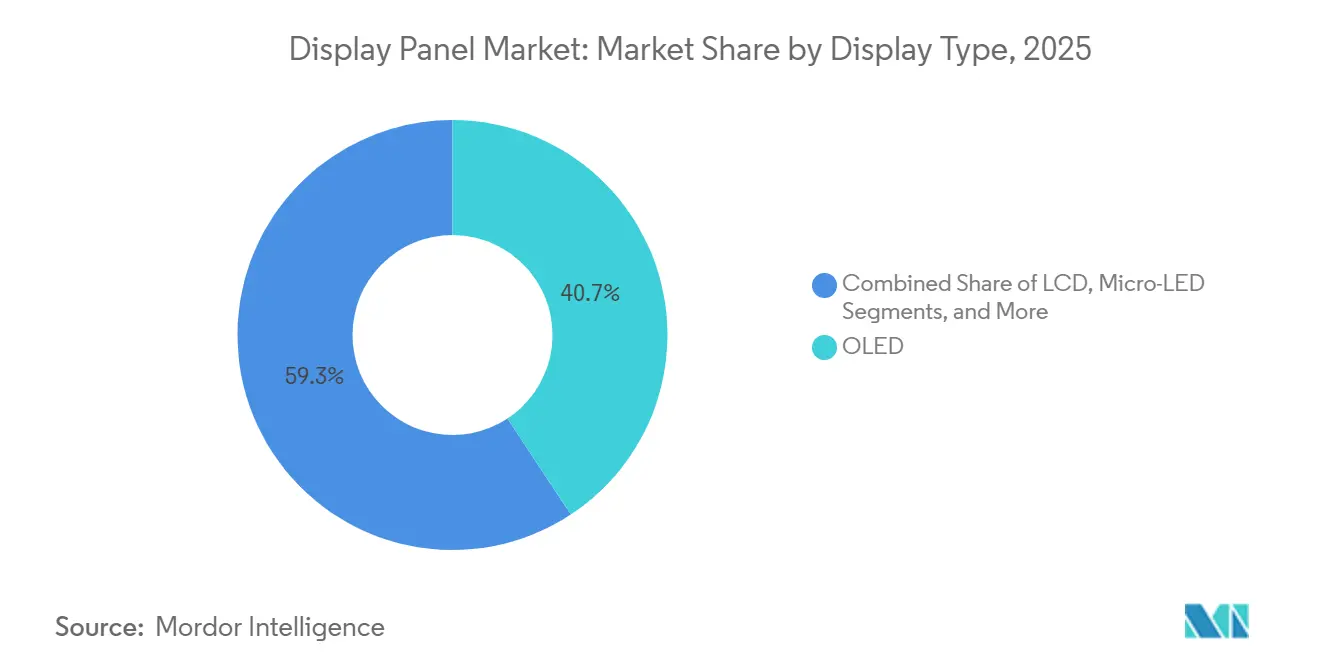
- By display type, OLED led with a 40.74% share in 2025 while Micro-LED is the fastest-growing technology at a 4.35% CAGR through 2031.
- By resolution, 4K panels held 45.36% of 2025 revenue whereas 8K and above is projected to expand at a 5.11% CAGR to 2031.
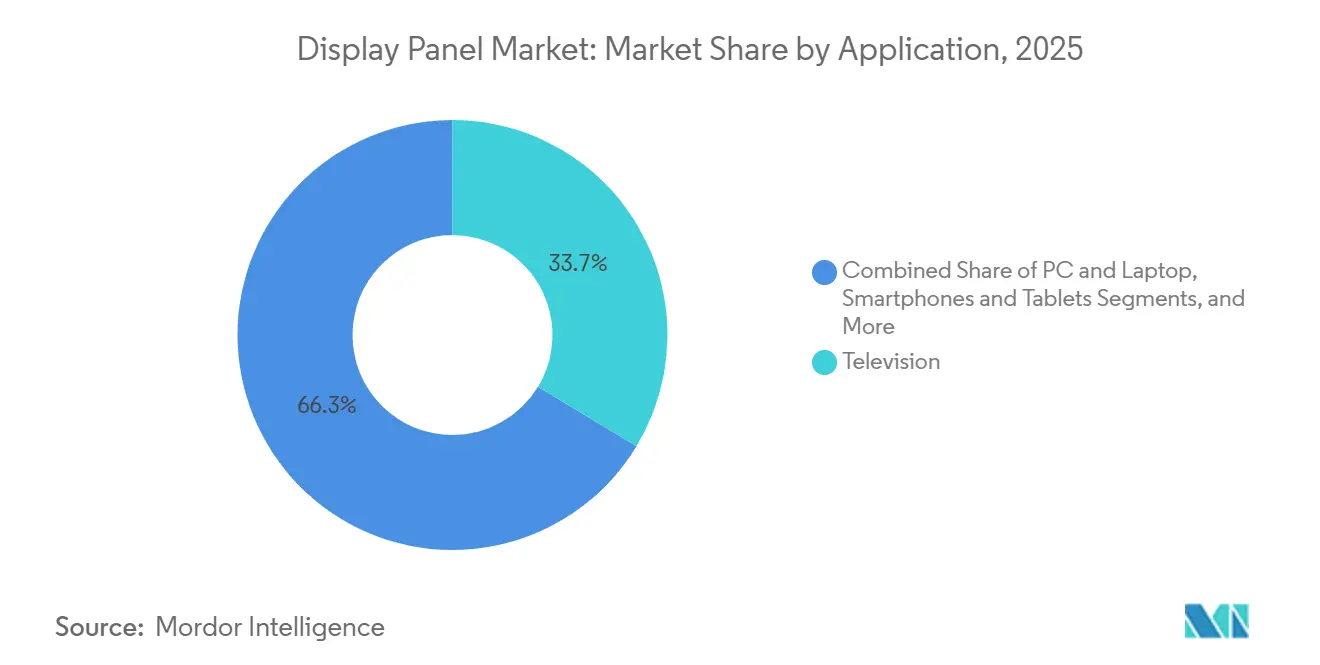
- By application, televisions accounted for 33.66% of 2025 revenue and wearables plus AR/VR are advancing at a 4.86% CAGR.
- By panel size, the 33-65 inch range controlled 36.81% of revenue in 2025 while the 6.1-13 inch category is set to rise at a 5.03% CAGR.
- By geography, Asia Pacific commanded 49.72% of 2025 revenue and the Middle East is the fastest-growing region at a 4.98% CAGR.
Note: Market size and forecast figures in this report are generated using Mordor Intelligence’s proprietary estimation framework, updated with the latest available data and insights as of 2026.
Global Display Panel Market Trends and Insights
Driver Impact Analysis*
| Driver | (~)% Impact on CAGR Forecast | Geographic Relevance | Impact Timeline |
|---|---|---|---|
| Surging Demand for UHD (4K and Above) TVs | +0.8% | Global, with concentration in North America, Europe, and APAC premium segments | Medium term (2-4 years) |
| Smartphone OEM Pivot to OLED and Micro-LED | +1.1% | Global, led by APAC manufacturing hubs (China, South Korea, Taiwan) | Short term (≤ 2 years) |
| Automotive Cockpit Digitization Wave | +0.9% | North America, Europe, China; spillover to India and South-East Asia | Medium term (2-4 years) |
| Foldable and Rollable Form-Factor Innovation | +0.6% | APAC core (South Korea, China), expanding to Europe and North America | Short term (≤ 2 years) |
| Substrate-Free Holographic Waveguide Displays for Defense Avionics | +0.2% | North America, Europe (NATO members), Israel | Long term (≥ 4 years) |
| Localized EU Incentives for Clean-Room Glass Recycling | +0.3% | Europe (Germany, France, Netherlands) | Long term (≥ 4 years) |
| Source: Mordor Intelligence | |||
Surging Demand for UHD (4K) Televisions
4K television penetration continued to rise in 2025 as retail pricing for 55-inch sets dipped below USD 400 in India and Southeast Asia, stimulating first-time purchases while replacement cycles persisted in North America and Europe. Panel makers optimized Gen-10.5 LCD lines for 65-inch 4K cuts, driving cost per area below legacy Gen-8.5 output. Although 8K panel production costs fell 18-20% year-over-year, the format remained a niche because streaming platforms offered under 100 native 8K titles as of late 2025, keeping consumer pull subdued.[1]Samsung Display Co. Ltd., “Investor Relations Presentation,” samsungdisplay.com Brands therefore configured new production lines to alternate between 4K and 8K glass cuts to hedge demand swings. This dual-format flexibility permits rapid output shifts once content ecosystems mature.
Smartphone Pivot to OLED and Micro-LED
Mainstream flagship phones adopted LTPO OLED across entire model line-ups during 2025, trimming display power draw by nearly one-fifth and consolidating share gains for leading OLED suppliers. Gen-6 fabs in South Korea and China achieved yields above 95% on 6-7 inch panels, narrowing cost gaps with high-end LCD. Commercial Micro-LED pilots moved from R&D to limited production in the smartwatch and AR-glasses categories, yet yield rates below 70% for panels larger than 2 inches and a 4-6× cost premium kept volumes modest. Material suppliers logged strong order books for OLED emitter compounds, signaling sustained capital spending through 2027.
Automotive Cockpit Digitization Wave
Electric-vehicle platforms introduced unified glass cockpits spanning 30-50 inches that consolidate instrument cluster, infotainment and passenger displays. This architecture tripled panel area per car and boosted demand for curved, low-reflectance OLED and mini-LED units certified to AEC-Q100 and ISO 26262. Tier-1 suppliers won multiyear contracts exceeding USD 2 billion in 2025, underlining automakers’ shift toward differentiated digital interiors. LTPO backplanes permit always-on graphics while meeting stringent idle-power budgets for battery-electric drivetrains, but qualification lead-times of 18-24 months reinforce barriers to entry.
Foldable and Rollable Form-Factor Innovation
Global foldable-phone shipments climbed 46% year-over-year to 22 million units in 2025 as ultra-thin-glass substrates reduced crease visibility by more than one-third versus early polyimide versions. Dominant suppliers delivered three of every four foldable OLED panels, while Chinese competitors accelerated UTG adoption to support domestic brands.[2]BOE Technology Group Co. Ltd., “BOE Lights Up B16 Gen-8.6 AMOLED Line,” boe.com Rollable prototypes expanded display area without hinge gaps, yet hinge durability remained below the 200,000-cycle threshold demanded for mass-market devices. Consequently, panel makers allocated USD 1-2 billion annually to flexible OLED R&D and forecast foldable or rollable formats to comprise up to 20% of premium mobile shipments by 2030.
Restraints Impact Analysis*
| Restraint | (~)% Impact on CAGR Forecast | Geographic Relevance | Impact Timeline |
|---|---|---|---|
| High Capex for Gen-10.5 Fabs | -0.7% | Global, concentrated in APAC (China, South Korea, Taiwan) | Medium term (2-4 years) |
| Persistent Glass Substrate Supply Bottlenecks | -0.5% | Global, with acute pressure in APAC OLED hubs | Short term (≤ 2 years) |
| Talent Scarcity in Oxide and LTPO Backplane Engineering | -0.4% | APAC (Taiwan, South Korea, Japan), spillover to China | Medium term (2-4 years) |
| Environmental Regulation Risk on PFAS-Based Polarizer Films | -0.3% | Europe (EU-27), potential expansion to North America | Long term (≥ 4 years) |
| Source: Mordor Intelligence | |||
High Capex for Gen-10.5 Fabs
Gen-10.5 LCD lines required USD 3-4 billion per build-out in 2025, roughly 30% above Gen-8.5 equivalents. Chinese leaders financed simultaneous projects valued at over USD 12 billion, but multiyear payback horizons and elevated depreciation discouraged new entrants. Owners of depreciated Gen-8.5 assets maintained 20-30% cost advantages serving price-sensitive segments, reinforcing a two-tier market and lifting the combined share of the five largest LCD producers to 78% in 2025.
Persistent Glass Substrate Supply Bottlenecks
OLED substrates require ultra-low total thickness variation (TTV) below 1 micron and alkali-free compositions to prevent sodium migration into organic layers, specifications that limit qualified suppliers to three global vendors.[3]AGC Inc., “Investor Relations,” agc.com Lead-times stretched to 16–20 weeks in 2025, delaying OLED ramp-ups by several months and compressing yields on advanced LTPO lines by 5-8 percentage points. A USD 500 million capacity expansion announced for Taiwan will lift substrate output by 30% in 2026, but demand from new Gen-6 fabs is projected to outstrip supply gains, keeping the market tight.
*Our forecasts treat driver/restraint impacts as directional, not additive. The impact forecasts reflect baseline growth, mix effects, and variable interactions.
Segment Analysis
By Display Type: OLED Dominance Meets Micro-LED Disruption
OLED secured 40.74% market share in 2025, reflecting its entrenchment in premium smartphones, tablets, and automotive displays, where power efficiency and contrast ratios justify cost premiums over LCD alternatives. Samsung Display and LG Display supplied over 85% of OLED panels for flagship smartphones in 2025, leveraging Gen-6 fabs optimized for 6.1-6.7-inch formats that enable LTPO, reducing power consumption by 18-22% versus prior-generation LTPS panels.[4]Apple Inc. "Investor Relations." Accessed February 6, 2026.
Micro-LED is advancing at a 4.35% CAGR through 2031, transitioning from laboratory prototypes to commercial pilots as PlayNitride and Porotech shipped evaluation kits to tier-1 OEMs in 2025 for smartwatch and AR glasses applications. Mass transfer yield rates remain the binding constraint, currently below 70% for panels exceeding 2 inches diagonal versus 95%+ for mature OLED lines, sustaining a 4-6x cost premium that confines Micro-LED to ultra-premium segments in the near term.


By Resolution: 4K Maturity Versus 8K Content Lag
The transition from HD to ultra-high-definition formats reveals a bifurcated market where 4K has achieved mainstream penetration while 8K remains constrained by ecosystem gaps. 4K resolution commanded 45.36% market share in 2025, sustained by replacement cycles in developed markets where installed bases exceed 150 million units and by penetration gains in emerging economies where 4K pricing fell below USD 400 for 55-inch models in late 2025.
8K panel production costs declined 15-20% between 2024 and 2025 due to yield improvements and Gen-10.5 fab efficiencies, yet retail pricing remains 2-3x higher than comparable 4K models, limiting adoption to early adopters and commercial installations. Broadcast infrastructure upgrades lag by 3-5 years in most markets, with only Japan and South Korea deploying 8K terrestrial broadcasts as of 2025, further constraining content supply and delaying mass-market adoption. HD formats benefit from entrenched installed bases exceeding 1 billion units globally, ensuring sustained demand for replacement panels and aftermarket repairs through the forecast period despite migration toward higher resolutions.
By Application: Television Anchor Meets AR/VR Surge
Application segmentation reveals a market transitioning from traditional consumer electronics toward immersive computing and automotive integration. Television applications held 33.66% market share in 2025, anchored by replacement cycles in North America and Europe and first-time purchases in India and South-East Asia, yet growth is decelerating as market saturation approaches in developed economies. Smartphones and tablets command a substantial share driven by OLED adoption across flagship models and foldable form factors that integrate multiple display functions into single panels, with Samsung Display supplying approximately 75% of foldable OLED panels in 2025.
Automotive and transportation applications are expanding faster than the overall market, driven by unified glass cockpits that multiply panel area per vehicle by 2-3x as discrete instrument clusters and infotainment screens converge into single curved displays spanning 30-50 inches. The fastest-growing applications-wearables, AR/VR, and automotive-share common requirements for power efficiency, curved form factors, and high pixel density that favor OLED and emerging Micro-LED architectures over conventional LCD.
By Panel Size: Large Format Stability, Mid-Size Acceleration
Panel size segmentation reflects diverging demand patterns across consumer electronics, automotive, and commercial applications. The 33-65 inch segment captured 36.81% market share in 2025, dominated by television applications where Gen-10.5 fabs in China achieve economies of scale for 55-65 inch 4K panels that retail below USD 400 in emerging markets. The 6.1-13 inch segment is growing at 5.03% CAGR through 2031, driven by foldable smartphones that unfold to 7-8 inch tablet formats, automotive instrument clusters integrating 10-12 inch curved OLED panels, and laptop displays adopting mini-LED backlighting for premium gaming and creative professional segments.
Foldable smartphones shipped 22 million units in 2025, a 46% increase over 2024, with Samsung Display supplying approximately 75% of foldable OLED panels leveraging ultra-thin glass (UTG) substrates that reduce crease visibility by 30-40% versus polyimide films. Large format panels measuring 66 inches and above confront margin pressure as Gen-10.5 fabs optimize cutting patterns for 65-75 inch yields, creating economic disadvantages for 80+ inch production that require custom tooling and lower utilization rates.
Geography Analysis
Asia Pacific captured USD 83.1 billion, or 49.72% of 2025 revenue, as Chinese Gen-8.6 and Gen-10.5 capacity additions expanded annual output by 15 million square meters. China's dominance reflects state-backed financing that enabled BOE Technology Group and TCL CSOT to commit over USD 12 billion combined between 2024 and 2025 for Gen-10.5 capacity, creating cost structures that deter new entrants and favor incumbents with access to subsidized capital. India attracted over USD 3 billion in display manufacturing investments during 2025 under the Production-Linked Incentive (PLI) scheme, with Samsung Display and Dixon Technologies announcing partnerships to establish display module assembly facilities targeting domestic smartphone and television markets.
North America sustains a substantial share through premium television and automotive display demand, yet limited domestic panel production creates dependence on Asian imports that expose supply chains to geopolitical and logistics risks. Europe faces similar constraints with minimal domestic panel manufacturing capacity outside specialized medical and industrial segments, while PFAS restrictions on polarizer films, effective January 2026, add regulatory complexity that Asian manufacturers must navigate to maintain market access. South America confronts infrastructure limitations, with Brazil's import tariffs on display panels reaching 20-25% that incentivize local assembly but deter upstream investments in TFT and color filter production.
Africa remains an emerging market with South Africa and Egypt serving as regional distribution hubs, yet limited local manufacturing and import-dependent supply chains constrain growth relative to other developing regions. Middle East growth concentrates in Saudi Arabia's NEOM project and UAE's Dubai Silicon Oasis, which are developing electronics manufacturing clusters that include display testing and quality assurance capabilities, positioning the region to capture assembly and module integration value even as upstream panel fabrication remains in Asia.

Competitive Landscape
The display panel market remains moderately concentrated. Samsung Display, LG Display and BOE controlled a high share of 2025 OLED capacity, leveraging depreciated Gen-8.5 LCD fabs to defend share in cost-sensitive segments while funding OLED and Micro-LED pilots. BOE activated its fifth Gen-8-plus OLED line in December 2025, while Visionox and TCL CSOT announced multibillion-dollar Gen-8.6 commitments for inkjet-printed OLED.
Specialty niches display higher fragmentation. E Ink maintained over 90% of its color electrophoretic shipments by capitalizing on its proprietary microcapsule IP, which expires after 2027. Defense avionics adopted substrate-free holographic waveguides, with Lumus and Kopin securing combined contracts worth USD 50 million.
Future differentiation centers on LTPO backplane engineering and Micro-LED mass transfer yields. Patent filings for flexible OLED substrates surpassed 2,500 in 2025, with Samsung Display and BOE accounting for a considerale share of the applications. Medical-grade 1,000-nit diagnostic displays are an emerging white space where incumbents face pricing pressure from Chinese entrants.
Display Panel Industry Leaders
-
Samsung Display Co., Ltd.
-
BOE Technology Group Co., Ltd.
-
LG Display Co., Ltd.
-
AUO Corporation
-
Innolux Corporation
- *Disclaimer: Major Players sorted in no particular order

Recent Industry Developments
- January 2026: Corning began equipment move-in at its USD 500 million Taiwan substrate expansion scheduled for 4Q 2026 completion, aiming to raise OLED glass output by 30%.
- December 2025: BOE lit up its B16 Gen-8.6 AMOLED line in Chengdu ahead of schedule, targeting 48,000 substrates per month by mid-2026.
- November 2025: Visionox broke ground on a USD 7.6 billion AMOLED fab in Hefei, China, to supply foldable and automotive-grade panels from 2027.
- October 2025: TCL CSOT committed USD 4 billion to build an 8.6-Gen inkjet-printed OLED line in Guangzhou with 2028 production start, aiming for 30-40% material savings.
- September 2025: Samsung Display and Apple finalized a supply pact covering 15–20 million foldable OLED panels annually for an iPhone model slated for 2026 launch.


Global Display Panel Market Report Scope
The display panel is an electronic screen that can display information in visual or tactile form. Panel displays are electronic viewing technologies that enable people to see content in a range of entertainment, consumer electronics, personal computers, mobile devices, and many types of medical, transportation, and industrial equipment.
The Display Panel Market Report is Segmented by Display Type (LCD, OLED, Micro-LED, AMOLED, and Other Types), Resolution (HD/WQHD/FHD, 4K, and 8K and Above), Application (Smartphones and Tablets, PC and Laptop, Television, Automotive and Transportation, Wearables and AR/VR, and Industrial/Medical/Others), Panel Size (≤6-inch, 6.1-13-inch, 13.1-32-inch, 33-65-inch, and ≥66-inch), and Geography (North America, South America, Europe, Asia Pacific, Middle East, and Africa). The Market Forecasts are Provided in Terms of Value (USD).
| LCD |
| OLED |
| Micro-LED |
| AMOLED |
| Other Display types |
| HD (HD/WQHD/FHD) |
| 4K |
| 8K and Above |
| Smartphones and Tablets |
| PC and Laptop |
| Television |
| Automotive and Transportation |
| Wearables and AR/VR |
| Industrial, Medical and Others |
| ≤6-inch |
| 6.1-13-inch |
| 13.1-32-inch |
| 33-65-inch |
| ≥66-inch |
| North America | United States |
| Canada | |
| Mexico | |
| South America | Brazil |
| Argentina | |
| Rest of South America | |
| Europe | Germany |
| United Kingdom | |
| France | |
| Russia | |
| Rest of Europe | |
| Asia Pacific | China |
| Japan | |
| India | |
| South Korea | |
| South-East Asia | |
| Rest of Asia Pacific | |
| Middle East | Saudi Arabia |
| United Arab Emirates | |
| Rest of Middle East | |
| Africa | South Africa |
| Egypt | |
| Rest of Africa |
| Display Type | LCD | |
| OLED | ||
| Micro-LED | ||
| AMOLED | ||
| Other Display types | ||
| By Resolution | HD (HD/WQHD/FHD) | |
| 4K | ||
| 8K and Above | ||
| By Application | Smartphones and Tablets | |
| PC and Laptop | ||
| Television | ||
| Automotive and Transportation | ||
| Wearables and AR/VR | ||
| Industrial, Medical and Others | ||
| By Panel Size | ≤6-inch | |
| 6.1-13-inch | ||
| 13.1-32-inch | ||
| 33-65-inch | ||
| ≥66-inch | ||
| By Geography | North America | United States |
| Canada | ||
| Mexico | ||
| South America | Brazil | |
| Argentina | ||
| Rest of South America | ||
| Europe | Germany | |
| United Kingdom | ||
| France | ||
| Russia | ||
| Rest of Europe | ||
| Asia Pacific | China | |
| Japan | ||
| India | ||
| South Korea | ||
| South-East Asia | ||
| Rest of Asia Pacific | ||
| Middle East | Saudi Arabia | |
| United Arab Emirates | ||
| Rest of Middle East | ||
| Africa | South Africa | |
| Egypt | ||
| Rest of Africa | ||


Key Questions Answered in the Report
How large will the display panel market be by 2031?
It is projected to reach USD 210.68 billion by 2031, growing at a 4.05% CAGR between 2026 and 2031.
Which technology leads unit shipments today?
OLED held a 40.74% share of 2025 revenue, driven by broad smartphone and television adoption.
What is the fastest-growing resolution segment?
8K and above panels post the highest forecast growth at a 5.11% CAGR through 2031, although content scarcity still limits volumes.
Which region will expand the quickest?
The Middle East is forecast to grow at 4.98% CAGR as Saudi Arabia and the UAE invest in local display assembly capacity.
Page last updated on:


