Flare Monitoring Market Size and Share
Market Overview
| Study Period | 2020 - 2031 |
|---|---|
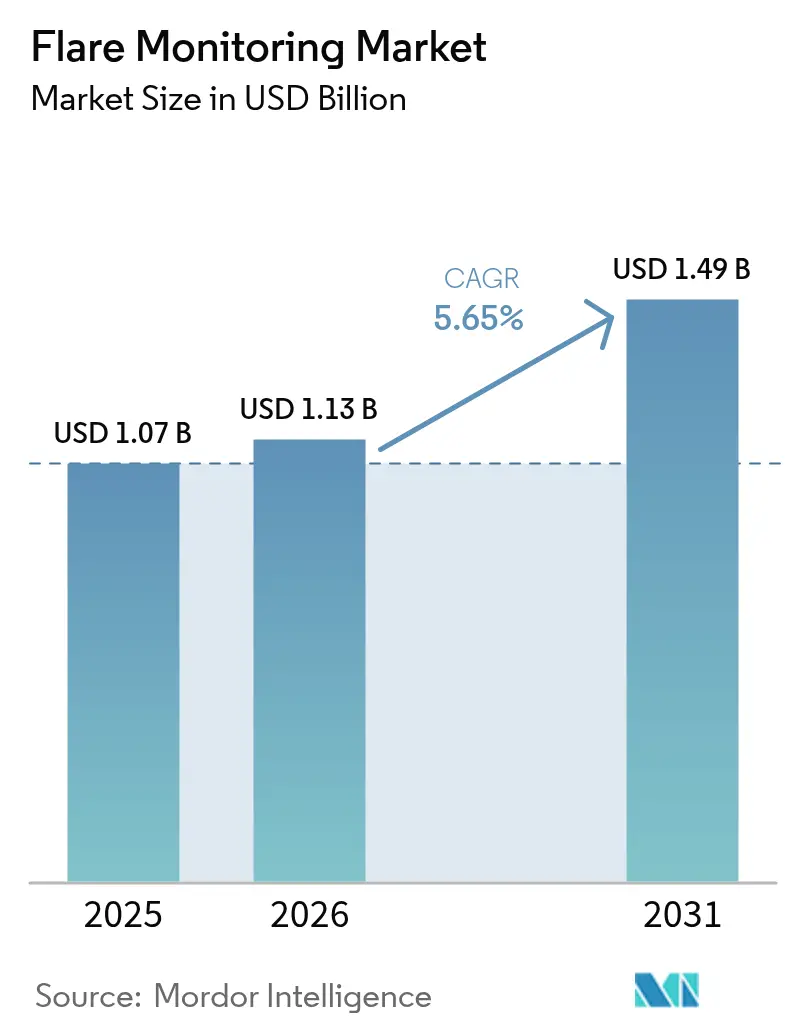
| Market Size (2026) | USD 1.13 Billion |
| Market Size (2031) | USD 1.49 Billion |
| Growth Rate (2026 - 2031) | 5.65% CAGR |
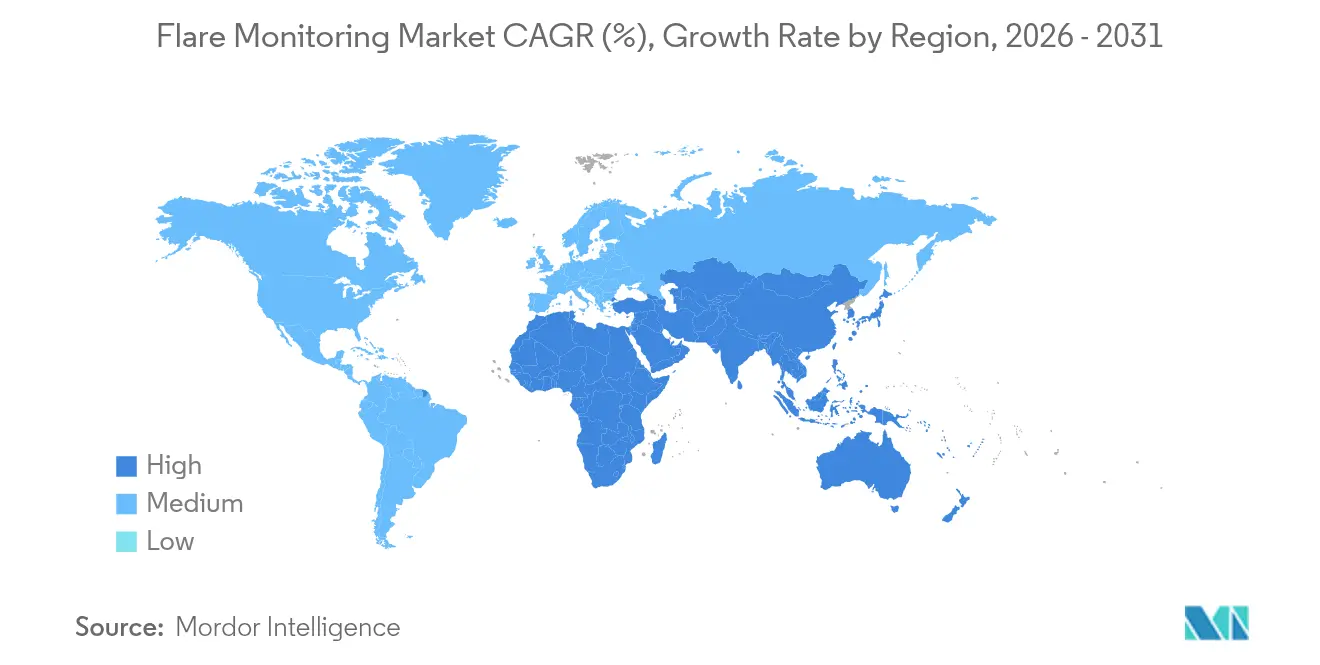
| Fastest Growing Market | Asia Pacific |
| Largest Market | North America |
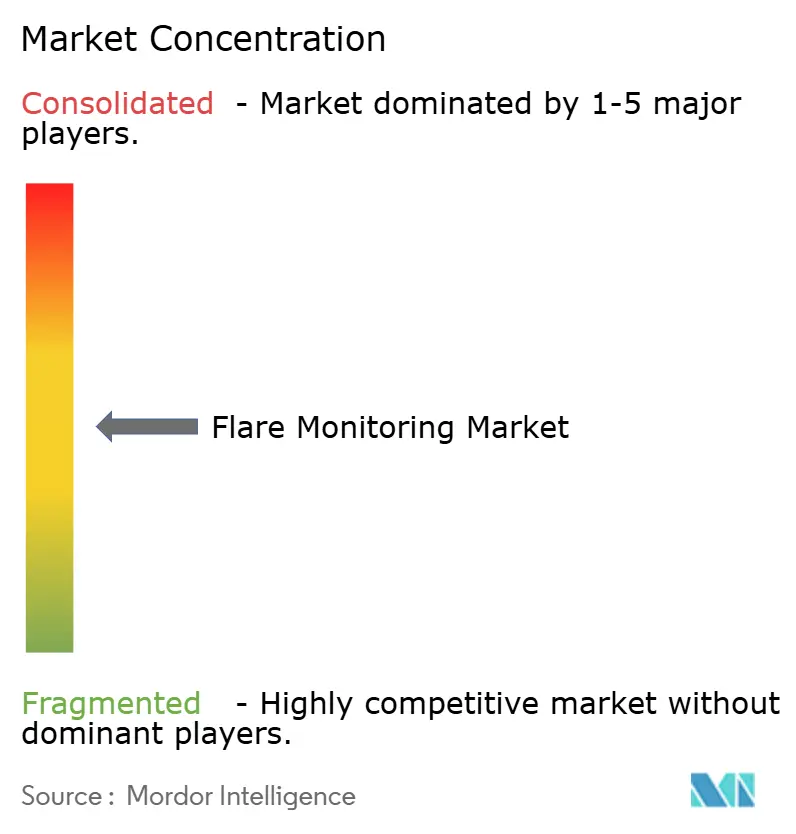
| Market Concentration | Medium |
Major Players *Disclaimer: Major Players sorted in no particular order Image © Mordor Intelligence. Reuse requires attribution under CC BY 4.0. | |
Flare Monitoring Market Analysis by Mordor Intelligence
The flare monitoring market size is expected to grow from USD 1.07 billion in 2025 to USD 1.13 billion in 2026 and is forecast to reach USD 1.49 billion by 2031 at 5.65% CAGR over 2026-2031. This growth trajectory is underpinned by tightening environmental regulations such as the U.S. EPA NSPS OOOOb methane rules and the widening reach of the EU Emissions Trading System, both of which reward precise emissions reporting. Operators are responding by integrating continuous monitoring to avoid carbon liabilities and to unlock operational efficiencies that can cut fuel loss. Investments in LNG export terminals, refinery expansions in Asia, and digital twin deployments offshore are also expanding the installed base. Meanwhile, AI-enabled video analytics and edge-connected sensors reduce downtime and improve combustion efficiency, making compliance more cost-effective and automated.
Key Report Takeaways
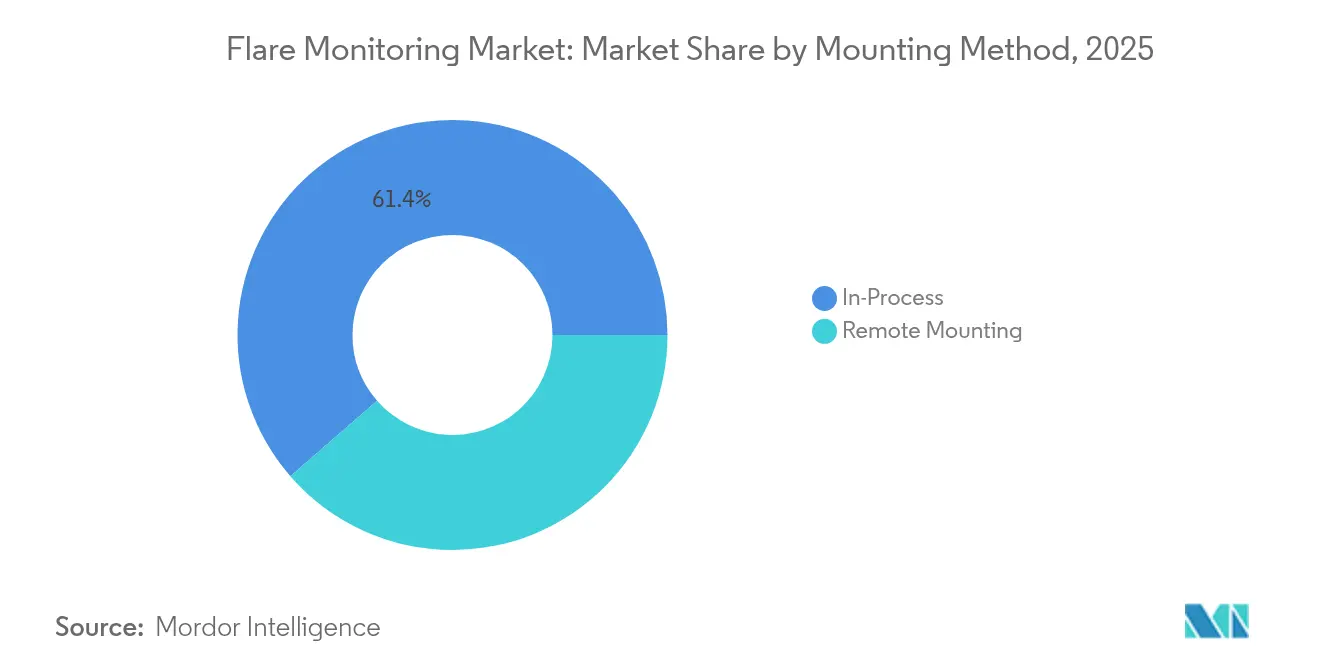
- By mounting method, in-process systems held 61.40% revenue share in 2025, while remote mounting posted the fastest CAGR at 6.05% through 2031.
- By component, hardware dominated the flare monitoring market with a 73.10% market share in 2025; services are forecast to grow the fastest at 6.85% CAGR by 2031.
- By installation type, onshore facilities accounted for 57.20% share of the flare monitoring market size in 2025, yet offshore installations are on track for a 6.25% CAGR to 2031.
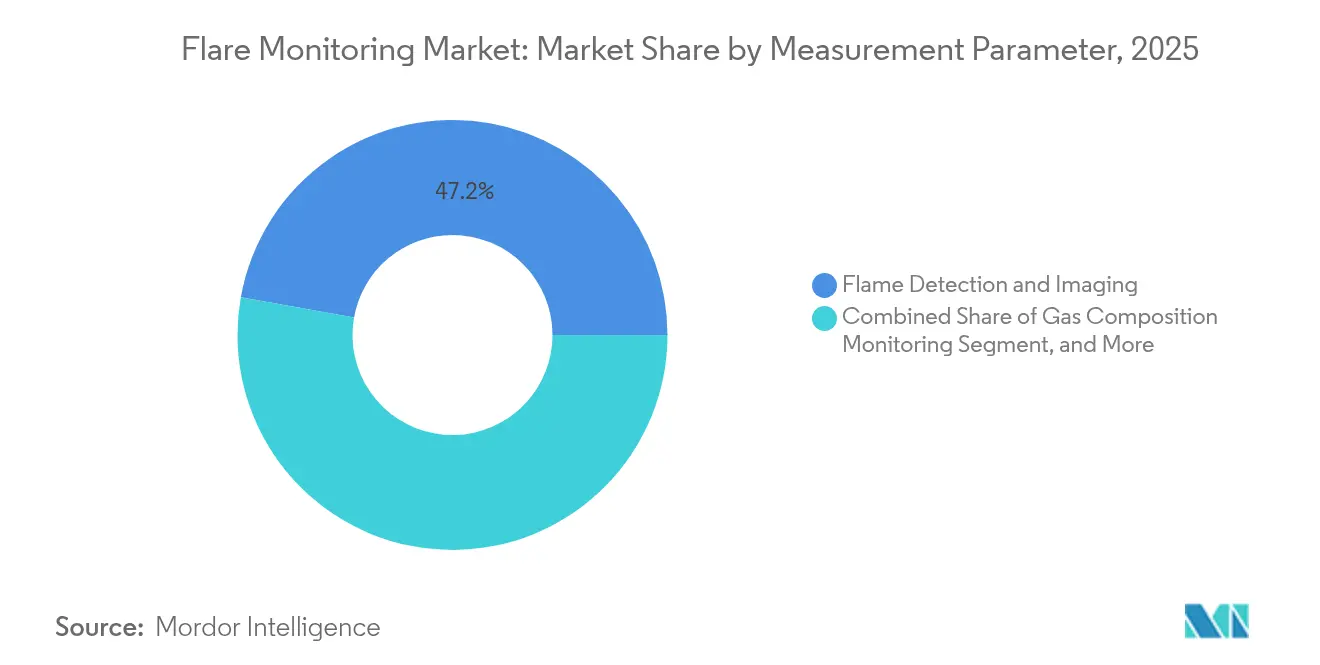
- By measurement parameter, flame detection and imaging led with 47.20% share in 2025, whereas gas-composition monitoring is expected to expand at 7.95% CAGR to 2031.
- By end-user, oil refineries captured 39.60% of the flare monitoring market share in 2025; upstream offshore operations are projected to surge at 6.95% CAGR through 2031.
- By geography, North America led with 33.90% share in 2025, while Asia-Pacific is set to record a 6.15% CAGR through 2031.
Note: Market size and forecast figures in this report are generated using Mordor Intelligence’s proprietary estimation framework, updated with the latest available data and insights as of 2026.
Global Flare Monitoring Market Trends and Insights
Drivers Impact Analysis*
| Driver | (~) % Impact on CAGR Forecast | Geographic Relevance | Impact Timeline |
|---|---|---|---|
| Carbon-pricing schemes in Canada & EU ETS | +1.20% | North America and EU | Medium term (2-4 years) |
| AI-enabled video analytics | +0.80% | Global | Short term (≤ 2 years) |
| Shale-driven EPA Quad Oa monitoring (US) | +1.50% | North America | Short term (≤ 2 years) |
| Flare-gas capture incentives by Middle-East NOCs | +0.70% | Middle East and Africa | Medium term (2-4 years) |
| Rapid LNG export-terminal build-out | +1.10% | North America and Asia-Pacific | Medium term (2-4 years) |
| Digital-twin remote operations offshore | +0.40% | Global, offshore focus | Long term (≥ 4 years) |
| Source: Mordor Intelligence | |||
Implementation of Carbon-Pricing Schemes in Canada and EU ETS
Mandatory carbon fees convert accurate flare data into direct cost savings. The EU ETS trimmed emissions from covered sites by 16.5% in 2023, sustaining price signals that favor robust measurement climate. [1]Directorate-General for Climate Action, “2024 Carbon Market Report,” climate.ec.europa.eu Canada’s federal carbon price parallels that incentive, and the upcoming ETS2 expansion will extend fees to transport and buildings. With more assets falling under capped systems, operators increasingly view precise flare metrics as a hedge against escalating liabilities, stimulating procurement across the flare monitoring market.
AI-Enabled Video Analytics to Optimise Combustion Efficiency
Edge-deployed machine learning detects poor combustion within milliseconds, allowing real-time valve adjustments that raise flare destruction efficiency and trim fuel gas use. Honeywell’s suite demonstrates double-digit gains in worker productivity when AI supports monitoring workloads. [2]Honeywell, “Honeywell To Power Energy Sector With New Artificial Intelligence Solutions,” honeywell.com As offshore assets funnel 10 TB/day of video and sensor data, automated analytics turn that stream into actionable insights, underpinning predictive maintenance and safer operating envelopes.
Shale-Driven Tight-Oil Growth Mandating EPA Quad Oa Compliance (US)
Super-emitter provisions now obligate every basin producer to investigate methane spikes above 100 kg/h and to file third-party-verified reports within 15 days. [3]U.S. Environmental Protection Agency, “Small Entity Compliance Guide for Oil and Natural Gas Sector: Subpart OOOOb,” epa.govThe distributed nature of shale, with thousands of pads spread across a wide geography, amplifies the demand for scalable, remote-mount solutions that integrate seamlessly into existing SCADA systems. Avoiding the new Methane Waste Emission Charge hinges on deploying certified flare sensors, thereby directly expanding the flare monitoring market.
Flare-Gas Capture Incentives by Middle-East NOCs
Saudi Aramco’s USD 25 billion Jafurah build-out and near-zero routine flaring benchmark compel continuous verification systems to track captured volumes. ADNOC’s CCS projects likewise rely on high-resolution flare data to document sequestration gains. These programs transform monitoring from compliance overhead into a profit center that maximizes sales of previously wasted gas, nurturing regional demand.
Restraints Impact Analysis*
| Restraint | (~) % Impact on CAGR Forecast | Geographic Relevance | Impact Timeline |
|---|---|---|---|
| Retrofit costs for brown-field SE-Asia refineries | -0.60% | Southeast Asia | Medium term (2-4 years) |
| Data-latency & cyber-security limits offshore | -0.40% | Global, offshore focus | Short term (≤ 2 years) |
| Measurement uncertainty in methane-slip | -0.30% | Global | Long term (≥ 4 years) |
| Zero-routine-flaring 2030 pledges | -0.80% | Global | Medium term (2-4 years) |
| Source: Mordor Intelligence | |||
High Retrofit Cost for Brown-Field Refineries in SE Asia
Projects such as Vietnam’s Dung Quat upgrade require multi-million-dollar piping and electrical modifications before sensors can be mounted. Smaller operators face cash-flow hurdles and elect phased installations that stretch timelines, muting near-term uptake across the flare monitoring market.
Data-Latency and Cyber-Security Limitations on Remote Platforms
Maritime OT infrastructure lags behind modern IT standards, increasing vulnerability to ransomware and limiting real-time data speed. The 2021 Colonial Pipeline incident highlighted financial exposure; consequently, some offshore operators throttle bandwidth or isolate networks, which undermines instantaneous analytics and tempers growth momentum.
*Our forecasts treat driver/restraint impacts as directional, not additive. The impact forecasts reflect baseline growth, mix effects, and variable interactions.
Segment Analysis
By Mounting Method: Remote Technologies Gaining Momentum
In-process mounting systems controlled 61.40% of the flare monitoring market in 2025 thanks to embedded gas analyzers that feed refinery DCS platforms for instant compliance reporting. Remote-mount optics are gaining traction because they eliminate the need for scaffolding, cable trays, and hot-work permits, allowing brownfield assets to add continuous surveillance with minimal downtime. Saudi Aramco’s Marjan GOSP-4 pilot streams infrared imagery into a cloud twin that supervisors can open from any control room. The savings from avoided mobility rounds and faster anomaly detection now outweigh the capital premium for hardened multi-spectrum lenses.
Remote solutions are expanding at a 6.05% CAGR and will lift their contribution to the overall flare monitoring market size when new LNG terminals finish commissioning in 2028. UV-IR cameras, drone-mounted gas imagers, and acoustic detectors now connect through wireless mesh nodes rated for Class 1/Division 2 areas. That architecture supports unmanned facilities in shale plays, reducing travel emissions while maintaining real-time visibility into every stack. Because operators can verify pilot flames and combustion indices without setting foot on site, the flare monitoring market is expected to see remote systems transition from niche to mainstream by the end of the decade.


By Component: Services Segment Accelerating Growth
Hardware-cameras, pyrometers, ultrasonic meters-delivered 73.10% of 2025 revenue, but its dominance is eroding as customers seek turnkey compliance. The services stream logs the fastest 6.85% CAGR, riding demand for lifecycle calibration, AI algorithm tuning, and quarterly reporting that satisfies voluntary methane-intensity scorecards. Baker Hughes’ flare. The IQ rollout across 65 bp sites offers a blueprint. Sensors feed a cloud engine that emails root-cause diagnostics to site leads within minutes of an efficiency slip.
Under outcome-based contracts, integrators guarantee uptime and regulatory filing accuracy, turning the flare monitoring market into a recurring-revenue engine. Firmware updates now push new neural-network models straight to edge devices, so performance improves without metal replacement. As a result, the flare monitoring market size for services is expected to surpass USD 472.6 million by 2031, while hardware revenue is projected to remain relatively stable.
By Installation Type: Offshore Segment Driving Innovation
Onshore plants still held 57.20% of flare monitoring market share in 2025 because refinery clusters on the U.S. Gulf Coast and East China Plain run multiple stacks side by side. Offshore production hubs, however, are expanding at 6.25% CAGR as methane slip in shallow-water flares reaches 23–66%, a range that draws investor scrutiny. Noble’s Energy Efficiency Insights tool now tracks diesel burn, generator load, and flare destruction efficiency across its drillship fleet, cutting fuel cost and greenhouse-gas intensity in one move.
Harsh sea spray, vibration, and corrosion force vendors to ruggedize housings, add redundant fiber loops, and embed AI at the edge to overcome satellite latency. Digital-twin dashboards let shore-based specialists overlay flare KPIs onto topside 3-D models, saving helicopter trips while meeting class-society audit rules. These advances will raise offshore installations’ slice of flare monitoring market size through 2031, especially as Brazil and Guyana sanction new FPSOs that require Tier III combustion monitoring from day one.
By Measurement Parameter: Gas Composition Monitoring Emerging
Flame detection and imaging accounted for 47.20% of 2025 revenue, as safety rules still require visible confirmation of pilot lights and smoke. The fastest rising parameter, gas-composition monitoring, is projected to expand at an 7.95% CAGR, as regulators shift from volume-only reporting to component-level disclosure. SLB’s easy-install methane meter clamps to a line in under two hours yet records parts-per-million accuracy, allowing continuous reconciliation with reported flare recovery.
Real-time speciation enables operators to tune air-to-fuel ratios, thereby curbing soot while maximizing destruction efficiency. Laser-based spectroscopy, Fourier-transform infrared (FT-IR) cells, and tunable diode arrays are now integrated into a single skid that auto-calibrates with every shift. As carbon taxation expands, compositional analytics transform flare readings into a “fiscal” signal that prevents overpaying on methane charges, thereby increasing this segment’s share of the overall flare monitoring market size.
By End-User: Upstream Offshore Leading Growth
Oil refineries captured 39.60% of 2025 demand, buoyed by Tier III fuel rules and the requirement to certify flare performance during every major turnaround. Upstream offshore operations hold the steepest growth curve at 6.95% CAGR because deep-water developments require remote diagnostics capable of flagging leaks under varying wind vectors. Aker BP’s Yggdrasil field folds flare data into reservoir models, showing how production engineers now co-opt environmental data for process optimization.
LNG liquefaction trains, petrochemical crackers, and even landfill-gas plants round out adoption. Each faces corporate-level ESG audits that rank methane intensity against peers. Here, a central analytics cockpit aggregates feeds from hundreds of flare stacks worldwide, comparing combustion slip in real time. With investors penalizing any facility with outlier emissions, the flare monitoring market sees multi-industry uptake accelerating across the back half of the forecast window.
Geography Analysis
North America led the flare monitoring market with 33.90% share in 2025, bolstered by the EPA’s super-emitter rule and LNG export capacity poised to rise from 11.4 Bcf/d to 24.3 Bcf/d by 2027. U.S. shale pads in the Permian and Haynesville deploy networked imagers that relay alerts within minutes, while Canada’s carbon fee amplifies ROI on accurate metering. Mexico’s Pacific Coast LNG ventures add incremental demand as they seek U.S.-grade compliance to satisfy Asian offtakers.
Europe sits in second place, its market defined by the EU ETS and a 16.5% drop in covered emissions during 2023. North Sea operators retrofit electrified platforms that rely on high-resolution flare data to validate the gains from electrification. Germany’s downstream sector and the U.K.’s mature fields both favor integrated hardware-software suites to streamline annual EU MRV audits.
Asia-Pacific is the fastest-growing territory at 6.15% CAGR to 2031. China’s carbon-neutral pledge drives large-scale refinery revamps that embed automated flaring dashboards. India’s public refiner expansions and Vietnam’s 30% capacity bump at Dung Quat increase tender flow for turnkey solutions. Japan and South Korea, armed with advanced sensor OEMs, serve as technology testbeds before broader regional rollouts. Collectively, these investments ensure the region’s contribution to flare monitoring market size will keep edging upward.

Competitive Landscape
The competitive arena is moderately fragmented. ABB, Siemens, Honeywell, and Emerson integrate DCS platforms with multispectral imagers and IIoT gateways to secure customer loyalty. Honeywell’s January 2025 Emissions Management Suite rollout for marine and offshore zones exemplifies product tailoring for niche environments automation. Siemens counters with AI-driven edge firmware that is embedded directly in networked cameras, thereby lowering latency.
Specialists such as Baker Hughes and SLB target pain points, namely methane analytics and easy-install hardware. Baker Hughes’ flare.IQ's collaboration with BP encompasses 65 flares across seven regions, illustrating the scale of their partnership through service contracts. SLB’s May 2024 clamp-on meters cut install time to hours, enticing fast-track LNG builders. Consolidation is underway; CECO Environmental’s USD 122.7 million acquisition of Profire Energy augments burner management alongside emissions sensors.
White-space remains around SaaS dashboards that translate raw stack data into investor-grade ESG metrics. Partnerships, such as those between Endress+Hauser and SICK, merge flow-measurement prowess with gas analytics, signaling the future convergence of instrumentation and cloud analytics. Competitive intensity is expected to rise as regional start-ups exploit lower entry barriers offered by open-protocol edge computing.
Flare Monitoring Industry Leaders
ABB
Siemens AG
Honeywell International Inc.
Emerson Electric Co.
Teledyne FLIR Systems
- *Disclaimer: Major Players sorted in no particular order

Recent Industry Developments
- April 2025: Thermo Fisher Scientific committed USD 2 billion to expand U.S. manufacturing and R&D, with USD 500 million earmarked for analytical instruments.
- April 2025: SLB confirmed that all U.S. antitrust waiting periods for its ChampionX purchase have expired, moving the deal to final clearances.
- March 2025: Honeywell and Verizon Business embedded 5G connectivity in Honeywell smart meters to enhance real-time utility data.
- January 2025: CECO Environmental closed the USD 122.7 million acquisition of Profire Energy, enlarging its combustion-control portfolio.


Research Methodology Framework and Report Scope
Market Definitions and Key Coverage
Our study defines the global flare monitoring market as all hardware, software, and associated services that continuously detect flame presence, combustion efficiency, gas composition, and smoke density on industrial flare stacks used in oil refineries, petrochemical plants, upstream oil and gas sites, LNG facilities, and regulated landfills.
Scope exclusion: portable hand-held gas sniffers and generic thermal cameras not integrated with fixed flare systems are outside the estimate.
Segmentation Overview
- By Mounting Method
- In-Process Mounting
- Gas Analyzer
- Calorimeter
- Mass Spectrometer
- Gas Chromatograph
- Remote Mounting
- Multi-Spectrum IR (MSIR)
- Thermal Imager (IR)
- UV-IR Imager
- Other Remote Mounting
- In-Process Mounting
- By Component
- Hardware
- Detectors and Sensors
- Imaging Devices
- Video Cameras
- Transmitters
- Software
- Services
- Hardware
- By Installation Type
- Onshore
- Offshore
- By Measurement Parameter
- Gas Composition Monitoring
- Flow Rate Monitoring
- Flame Detection and Imaging
- Smoke/Black-Carbon Emission
- By End-User
- Oil Refineries
- Petrochemical Plants
- Upstream Oil and Gas (Onshore)
- Upstream Oil and Gas (Offshore)
- LNG and Gas-Processing Facilities
- Landfills and Biogas Plants
- Chemical Manufacturing
- Other End-User Industries
- By Geography
- North America
- United States
- Canada
- Mexico
- South America
- Brazil
- Rest of South America
- Asia-Pacific
- China
- Japan
- India
- Southeast Asia
- Rest of Asia-Pacific
- Europe
- Germany
- United Kingdom
- France
- Nordics
- Rest of Europe
- Middle East and Africa
- Middle East
- Gulf Cooperation Council Countries
- Turkey
- Rest of Middle East
- Africa
- South Africa
- Rest of Africa
- Middle East
- North America
Detailed Research Methodology and Data Validation
Primary Research
Mordor analysts held structured calls with refinery maintenance heads, flare OEM engineers, regional regulators, and instrumentation distributors across North America, Europe, the Gulf, and Southeast Asia. These discussions validated installed-base estimates, retrofit timing, and realistic average selling prices. They then filled gaps on service attachment rates that public data rarely cover.
Desk Research
We began with open data that anchors volumes and stack counts, such as the U.S. EPA Greenhouse Gas Reporting Program, EEA Industrial Emissions database, World Bank Global Gas Flaring Reduction panel, OPEC refinery capacity statistics, and trade codes from UN Comtrade. Company 10-Ks, investor decks, and project EIA filings enrich plant-level spends, while patents retrieved through Questel reveal sensor adoption curves. Subscription tools like D&B Hoovers and Dow Jones Factiva supply revenue splits that let us benchmark vendor footprints. The sources cited are illustrative; many additional publications supported data gathering and cross-checks.
Market-Sizing and Forecasting
A top-down reconstruction starts with reported flare-stack counts and average sensor bills of material per site, which are then stress-tested through sampled vendor roll-ups and channel checks for bottom-up sense-checking. Key variables in the model include new refining capacity additions, mandated methane-fee investments, average retrofit cycle length, sensor ASP deflation, regulatory penalty benchmarks, and regional flare-up prevalence ratios. Multivariate regression links those drivers to spending, producing the 2025-2030 outlook. Assumption gaps in bottom-up rolls are bridged with conservative penetration factors agreed upon during interviews.
Data Validation and Update Cycle
Outputs pass anomaly scans, variance checks against historical ratios, and a peer review. Reports refresh each year, with mid-cycle reviews triggered by material policy shifts or mega plant approvals. Before delivery, an analyst performs a final data sweep so clients receive the freshest view.
Why our Flare Monitoring Baseline earns decision-makers' trust
Published figures diverge because firms pick different scope boundaries, pricing bases, and refresh cadences.
Key gap drivers include whether auxiliary thermal cameras unrelated to flare duty are counted, how retrofit discounts are applied, and the extent of primary validation.
Benchmark comparison
| Market Size | Anonymized source | Primary gap driver |
|---|---|---|
| USD 1.07 B (2025) | Mordor Intelligence | |
| USD 1.26 B (2024) | Global Consultancy A | includes cameras used for general fire watch, inflating totals |
| USD 1.43 B (2024) | Trade Journal B | lists catalog prices without ASP erosion or primary checks |
These contrasts show that Mordor's disciplined scope selection, double-sourced variables, and yearly refresh provide a balanced, transparent baseline clients can replicate and defend.


Key Questions Answered in the Report
What is the current value of the flare monitoring market?
The flare monitoring market is valued at USD 1.13 billion in 2026 and is projected to reach USD 1.49 billion by 2031
Which region leads the market today?
North America holds the largest regional position with 33.90% share in 2025, driven by stringent EPA methane rules and rapid LNG export growth.
What segment is growing the fastest?
Remote mounting systems show the highest segment growth at a 6.05% CAGR as operators move toward unmanned and digital-twin operations.
Why are services gaining popularity?
Services are attractive because monitoring-as-a-service spreads costs, bundles compliance reporting, and keeps systems optimized—leading to a 6.85% CAGR in the services segment.
How do carbon-pricing schemes influence adoption?
Carbon fees in the EU and Canada make accurate flare data essential for cost control; operators that monitor precisely can offset liabilities and avoid penalties, spurring investment in monitoring systems.
What challenges limit faster adoption?
High retrofit costs for older refineries in Southeast Asia and cyber-security constraints on remote offshore platforms can slow deployment timelines and raise project risk.
Page last updated on:


