
Application Container Market Size and Share
Market Overview
| Study Period | 2020 - 2031 |
|---|---|
| Market Size (2026) | USD 12.64 Billion |
| Market Size (2031) | USD 35.63 Billion |
| Growth Rate (2026 - 2031) | 23.03 % |
| Fastest Growing Market | Asia Pacific |
| Largest Market | North America |
| Market Concentration | Medium |
Major Players *Disclaimer: Major Players sorted in no particular order Image © Mordor Intelligence. Reuse requires attribution under CC BY 4.0. | |
Application Container Market Analysis by Mordor Intelligence
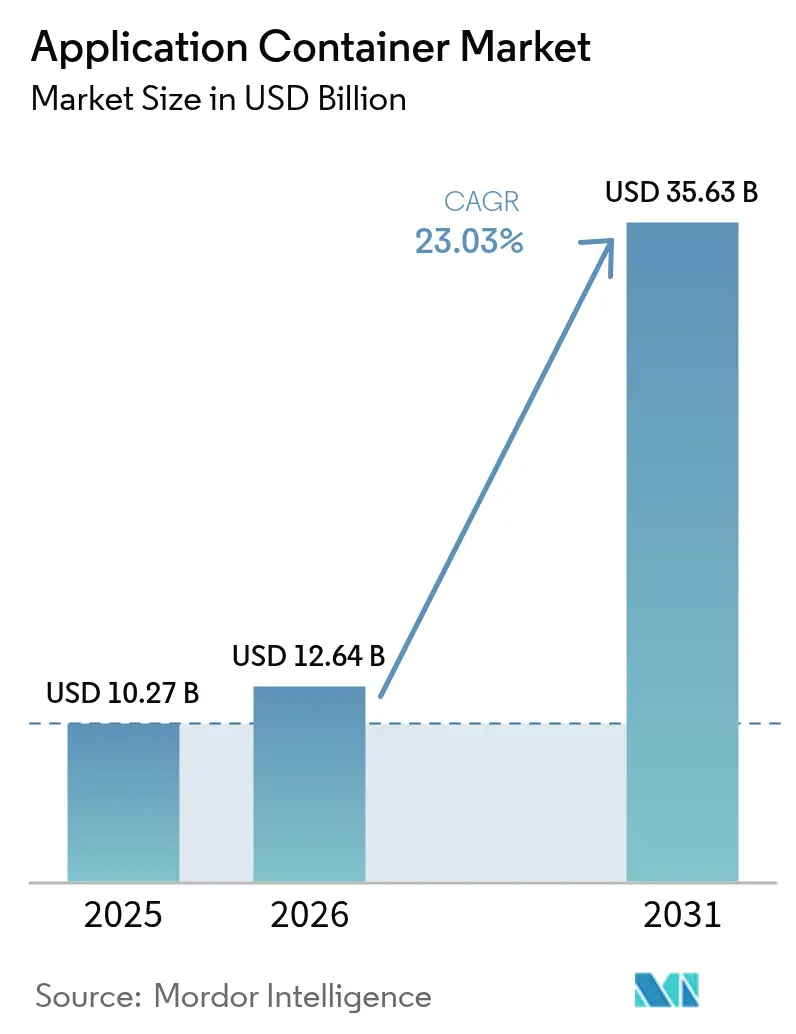
The application container market size is expected to grow from USD 10.27 billion in 2025 to USD 12.64 billion in 2026 and is forecast to reach USD 35.63 billion by 2031 at a 23.03% CAGR over 2026-2031. Persistent demand for microservices, DevOps automation, and hybrid cloud flexibility is expanding the addressable pool of workloads that can be containerized. Platform vendors are responding with turnkey Kubernetes offerings that abstract infrastructure complexity, while service providers capture value by integrating security, observability, and policy automation. Early adopters are now standardizing on containers for business-critical systems, demonstrating that performance overhead is lower than that of virtual machines and that workload density delivers measurable infrastructure savings. At the same time, headline risks related to misconfigurations and software supply-chain exposure have elevated security tooling from a niche concern to a board-level priority, creating additional momentum for the application container market.
Key Report Takeaways
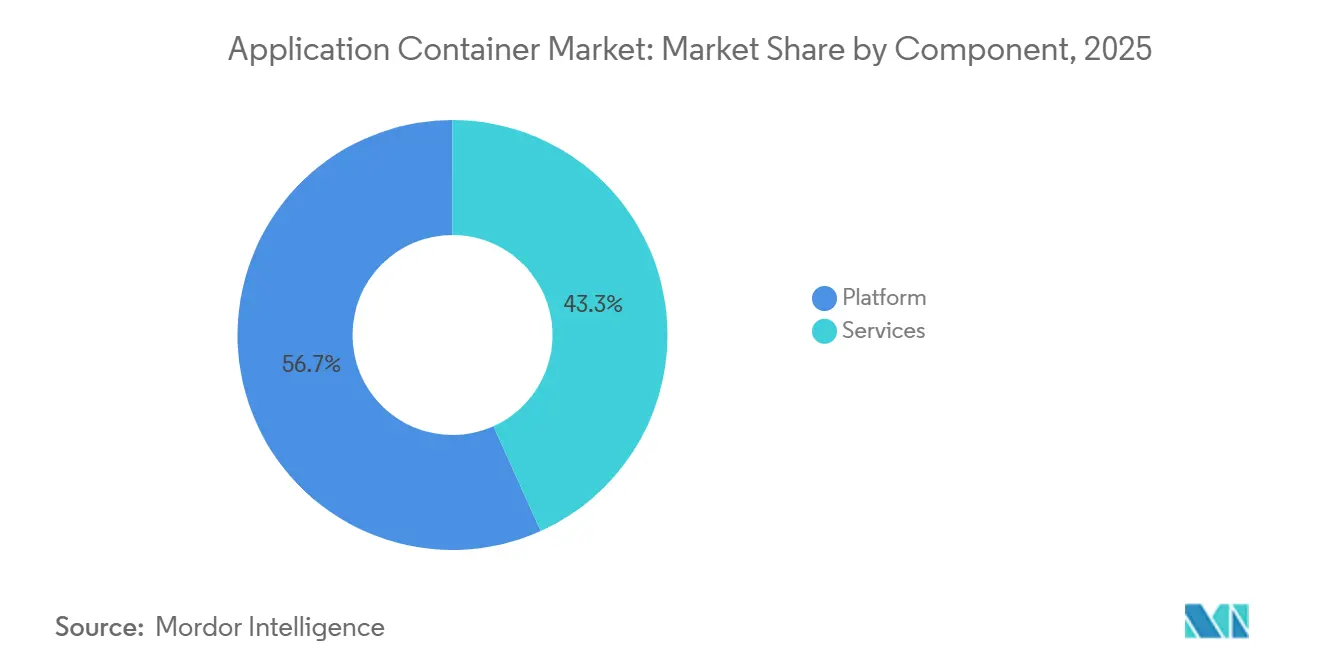
- By component, platform offerings led with 56.74% of the application container market share in 2025, whereas services are projected to advance at a 23.41% CAGR through 2031.
- By deployment model, public cloud held 71.34% of revenue in 2025, while hybrid and multi-cloud configurations are on track for 23.67% growth through 2031.
- By organization size, large enterprises accounted for 62.47% of the application container market share in 2025, and small and medium enterprises are set to expand container budgets at a 23.49% rate to 2031.
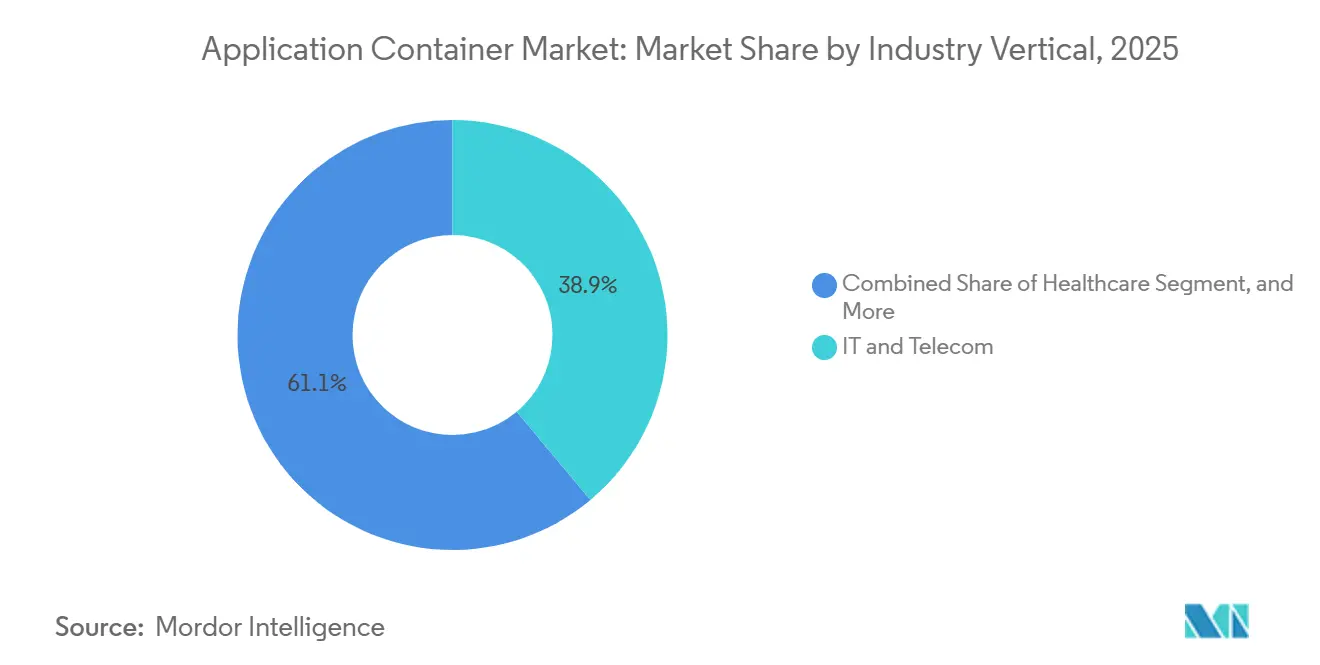
- By industry vertical, IT and telecom commanded 38.91% of 2025 demand, and healthcare is expected to post the fastest expansion at 24.27% through 2031.
- By container use-case area, management and orchestration tools captured 31.82% of the application container market share in 2025, but security solutions are forecast to grow by 24.29% during 2026-2031.
- By geography, North America accounted for 41.22% of 2025 revenue, and Asia-Pacific is expected to register the highest regional CAGR of 24.07% through 2031.
Note: Market size and forecast figures in this report are generated using Mordor Intelligence’s proprietary estimation framework, updated with the latest available data and insights as of 2026.
Global Application Container Market Trends and Insights
Drivers Impact Analysis*
| Driver | (~) % Impact on CAGR Forecast | Geographic Relevance | Impact Timeline |
|---|---|---|---|
| Accelerating adoption of microservices architecture | +5.2% | Global, with concentration in North America and Europe | Medium term (2-4 years) |
| Demand for hybrid and multi-cloud agility | +4.8% | Global, particularly Europe (GDPR compliance) and Asia-Pacific (sovereign cloud mandates) | Long term (≥ 4 years) |
| Surge in DevOps and CI/CD pipelines | +4.1% | North America and Europe, expanding to Asia-Pacific | Short term (≤ 2 years) |
| Need for resource optimization and cost efficiency | +3.6% | Global, with emphasis on cost-sensitive markets in South America and Middle East | Medium term (2-4 years) |
| Edge-native AI workloads needing lightweight runtimes | +2.9% | Asia-Pacific core, North America early adopters, spillover to Middle East and Africa | Long term (≥ 4 years) |
| Confidential computing requirements favor containerized secure enclaves | +2.4% | Europe (GDPR), North America (financial services), Asia-Pacific (government sectors) | Long term (≥ 4 years) |
| Source: Mordor Intelligence | |||
Accelerating Adoption of Microservices Architecture
The shift from monoliths to microservices is accelerating because enterprises can scale individual functions independently, shorten release cycles, and reduce blast radius during outages. Docker’s 2024 study found that containerized services are deployed 40% faster than monolithic stacks.[1]Docker Inc., “State of Application Development 2024,” docker.com Large financial institutions, including JPMorgan Chase, containerized more than 60% of trading and risk systems to improve resilience during volatile market events. Retail platforms use auto-scaling microservices to handle flash-sale traffic while keeping costs in check. Although service mesh sprawl and distributed tracing overhead introduce complexity, the productivity upside keeps the application container market on a steep growth trajectory.
Demand for Hybrid and Multi-Cloud Agility
Data residency laws such as GDPR and China’s Data Security Law forced 58% of multinational firms to split workloads across multiple clouds in 2025.[2]International Association of Privacy Professionals, “GDPR Enforcement Tracker 2025,” iapp.org Containers offer a consistent runtime that runs on AWS EKS, Google GKE, and Azure AKS without code rewrites, giving enterprises a way to avoid vendor lock-in. Red Hat disclosed that OpenShift customers now span an average of 2.7 cloud providers per deployment. The operational burden of harmonizing identity management and observability across heterogeneous estates is non-trivial, yet the strategic need to meet sovereignty mandates catalyzes spending on container platforms, strengthening the application container market.
Surge in DevOps and CI/CD Pipelines
Immutable, versioned container images align with continuous integration and deployment principles, enabling artifact promotion without configuration drift. GitLab’s 2025 survey found that teams running containerized pipelines delivered features 35% faster. Adoption of Kubernetes-native frameworks such as Tekton grew 120% year over year. Integrated vulnerability scanning and policy enforcement inside registries reduces friction between speed and security. Manufacturers accelerate firmware updates for industrial IoT devices, while healthcare providers streamline regulatory filings, reinforcing demand across the application container industry.
Need for Resource Optimization and Cost Efficiency
Containers share the host kernel, eliminating guest OS overhead. A 2025 Google Cloud analysis showed 60% lower memory use and 40% less CPU consumption for containerized workloads, saving a reference enterprise USD 1.2 million a year.[3]Google Cloud, “GKE Cost Optimization Best Practices 2025,” cloud.google.com AWS Fargate Spot pricing cuts compute costs by up to 70% for batch jobs. Higher density is vital at the edge, where hardware is scarce. Cost gains, however, require intelligent bin-packing and right-sizing tools, which stimulate purchases of advanced schedulers and fuel the application container market.
Restraints Impact Analysis*
| Restraint | (~) % Impact on CAGR Forecast | Geographic Relevance | Impact Timeline |
|---|---|---|---|
| Container security vulnerabilities and misconfigurations | -2.8% | Global, with acute impact in North America and Europe due to stringent compliance | Short term (≤ 2 years) |
| Complexity of large-scale orchestration | -2.1% | Global, particularly affecting enterprises in Asia-Pacific and South America with limited Kubernetes expertise | Medium term (2-4 years) |
| Rising SBOM compliance overhead for open-source containers | -1.4% | North America (federal mandates), Europe (supply chain regulations) | Medium term (2-4 years) |
| CPU-based licensing models penalizing high-density containers | -1.2% | North America and Europe, where legacy enterprise software vendors dominate | Short term (≤ 2 years) |
| Source: Mordor Intelligence | |||
Container Security Vulnerabilities and Misconfigurations
CISA’s January 2025 hardening guide attributed 67% of container breaches to misconfigured RBAC, exposed APIs, or stale images. The National Vulnerability Database logged 342 container CVEs in 2024, up 28% year on year. Unit 42 observed 1,200 daily attempts at cryptomining against misconfigured clusters. Regulators now require runtime threat detection and incident response attestations, adding compliance spend but also tightening buying criteria in the application container market.
Complexity of Large-Scale Orchestration
A Linux Foundation survey found that 54% of organizations needed more than 6 months to reach production-ready Kubernetes, and that Day-2 operations consumed 40% of platform-engineering time. VMware reported that 61% of enterprises operated 10 or more clusters in 2025, fragmenting policy management. Shortages of certified administrators drive salary premiums, especially in emerging markets, slowing rollouts, and tempering near-term expansion of the application container market.
*Our forecasts treat driver/restraint impacts as directional, not additive. The impact forecasts reflect baseline growth, mix effects, and variable interactions.
Segment Analysis
By Component: Services Gain as Complexity Outpaces In-House Expertise
Platform solutions captured 56.74% of the 2025 application container market share, underscoring the early preference for licensed runtimes, registries, and bundled orchestration suites. Services are forecast to expand at a 23.41% CAGR because enterprises struggle to keep pace with quarterly Kubernetes releases, multi-cluster governance, and escalating compliance reviews, leading them to be willing to pay for outside expertise. The application container market, attributable to services, is therefore positioned to outgrow platform revenue as buyers prioritize operational resilience over feature parity. IBM’s container advisory revenues grew 45% in 2025, showing that large banks and insurers view managed upgrades as cheaper than hiring scarce administrators. Vendors now embed AI-driven resource tuning into service contracts, shortening troubleshooting cycles and improving cost allocation accuracy.
Managed service providers also bundle 24x7 incident response, SBOM automation, and disaster-recovery drills that most internal platform teams cannot staff continuously. Smaller tools vendors answer mid-market needs with click-driven consoles, yet they often lack the certifications and indemnities sought by regulated industries. Global systems integrators fill that gap, stitching together multicloud landing zones, GitOps pipelines, and FinOps chargeback ledgers. Skills shortages are unlikely to ease before 2028, so recurring services spend should remain a durable pillar of the application container market. Over time, platform code will commoditize, but trusted operational expertise will keep service margins healthy.


By Deployment Model: Hybrid Configurations Surge Amid Sovereignty Mandates
Public cloud accounted for 71.34% of 2025 revenue because managed Kubernetes eliminated control-plane toil and paired seamlessly with native load balancers, IAM, and object storage. Hybrid and multi-cloud estates, however, are projected to climb at a 23.67% CAGR as data-residency laws and latency targets force enterprises to place clusters near users or regulated datasets. The application container market size for hybrid deployments is growing rapidly, as federation frameworks now let teams schedule pods across on-prem racks and multiple hyperscalers without code rewrites. The European Data Act and similar statutes in India and Indonesia heighten this trend by mandating in-country processing for consumer data.
Telecommunications operators have already split 5G core functions across private clouds to achieve sub-10-millisecond latency while shipping analytics workloads to inexpensive public regions, creating reference architectures that other industries follow. Chinese enterprises lifted hybrid Kubernetes usage by 80% in 2025, blending sovereign clouds with edge nodes in factories and branch offices. Consistency remains hard because network policies, service-mesh certificates, and audit logs must align across clusters, yet new policy engines and mesh federation tools are easing that friction. As governance frameworks solidify, hybrid rollouts will no longer be seen as exotic; rather, they will become an expected stage in the container adoption journey. The shift diversifies revenue away from single-provider lock-in, spreading growth across vendors that can power portability.
By Organization Size: SMEs Accelerate as Managed Services Lower Barriers
Large enterprises have spent 62.47% of their 2025 budget on refactoring monoliths and standing up platform engineering teams, which require significant capital and specialized labor. Small and medium enterprises are set to expand container consumption at a 23.49% rate through 2031, as autopilot modes on GKE and EKS Auto Mode eliminate node sizing, patching, and add-on installation hurdles. These abstractions let teams with only a few DevOps generalists deploy microservices in hours, not weeks, expanding the overall containerized application market beyond Fortune-500 budgets. Subscription tiers that bundle registry hosting, image scanning, and cost dashboards at per-user pricing resonate strongly with cash-conscious firms.
Even so, SMEs wrestle with vendor lock-in and are limited in-house security talent, so lightweight distributions such as K3s or MicroK8s gain traction where self-hosting remains attractive. Dashboard-centric tools like Portainer ease day-to-day ops, while community-backed templates supply ready-made CI/CD pipelines. Hardware density savings matter more for smaller budgets; hence, container packing efficiencies deliver an immediate financial incentive. As managed services bake compliance presets into starter clusters, auditors become more comfortable approving container rollouts at these firms. The SME surge broadens the revenue base, decreasing the risk that growth depends solely on a handful of very large buyers.
By Industry Vertical: Healthcare Surges on Imaging and Regulatory Compliance
IT and telecom led with 38.91% of 2025 deployments, driven by virtualized network functions, streaming services, and rapid software release cycles. Healthcare workloads are projected to grow at a 24.27% CAGR as hospitals migrate medical-imaging inference engines and electronic health record modules into containerized solutions that meet HIPAA encryption and FDA software validation requirements. That trajectory is driving the application container market size in healthcare faster than in any other vertical. Radiology vendors report rollout times shrinking from months to weeks when algorithms ship as OCI-compliant images, enabling faster clinical adoption.
Retail and e-commerce platforms lean on auto-scaling microservices to handle flash-sale peaks, while banks containerize real-time payment engines to cut latency and improve failover. Manufacturing plants embed miniature clusters on production lines so predictive-maintenance models can run without round-tripping to the cloud. Public-sector agencies modernize citizen portals on containers, though procurement cycles remain lengthy. The diverse pattern of adoption cushions the market against shocks in any one industry and highlights that performance benefits and regulatory clarity now converge to make containers a cross-sector standard.

By Container Use-Case Area: Security Tooling Expands Amid Zero-Trust Mandates
Management and orchestration tools commanded 31.82% of 2025 spending because clusters cannot exist without lifecycle management, upgrades, and tenancy controls. Security tooling is forecast to rise at 24.29% through 2031 as zero-trust frameworks and SBOM mandates elevate runtime protection, vulnerability scanning, and dependency attestation to must-have status. That growth lifts the application container market share for security at a faster clip than any other use-case segment. The pending federal requirement that every contractor submit verified SBOMs pushes buyers toward platforms that automate manifest generation and drift detection.
Telemetry volumes triple once observability stacks collect metrics, traces, and logs from hundreds of ephemeral pods, so demand for cost-efficient monitoring keeps pace. Service meshes improve traffic encryption and policy enforcement, yet their complexity concentrates adoption in organizations with mature SRE teams. Networking plugins evolve to support multi-cluster east-west routing, smoothing hybrid expansion plans. Storage operators are maturing, but stateful workloads still lag behind stateless microservices, leaving room for innovation. Overall, the security and monitoring surge illustrates that once enterprises containerize workloads, the next budget wave flows to the tools that keep those workloads safe, visible, and compliant.
Geography Analysis
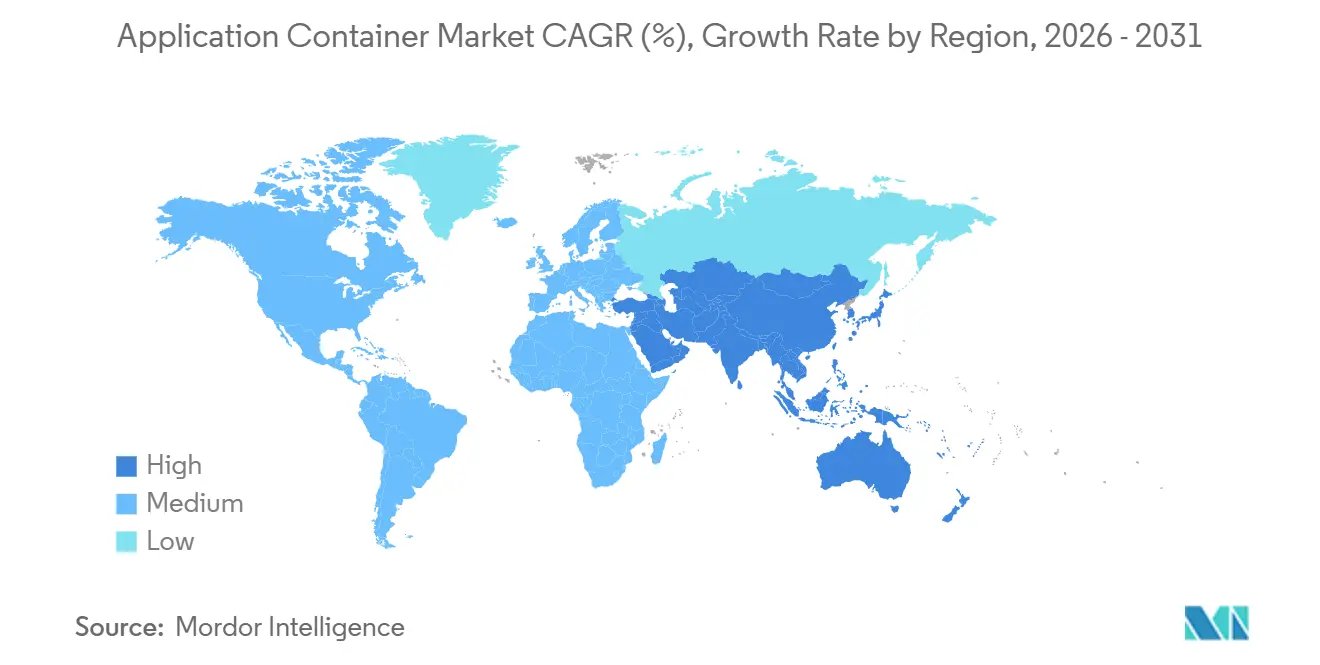
North America retained 41.22% of the 2025 container application market share, benefiting from early Kubernetes adoption across financial services, federal agencies, and digital-native technology firms. Regional hyperscalers iterate rapidly on managed control planes, shortening time-to-value and reinforcing customer stickiness. CISA, NIST, and the Federal Risk and Authorization Management Program have published prescriptive guidance on container hardening, giving risk officers the confidence to approve cloud-native rollouts. Accelerated purchasing has also been fueled by the availability of local sovereign cloud regions that satisfy state-level data residency laws. Despite this lead, cost pressures tied to CPU-based licensing models from legacy middleware suppliers temper node densification and motivate some enterprises to migrate to open-source alternatives.
Asia-Pacific is projected to generate the fastest regional growth at a 24.07% CAGR through 2031, lifting the region’s application container market size far more quickly than any other geography. China’s Data Security Law and “Eastern-Data, Western-Compute” program are driving dual-cluster architectures that keep sensitive data behind the Great Firewall while offloading analytics to inland megacenters. India’s digital public infrastructure, particularly the Unified Payments Interface, which processed 13.4 billion transactions in December 2025, relies on containerized microservices to achieve sub-second settlement targets. Japan’s manufacturers embed managed Kubernetes on smart-factory gateways, while Australia’s banks adopt multi-cloud for disaster-recovery separation. Talent shortages persist, yet government-funded reskilling programs and vendor-hosted training academies are narrowing the skills gap.
Europe’s trajectory is shaped by the General Data Protection Regulation and the 2024 Data Act, both of which amplify demand for hybrid architectures that keep personal data inside EU borders. Germany’s BaFin now requires banks to demonstrate containerized workload resilience through live failover drills, accelerating platform investments. France and the Nordics promote sovereign open-source stacks to limit dependence on U.S. hyperscalers, while the United Kingdom courts fintechs with simplified regulatory sandboxes. South America and the Middle East, and Africa remain nascent but vibrant; Brazil’s instant-payments network and the United Arab Emirates’ smart-city projects both rely on lightweight runtimes deployable on resource-constrained edge nodes. Limited local cloud regions and high data-egress fees slow adoption, yet rising 5G penetration and green-field digital initiatives point to steady long-term upside.

Regulatory Landscape
Container adoption is increasingly shaped by cybersecurity and software supply-chain rules that translate into build-time and runtime controls for images, registries, and orchestrators. In the European Union, Regulation (EU) 2024/2847 (Cyber Resilience Act, enacted in 2024) sets horizontal cybersecurity requirements for products with digital elements, pushing containerized software distributed in the EU toward stronger secure-by-design practices, vulnerability handling, and traceability expectations.
In the United States, federal and defense-sector guidance continues to tighten operational baselines for container environments. The US Department of the Navy issued a department-wide Containerization Technology Usage memo in July 2025 that mandates security and configuration standards for containerized software deployment, moving security expectations from optional best practices to prescriptive internal requirements for mission-critical settings. NIST SP 800-190 also remains a widely referenced hardening anchor for container images, registries, and orchestration layers, which influences procurement requirements for scanning, configuration management, and incident response capabilities.
Value Chain Analysis
The application container value chain runs from upstream open-source projects and standards (OCI image format, Kubernetes, etcd) and developer tools (source control, CI/CD, artifact signing) into build systems that produce images and manifests. Downstream, it extends to registries, policy engines, orchestration platforms, and managed services that run and govern workloads across public cloud and hybrid estates. Hyperscalers and platform vendors package Kubernetes control planes with identity, networking, and observability, while independent software vendors and security specialists add differentiated layers such as runtime defense, SBOM generation, and compliance reporting.
Security and verification are becoming central insertions in the value chain, with hardened, minimal images and enforceable vulnerability SLAs shifting from do-it-yourself engineering to more productized offerings and partner ecosystems. Chainguard launched its Commercial Builds program in March 2026 for hardened images with defined CVE commitments, and Percona partnered with Chainguard in April 2026 to deliver hardened container images for its open-source database portfolio. Platform-to-platform integration is also reshaping delivery and support paths, including Red Hat and Google Cloud expanding collaboration in March 2026 to deepen OpenShift integration with Google Cloud operations, and Red Hat and Oracle expanding collaboration in April 2026 to validate Oracle Database workloads on OpenShift Virtualization, reflecting tighter convergence between VM modernization and container platforms.
Competitive Landscape
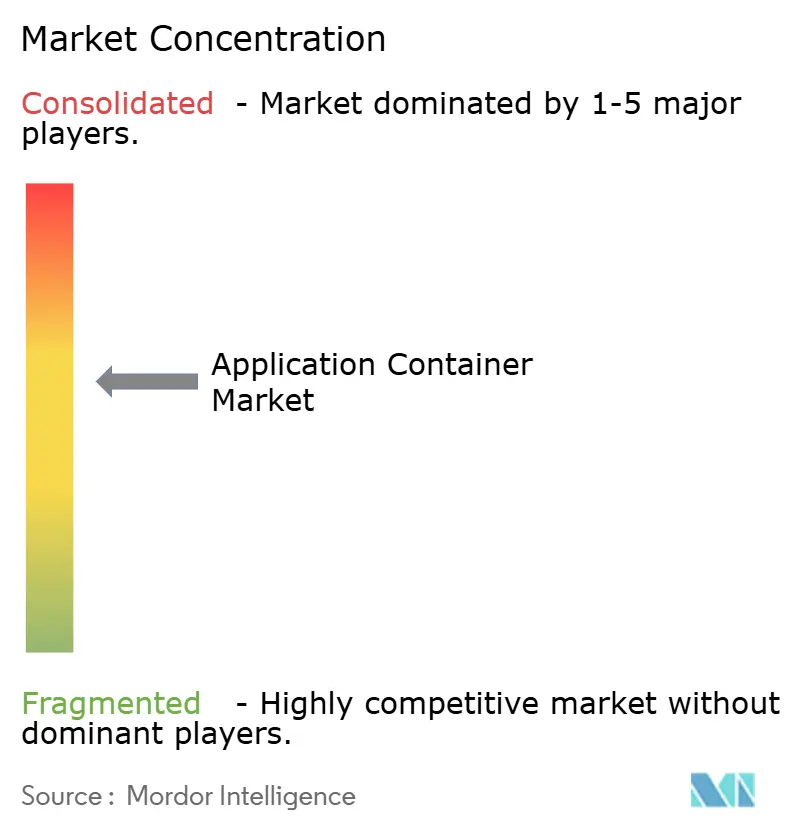
The competitive field is moderately concentrated, with the three hyperscalers Amazon Web Services, Google Cloud, and Microsoft Azure leveraging bundled networking, identity, and monitoring to cement workload lock-in. AWS Elastic Kubernetes Service alone accounted for an estimated 35% of managed cluster deployments in 2025, underscoring the brand’s gravitational pull among organizations already invested in the AWS console. Each cloud vendor now offers “auto” modes that hide control-plane components, expanding addressable demand among small and medium enterprises and reducing time spent on undifferentiated engineering toil.
Independent vendors differentiate on multi-cloud portability, long-term support, and vertical compliance certifications. Red Hat OpenShift occupies a defensible niche in finance and healthcare by pairing a hardened Kubernetes distribution with extensive partner validations and 24×7 escalation paths. VMware Tanzu remains relevant where vSphere tooling is entrenched, though pricing adjustments following the Broadcom acquisition introduced churn risk. SUSE, Rancher, and Canonical target edge and retail deployments with lightweight footprints, while IBM Global Services monetizes advisory and managed-operations contracts that bridge mainframe estates to Kubernetes clusters. Container security specialists such as Palo Alto Networks and Aqua Security post higher growth by bundling runtime defense, vulnerability scans, and SBOM automation into unified policy engines.
A new wave of disruptors focuses on performance and compliance gaps that incumbents have not addressed. WebAssembly runtime vendors such as wasmCloud and Fermyon tout sub-millisecond cold-start latency ideal for edge inference, whereas eBPF-centric observability tools from Cilium and Isovalent capture kernel-level telemetry without the overhead of sidecar proxies. Confidential-computing extensions from Intel and AMD integrate directly into container runtimes, enabling encrypted memory spaces that satisfy zero-trust mandates in government and financial services. Open-source commoditization keeps core orchestration margins thin, so revenue growth hinges on value-added automation, ecosystem depth, and regulatory trust. Ongoing consolidation, exemplified by HashiCorp’s acquisition of Spacelift, signals that winners will increasingly couple platform breadth with opinionated, compliance-ready operating models to defend and expand their application container market share.
Application Container Industry Leaders
Amazon Web Services, Inc.
Google LLC
Microsoft Corporation
Oracle Corporation
IBM Corporation
- *Disclaimer: Major Players sorted in no particular order

Market Opportunities and Future Outlook
A major whitespace is emerging around secure execution for AI agents and autonomous workloads inside container environments, where isolation, identity, and provenance controls need to extend beyond standard pod boundaries. Google Cloud made GKE Agent Sandbox generally available in May 2026 and introduced the Agent Substrate project, while Kubernetes community work on agent-sandbox APIs points to demand for warm-pool, isolated runtimes for singleton or stateful agents. As a result, buyers are directing spending toward sandboxed containers, MicroVM-based isolation, and policy automation that can constrain tool-using agents, not only conventional microservices.
Software supply-chain transparency and continuous risk reduction are also shifting toward procurement-level requirements rather than optional add-ons, creating room for platforms that can operationalize SBOMs, signed attestations, and continuous patching across fleets of images. Google Cloud released the k8s-aibom controller in July 2026 to map shadow AI workloads in production clusters and generate CycloneDX ML-BOMs, which aligns container governance with AI artifact tracking. At the control-plane layer, core-project improvements such as Kubernetes v1.36 (May 2026) and etcd v3.7.0 (July 2026) support higher-density scheduling and large-scale state operations, reinforcing a move from stateless-only clusters toward broader stateful and AI/ML production usage reported in industry surveys, and increasing demand for managed operations, observability, and compliance-ready platform bundles.
Recent Industry Developments
- June 2026: Caylent signed a multi-year strategic collaboration agreement with Amazon Web Services (AWS) to accelerate work in agentic AI and next-generation managed services. The agreement reinforces AWS-native container and platform services as a delivery backbone for partners building AI-enabled modernization programs and managed operations.
- February 2026: OpenAI and Amazon announced a multi-year strategic partnership that includes co-creating a Stateful Runtime Environment on Amazon Bedrock and a commitment tied to Trainium capacity. The announcement ties AI infrastructure commitments and managed runtime capabilities to support large-scale, containerized inference and application deployment patterns.
- December 2024: Intersect Power formed a strategic partnership with Google and TPG Rise Climate to co-locate data center load with clean power generation. Power-and-capacity alignment like this supports hyperscaler expansion needed for compute-intensive, containerized workloads, including AI training and inference that drives higher utilization of managed Kubernetes and adjacent services.


Research Methodology Framework and Report Scope
Market Definition and Coverage
The application container market is defined as the revenue generated from software platforms and related services that package, run, and manage applications in containers across cloud and on-premises environments. This includes orchestration, security, monitoring, networking, and storage features.
Scope exclusions: We exclude general-purpose infrastructure like servers and networking hardware, and unrelated application development tools that are not primarily used for containerized workloads.
Segmentation Overview
- By Component
- Platform
- Services
- By Deployment Model
- Public Cloud
- Private Cloud
- Hybrid and Multi-Cloud
- By Organization Size
- Large Enterprises
- Small and Medium Enterprises
- By Industry Vertical
- IT and Telecom
- BFSI
- Healthcare
- Retail and e-Commerce
- Manufacturing
- Government and Public Sector
- By Container Use-Case Area
- Management and Orchestration
- Monitoring
- DevOps Tool-chain
- Security
- Networking
- Storage
- By Geography
- North America
- United States
- Canada
- Mexico
- South America
- Brazil
- Argentina
- Rest of South America
- Europe
- United Kingdom
- Germany
- France
- Italy
- Rest of Europe
- Asia Pacific
- China
- Japan
- India
- South Korea
- Rest of Asia Pacific
- Middle East and Africa
- Middle East
- United Arab Emirates
- Saudi Arabia
- Rest of Middle East
- Africa
- South Africa
- Egypt
- Rest of Africa
- Middle East
- North America
Data Sources, Market Sizing, and Validation
Desk Research
Desk work started with public signals that track container adoption and cloud-native activity over time, then it was narrowed into revenue-relevant inputs. We referenced sources such as the Cloud Native Computing Foundation surveys, NIST guidance on containers and software supply chain security, and US SEC filings plus annual reports where companies discuss cloud and subscription revenues.
To round out the view, we also used sources such as US Bureau of Labor Statistics data for technology spending indicators, World Bank and OECD digital economy indicators, and peer-reviewed papers indexed on platforms such as PubMed and IEEE Xplore that discuss containerization trends and operational practices. Industry association websites and reputable press coverage were reviewed to confirm timelines for major feature releases that can affect pricing and attach rates (for example, security and observability being bundled into platform plans). Where needed, paid subscriptions for company financials and intelligence, news and financials, and patent databases were used to cross-check dates and product direction. These examples are not exhaustive, and many other public sources were reviewed to collect data points, validate assumptions, and clarify open questions.
Primary Interviews and Surveys
Primary discussions were used to convert adoption behavior into usable sizing ratios, especially where published data does not separate container platforms from adjacent cloud spend. We spoke with a mix of platform providers, managed service partners, and enterprise buyers across APAC, EMEA, and the Americas to sanity check pricing ranges, bundling practices, and the pace of migration from virtual machines to containerized workloads.
Distribution of primary research fieldwork respondents
| Company type | Respondent position | Region |
|---|---|---|
| Top tier: 29% | CXOs: 12% | APAC: 52% |
| Mid tier: 53% | Functional/Unit leaders: 30% | EMEA: 30% |
| Smaller Players: 18% | Managers: 58% | Americas: 18% |
Market-Sizing & Forecasting
Sizing was built using a top-down approach where cloud and software spend indicators are reconstructed into a container demand pool, then filtered by adoption rates and paid usage intensity for container platforms and related services. The model was pressure-tested with selective bottom-up checks, such as sampled price per node or per cluster, channel feedback on typical contract sizes, and roll-ups of a limited set of supplier revenues where disclosure allows it.
Key inputs included the share of workloads deployed on Kubernetes or other orchestrators, the mix of self-managed versus managed container environments, average platform and support subscription pricing, attach rates for security and monitoring modules, and the pace of container adoption in regulated verticals that move slower due to compliance steps. Because pricing structures differ (per core, per node, per cluster, or per user), normalization rules were applied so volumes and average selling prices stay comparable across deployment models. Where gaps remained, we used conservative proxy ratios that were confirmed in interviews. For forecasting, we used scenario analysis, since adoption can accelerate or pause based on cloud cost optimization cycles and security incidents, and assumptions were tuned using consensus ranges from experts.
Data Validation & Update Cycle
Outputs were checked against independent signals such as cloud-native survey adoption, reported software subscription trends, and shifts in managed service usage patterns. Variance was then investigated before finalizing. When a key input moved sharply (for example, bundled pricing changes or a major platform licensing update), the related assumptions were revisited and selected experts were re-contacted to confirm direction and likely magnitude.
We followed a multi-step review to keep calculations, units, and currency conversions consistent across regions and years. The report is refreshed annually, and interim updates are made when material events meaningfully change demand or pricing. Before delivery, we run a final pass to ensure the latest public information is reflected in the numbers.
Mordor Intelligence's Application Container Market Sizing Compared With Other Published Estimates
Published market sizes for application containers can vary because firms do not always count the same revenue streams, and they also differ on the year chosen, currency timing, and what they treat as platform versus adjacent tooling. Differences in how managed services are handled, and whether security and observability add-ons are counted inside the core market, often create visible spreads.
The main gaps usually come from scope choices and pricing logic. Some estimates fold in broader cloud-native services or apply aggressive price expansion to bundled platform plans. Another driver is refresh cadence. Older assumptions on on-premise versus hosted mix can stay in the model even after enterprise buying patterns shift, and that mix is kept current through repeated checks on managed service penetration and module attach rates, which are validated and refreshed in the workflow used by Mordor Intelligence.
Benchmark comparison
| Source | Market Size | Gaps in Research Methodology |
|---|---|---|
| Mordor Intelligence | USD 10.27 B (2025) | |
| Global Consultancy A | USD 7.44 B (2025) | This figure appears to anchor sizing more tightly to a defined service taxonomy and deployment split, and it can undercount platform-adjacent revenues when security and monitoring are treated as separate tool categories outside the application container spend. |
| Industry Research Outlet B | USD 14.00 B (2025) | This estimate likely includes a wider cloud-native tooling perimeter, and it may roll managed orchestration service fees and registry revenues into the same bucket, which can push totals higher even when the core platform subscription base is similar. |
Across the three figures, the spread is largely explained by what gets counted as in-scope container platform revenue versus adjacent tooling, plus how managed service fees are treated. By keeping variables tied to adoption intensity, deployment mix, and normalized price logic, the final number can be traced back to clear inputs and repeated each year with the same steps.


Key Questions Answered in the Report
How fast is the application container market projected to grow through 2031?
The market value is forecast to rise from USD 12.64 billion in 2026 to USD 35.63 billion by 2031 at a 23.03% CAGR.
Which deployment model will grow the quickest in the next five years?
Hybrid and multi-cloud configurations are expected to post a 23.67% CAGR as data-sovereignty rules tighten.
Why is healthcare buying more container platforms?
Imaging workloads, electronic health records, and FDA validation pressures are driving a 24.27% CAGR for healthcare usage.
What is the primary security hurdle facing container adopters?
Misconfigurations and unpatched images remain the main cause of incidents, accounting for 67% of reported breaches in 2025.
How are small and medium enterprises overcoming Kubernetes complexity?
Managed options such as EKS Auto Mode and GKE Autopilot abstract cluster management, enabling SMEs to adopt containers without specialized DevOps teams.
Which vendors are innovating at the edge of the application container market?
WebAssembly runtime providers like wasmCloud and security specialists leveraging eBPF, such as Isovalent, offer lightweight alternatives for edge workloads.
Page last updated on:


 Your data is secure and never sold or shared.


