
Maritime Information Market Size and Share
Market Overview
| Study Period | 2020 - 2031 |
|---|---|
| Market Size (2026) | USD 3.19 Billion |
| Market Size (2031) | USD 4.52 Billion |
| Growth Rate (2026 - 2031) | 7.18 % |
| Fastest Growing Market | Asia Pacific |
| Largest Market | Europe |
| Market Concentration | Medium |
Major Players *Disclaimer: Major Players sorted in no particular order Image © Mordor Intelligence. Reuse requires attribution under CC BY 4.0. | |
Maritime Information Market Analysis by Mordor Intelligence
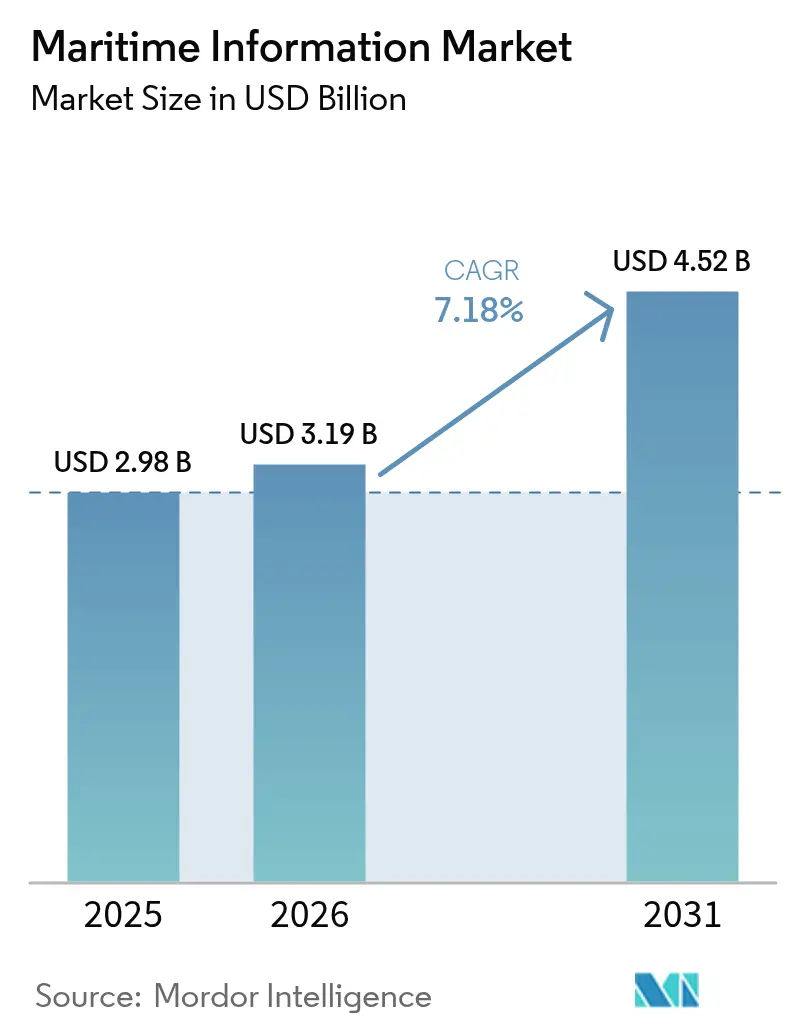
maritime information market size in 2026 is estimated at USD 3.19 billion, growing from 2025 value of USD 2.98 billion with 2031 projections showing USD 4.52 billion, growing at 7.18% CAGR over 2026-2031. This expansion underscores how fast-tracking regulatory mandates, falling costs for satellite data capture, and ubiquitous cloud connectivity are reshaping the maritime information market. Widespread digitization of port operations, rising climate-related compliance obligations, and continuous advances in artificial intelligence have created a fertile environment for fleet owners, insurers, and governments to embed data-driven decision making into day-to-day operations. Competitive intensity is building as traditional defense contractors and specialist analytics vendors race to integrate low-latency vessel tracking, predictive maintenance, and carbon reporting features on unified cloud platforms. The maritime information market is also drawing new entrants from the small-satellite ecosystem whose constellations deliver multi-source, near-real-time insights at falling price points.
Key Report Takeaways
- By application, Automatic Identification Systems led with a 37.54% maritime information market share in 2025, while Maritime Weather Analytics posted the fastest 7.52% CAGR through 2031.
- By end-user, Government and Defence held 44.55% of 2025 revenue, yet Insurance and Risk Managers are advancing at an 7.93% CAGR to 2031.
- By deployment, Cloud deployments captured 62.11% of 2025 spending and will extend leadership with a 7.36% CAGR to 2031.
- By geography, Europe accounted for 28.61% of 2025 revenue; Asia Pacific is projected to expand at an 7.86% CAGR through 2031.
Note: Market size and forecast figures in this report are generated using Mordor Intelligence’s proprietary estimation framework, updated with the latest available data and insights as of 2026.
Market Trends and Insights
Drivers Impact Analysis of Maritime Information Market*
| Driver | (~) % Impact on CAGR Forecast | Geographic Relevance | Impact Timeline |
|---|---|---|---|
| Rising maritime domain awareness mandates | +1.2% | Global, led by North America and Europe | Medium term (2-4 years) |
| Growing digitization of port logistics | +1.1% | Global, concentrated in major port hubs | Short term (≤ 2 years) |
| Declining cost of small-satellite AIS payloads | +0.9% | Global | Short term (≤ 2 years) |
| Mainstream adoption of cloud-based analytics | +1.0% | Global, led by developed markets | Medium term (2-4 years) |
| Climate-risk scoring demanded by insurers | +0.8% | Europe and North America | Medium term (2-4 years) |
| CO₂-based voyage taxation regulations | +1.3% | Europe now, global reach by 2026 | Long term (≥ 4 years) |
| Source: Mordor Intelligence | |||
Rising Maritime Domain Awareness Mandates
Governments are broadening investment in multi-layer surveillance to protect strategic waterways, catalyzing fresh spending across the maritime information market.[1]U.S. Maritime Administration, “Maritime Domain Awareness,” maritime.dot.govThe U.S. Maritime Administration’s focus on resilient navigation is mirrored in NATO’s coordinated monitoring programs that stitch together AIS, radar, and optical feeds. The International Maritime Organization requires cyber-risk controls for all flagged vessels, raising baseline technology standards fleet-wide. Together these mandates enlarge procurement budgets for solutions that blend machine learning with sensor fusion to identify dark vessels and detect spoofed signals. Suppliers able to deliver sovereign-hosted, artificial-intelligence-ready platforms are moving to the front of tender lists, reinforcing the maritime information market’s growth trajectory.
Growing Digitisation of Port Logistics
Smart-port initiatives in Singapore, Rotterdam, and Hamburg prove that integrated data platforms can shave 15% off turnaround times by synchronizing vessel arrival, crane deployment, and truck movements.[2]TBA Group, “Terminal Operating Systems,” tbagroup.com Terminal Operating Systems now extend beyond yard gates, connecting to shipboard AIS, customs filings, and real-time weather feeds. COVID-19 disruptions highlighted the vulnerability of paper-based workstreams, compelling port authorities to adopt cloud dashboards to coordinate remotely. The ensuing efficiency gains and carbon-reduction benefits create a strong return on investment, encouraging even second-tier ports to join the digital wave. As a result, demand for unified maritime information solutions stretches well beyond major transshipment hubs, embedding growth for the maritime information market.
Mainstream Adoption of Cloud-Based Maritime Analytics
More than 70% of 2024 maritime software contracts specified Software-as-a-Service delivery, underlining the maritime information market’s pivot to cloud.[3]TAINA Technology, “On-Premise Deployments or SaaS-Trends and How to Choose,” taina.tech Fleet operators prefer cloud because automatic updates eliminate dry-dock software installs, while elastic compute allows high-resolution weather routing that was once cost-prohibitive. Hyperscale providers bundle AI toolkits, enabling developers to roll out predictive hull-fouling or fuel-optimization algorithms in weeks instead of months. Cloud also underpins remote operations, a critical capability during pandemic travel restrictions. Given the 62.78% revenue share already achieved in 2024, cloud platforms remain the core engine propelling the maritime information market.
CO₂-Based Voyage Taxation Regulations
The EU Emissions Trading System added shipping in 2024, and the International Maritime Organization will enforce universal carbon-intensity criteria from 2026. Vessel operators now need granular emissions data to avoid penalty costs, prompting them to fit sensors that stream fuel, engine torque, and AIS position data into auditable dashboards. Vendors with emissions modules are expanding subscription tiers, while insurers bundle carbon-footprint scores into premium models. These rules lock in long-term data requirements, ensuring sustained expansion of the maritime information market as operators scramble for compliant, real-time reporting tools.
Restraints Impact Analysis of Maritime Information Market*
| Restraint | (~) % Impact on CAGR Forecast | Geographic Relevance | Impact Timeline |
|---|---|---|---|
| High integration cost of legacy fleet IT | -0.7% | Global, acute for older fleets | Medium term (2-4 years) |
| Data latency for congested sea lanes | -0.4% | High-traffic corridors | Short term (≤ 2 years) |
| GNSS jamming and spoofing incidents | -0.6% | Regional hotspots, expanding globally | Short term (≤ 2 years) |
| Shortage of maritime cyber-talent | -0.5% | Global, severe in developing markets | Long term (≥ 4 years) |
| Source: Mordor Intelligence | |||
High Integration Cost of Legacy Fleet IT
Older tonnage carries disparate bridge consoles, analog engine monitors, and first-generation VSAT terminals. Converting these vessels so they can stream structured telemetry into cloud dashboards can cost more than USD 100,000 per hull and usually has to occur during narrow dry-dock windows, causing scheduling bottlenecks. Smaller owners often lack technical staff and rely heavily on outside integrators, stretching payback periods. The heterogeneous mix of vendor protocols further complicates upgrades and discourages smaller fleets from immediate digitization, tempering near-term expansion of the maritime information market.
GNSS Jamming and Spoofing Incidents
The International Association of Marine Aids to Navigation and Lighthouse Authorities logged a sharp rise in spoofing events across conflict-prone regions in 2024.[5]International Association of Marine Aids to Navigation and Lighthouse Authorities, “GNSS Vulnerabilities and Maritime Navigation,” iala-aism.org False position feeds disrupt AIS integrity and undermine the trust insurers and regulators place in real-time tracking. Operators have begun fitting inertial backups and multi-constellation receivers, but such hardware raises capital outlay and does not fully neutralize sophisticated attacks. Persisting uncertainty about signal quality makes some smaller carriers reluctant to invest in fully automated routing tools, exerting a measurable brake on maritime information market uptake.
*Our forecasts treat driver/restraint impacts as directional, not additive. The impact forecasts reflect baseline growth, mix effects, and variable interactions.
Maritime Information Market Segment Analysis
By Application:
AIS Supremacy Meets Weather Analytics MomentumAutomatic Identification Systems retained a commanding 37.54% maritime information market share in 2025, underpinned by Safety of Life at Sea mandates and port-state enforcement. That slice equated to a USD 1.12 billion maritime information market size, covering vessel tracking, collision avoidance, and traffic management. AIS vendors now layer behavioral analytics that flag suspicious course changes or speed anomalies, adding intelligence value without swapping transponders.
Maritime Weather Analytics is accelerating with a 7.52% CAGR through 2031 as charterers and insurers quantify climate exposure using fine-grained sea-state, wind, and swell predictions. Operators trim bunkers by rerouting around adverse conditions, while underwriters feed loss-probability models with weather-adjusted transit data. Synthetic aperture radar services are gaining traction for dark-vessel detection in illegal fishing hotspots, complementing AIS feeds. Growing fusion of satellite imaging, port logbooks, and cargo manifests broadens functionality, ensuring that weather-driven intelligence will remain a core growth lever for the maritime information market.




By End-User:
Defence Strength Faces Insurance DynamismGovernment and Defence organizations accounted for 44.55% of 2025 revenue, translating to a USD 1.33 billion maritime information market size anchored by coastal surveillance and critical-infrastructure protection. Sovereign customers demand encrypted links, domestic data hosting, and dedicated sensor fusion centers that cross-reference radar, sonar, and AIS inputs.
Insurance and Risk Managers, though smaller, are expanding at an 7.93% CAGR to 2031. Platforms such as Breeze and Insurwave integrate AIS positions, machinery telemetry, and port congestion metrics to enable live premium adjustments. As predictive models mature, underwriters use condition-based scoring to pre-empt machinery failures, shifting focus from loss indemnification to loss prevention. Commercial Shipping Lines and Offshore Energy Operators also deepen digital spend to meet emissions requirements and to safeguard offshore assets, collectively reinforcing long-term breadth for the maritime information market.
By Deployment:
Cloud Ascendancy Now StructuralCloud-hosted offerings captured 62.11% of 2025 revenue, locking in first position within the maritime information market. That tally equates to a USD 1.85 billion maritime information market size and is projected to rise at a 7.36% CAGR as fleet operators migrate analytics workloads off shipboard servers. Cloud economies of scale slash total cost of ownership, and shared-service architectures accelerate continuous deployment of AI-driven route optimization, emissions dashboards, and regulatory updates.
On-premises deployments still appeal to navies and intelligence agencies that require air-gapped operation or strict data-sovereignty compliance, but their share of new contracts is shrinking. Hybrid designs-edge compute aboard ship feeding regional cloud hubs-are emerging as a compromise, but overall preference for pure SaaS is solidifying, keeping the maritime information market’s center of gravity firmly in the cloud.

Geography Analysis
Europe Maritime Information Market
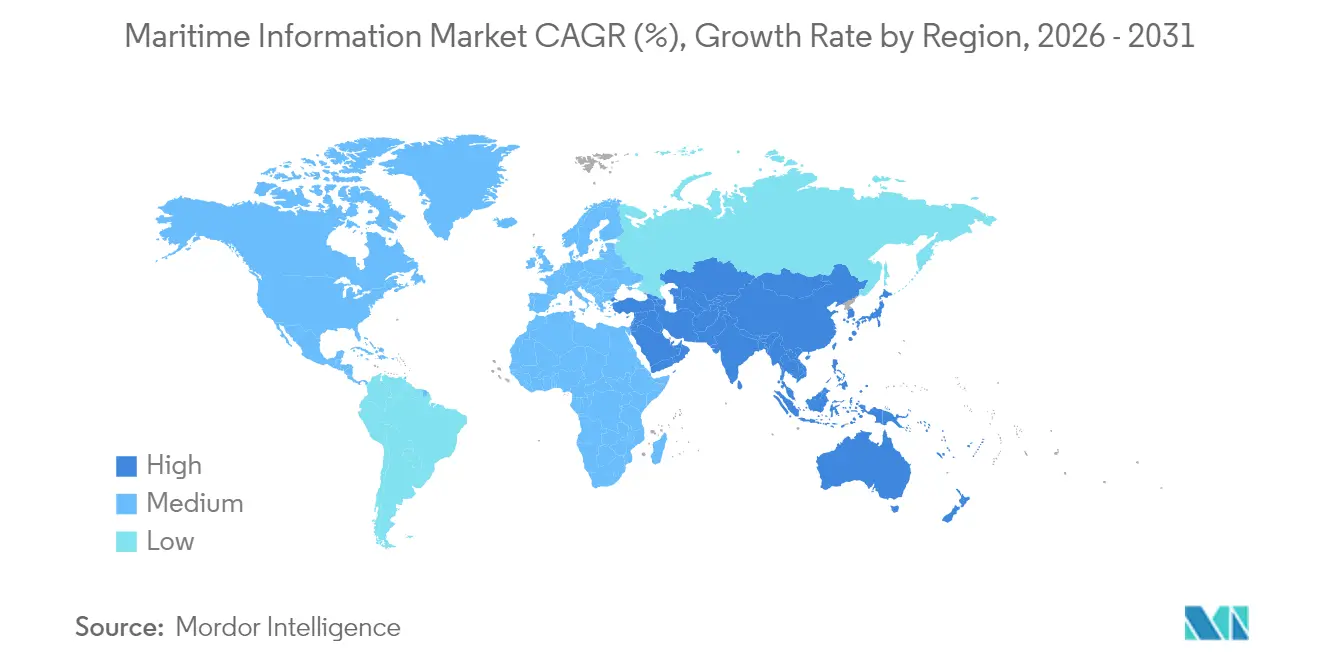
Europe generated 28.61% of 2025 revenue, equal to USD 853 million of maritime information market size, and maintains leadership thanks to stringent EU emissions rules and advanced port digitization. Rotterdam and Hamburg deploy integrated arrival management systems that shave idle time and cut emissions, while Nordic suppliers pioneer encrypted radar-AIS fusion for both civil and military users. Carbon reporting under the EU Emissions Trading System keeps data spending elevated, and port authorities leverage digital twins for berth and yard planning.
APAC Maritime Information Market
Asia Pacific is on course for an 7.86% CAGR through 2031, delivering the maritime information market’s strongest regional expansion. Port modernization programs in China, Singapore, and India anchor demand, and Belt and Road infrastructure extends surveillance networks across the Indian Ocean and the South Pacific. The region’s distant-water fishing fleets need persistent tracking to curb illegal, unreported, and unregulated catches, while Japan and South Korea invest in autonomous navigation software and edge-AI modules. These overlapping drivers secure Asia Pacific’s long-term status as the maritime information market’s most dynamic geography.
The Americas and MEA Maritime Information Market
North America benefits from heavy Coast Guard spending on cyber-resilient navigation aids and Arctic-route monitoring. U.S.-based defense contractors export integrated command-and-control suites that couple AIS, radar, and optical feeds, while Canadian authorities implement satellite AIS for polar coverage. Middle East and Africa along with South America offer smaller but rising opportunities tied to port expansions in the Gulf and Brazil’s offshore energy projects. Collectively, the geographic mosaic provides balanced growth pillars for the maritime information market.

Regulatory Landscape
Maritime information platforms are increasingly shaped by cybersecurity, emissions reporting, and autonomy frameworks that drive standardized data capture, retention, and auditability across ship-to-shore workflows. In the United States, the Coast Guard finalized its Cybersecurity in the Marine Transportation System rule with a 2025 effective date, requiring regulated entities to implement cybersecurity plans, designate responsible officers, and align incident reporting and training obligations (including a training milestone in January 2026). Alongside this, class and technical standards are tightening, including Korean Register guidance on cyber resilience (2025) and IACS cyber resilience requirements (UR E26/UR E27) applying to newbuild contracts from January 2026, which raises baseline requirements for onboard systems that feed maritime data services.
On autonomy and digitized port formalities, the International Maritime Organization published the first International Code of Safety for Maritime Autonomous Surface Ships (MASS Code) as a non-mandatory instrument effective 1 July 2026, setting a global reference point for safety management, remote operations, and information assurance in autonomous and remotely operated vessels. The European Commission also launched industrial strategies for the waterborne sector in March 2026 that emphasize digital transition and security of maritime and port infrastructure, reinforcing demand for trusted cloud and sovereign hosting options for sensitive users, and for interoperable data exchange across ports and fleets.
Value Chain Analysis
The maritime information value chain begins with data generation and capture, including shipboard transponders (AIS), GNSS receivers, engine and fuel sensors, bridge systems, port call and terminal events, plus satellite and terrestrial connectivity that backhauls telemetry to shore. Data aggregation then occurs via satellite operators, connectivity service providers, and specialized maritime data firms that normalize multi-source feeds before analytics vendors apply AI models for vessel identity and tracking, weather routing, risk scoring, emissions reporting, and port and terminal intelligence. Distribution increasingly runs through cloud marketplaces and SaaS delivery to end users such as government and defence, shipping lines, offshore operators, and insurance and risk managers, with systems integrators and managed service providers bridging legacy onboard IT into modern APIs.
Interoperability and standards bodies act as a midstream enabler, since fragmented schemas and inconsistent handoffs can increase latency and reconciliation costs in congested corridors and complex port communities. Standardization activity is visible in DNV joining the Digital Container Shipping Association (DCSA) partnership program in June 2026, linking DNV's Veracity platform to efforts that align data exchange across container shipping stakeholders. Upstream connectivity is also shifting toward multi-orbit architectures as fleets seek more real-time, compliance-grade data, including Hapag-Lloyd's July 2026 fleetwide agreement to deploy Inmarsat Maritime NexusWave to combine Ka-band, LEO, LTE, and L-band links, which supports the transport layer for cloud analytics, digital twins, and continuous reporting workflows.
Competitive Landscape
The maritime information market is moderately fragmented, with overlapping footprints across defense primes, specialized data providers, and satellite operators. Saab, Thales, and Northrop Grumman leverage decades-old radar and electronic-warfare expertise to serve national security clients demanding end-to-end surveillance and threat analysis. Pure-play analytics vendors such as Windward, exactEarth, and MarineTraffic focus on commercial shipping, port optimization, and insurance, differentiating through agile cloud architectures and proprietary machine-learning models.
S & P Global’s April 2025 purchase of ORBCOMM’s AIS division illustrates a vertical-integration strategy designed to control both raw data and the analytics layers that monetize it. Low-cost CubeSat operators like Spire Global democratize global tracking, putting price pressure on legacy satellite networks while opening doors for fresh applications such as dark-ship detection at scale. Cross-industry alliances pair data originators with AI specialists; Windward’s tie-up with Dataminr merges maritime feeds with geopolitical alerting, yielding richer risk intelligence.
Market players increasingly bundle cybersecurity, emissions analytics, and supply-chain risk modules into unified dashboards, positioning themselves as one-stop shops. As buyers favor platforms that combine sensor fusion, compliance reporting, and predictive decision support, smaller niche suppliers must either specialize deeply or join consortia. Consolidation is expected to intensify, yet the long tail of regional service providers and emergent satellite entrants ensures the maritime information market retains competitive tension.
Maritime Information Industry Leaders
Windward Limited
SAAB Group
Thales Group
ORBCOMM Inc.
Spire Global
- *Disclaimer: Major Players sorted in no particular order

Maritime Information Market Companies Covered in this Report
- Windward Ltd.
- Saab AB
- Thales SA
- ORBCOMM Inc.
- Spire Global Inc.
- Iridium Communications Inc.
- Inmarsat Group Holdings Ltd.
- Northrop Grumman Corp.
- BAE Systems plc
- L3Harris Technologies Inc.
- exactEarth Ltd.
- MarineTraffic Ltd.
- VesselFinder Ltd.
- FleetMon GmbH
- KVH Industries Inc.
- Satlink Ltd.
- Shipfix Technologies SAS
- Transas Marine Ltd.
- SRT Marine Systems plc
- Orbital Insight Inc.

Market Opportunities and Future Outlook
Compliance-driven digitalization is widening the addressable scope for standardized, secure maritime data services across ports, fleets, and national single-window systems. A specific catalyst is the IMO Facilitation Committee (FAL 50) approval in March 2026 of the IMO Strategy on Maritime Digitalization, alongside draft amendments progressing mandatory cybersecurity measures for Maritime Single Windows (submission for adoption at FAL 51 in 2027). This creates room for vendors to package interoperable data governance, identity and access controls, and audit-ready reporting into cloud platforms that connect port, customs, and vessel datasets without bespoke integration on every corridor.
Port and fleet operators are also showing purchase intent for AI-driven operational layers, creating near-term opportunities in terminal intelligence, predictive ETA, disruption monitoring, and automated document and compliance validation. In June 2026, Adani Ports activity at Vizhinjam included deployment of automated container cranes with ABB and an agreement with Kaleris to roll out an AI-augmented terminal operating system across 15 container terminals. In July 2026, Mitsui O.S.K. Lines went live with an AI-powered operations platform built with IBM Japan to centralize navigation, weather, and geopolitical data for its Safety Operation Supporting Centre. As data volumes rise and spoofing and cyber risks persist, platforms that fuse AIS with space-based monitoring, port event data, and secure connectivity (including multi-orbit satellite and private 5G environments) have a clear commercialization path through bundled risk, compliance, and efficiency modules sold to shipping lines, ports, and insurers.
Recent Industry Developments in Maritime Information Market
- July 2026: Thales signed a binding agreement to acquire a 35.51% stake in Exail Technologies from the Gorgé family and outlined plans for a tender offer to pursue full ownership. The move strengthens Thales position in maritime robotics, navigation, and undersea systems that feed higher-fidelity maritime awareness and sensor-driven data services.
- April 2026: Windward partnered with Vantor to integrate the space-based Sentry persistent monitoring system into the Windward Maritime AI platform, expanding coverage for detecting dark vessels and anomalous behavior. This integration underscores the markets shift toward multi-source intelligence stacks that combine satellite monitoring with AI analytics to improve reliability beyond AIS-only tracking.
- April 2025: S & P Global completed its acquisition of ORBCOMMs AIS business, expanding vessel-tracking coverage and tightening control over critical data inputs for analytics. Vertical integration at the data-layer increases competitive pressure on pure-play analytics vendors that rely on third-party tracking feeds for global scale.


Maritime Information Market Report Scope and Research Methodology
Market Definition and Coverage
This market covers revenue earned from platforms, software, and data services that collect, process, and deliver actionable maritime data for vessel tracking, safety, security, weather, and port or terminal decision support across commercial and public users.
Scope exclusions: We exclude marine hardware sales when they are sold as stand-alone equipment without a paid information service, and we also exclude generic telecom connectivity that does not provide maritime data or analytics.
Segments Covered in This Report
- By Application
- Automatic Identification Systems
- Synthetic Aperture Radar
- Vessel Identification and Tracking
- Satellite Imaging
- Maritime Weather Analytics
- Port and Terminal Intelligence
- By End-user
- Government and Defence
- Commercial Shipping Lines
- Offshore Energy Operators
- Insurance and Risk Managers
- By Deployment
- Cloud-based
- On-premises
- By Geography
- North America
- United States
- Canada
- Mexico
- South America
- Brazil
- Argentina
- Rest of South America
- Europe
- Germany
- France
- United Kingdom
- Italy
- Spain
- Russia
- Rest of Europe
- Asia Pacific
- China
- Japan
- South Korea
- India
- Australia
- Rest of Asia Pacific
- Middle East
- United Arab Emirates
- Saudi Arabia
- Turkey
- Rest of Middle East
- Africa
- South Africa
- Nigeria
- Egypt
- Rest of Africa
- North America
Data Sources, Market Sizing, and Validation
Desk Research
Desk research started with basic industry mapping so the model inputs were anchored to real maritime activity, not just vendor narratives. For example, we relied on public sources such as IMO publications, IALA materials related to AIS and e-navigation, national coast guard and maritime administration releases, and port authority statistics to understand traffic intensity and compliance drivers.
To translate activity into spend signals, we also reviewed UN Comtrade trade flows for relevant systems, regulator and safety incident databases where available, and peer reviewed journals on AIS, SAR, and maritime surveillance applications. Company filings, investor presentations, press coverage, and a paid subscription for company financials and patent databases helped us check product focus and direction of R&D. These sources are illustrative only, and many other public documents and datasets were also used for collection, validation, and clarification.
Primary Interviews and Surveys
Primary work focused on expert interviews and structured surveys with solution providers, data distributors, shipping and offshore operators, and public sector users that procure maritime information for surveillance and safety. For this global market, inputs were balanced across APAC, EMEA, and the Americas, so adoption timing, recurring subscription behavior, and application-level pricing assumptions could be confirmed without over-weighting one region.
Distribution of primary research fieldwork respondents
| Company type | Respondent position | Region |
|---|---|---|
| Top tier: 39% | CXOs: 19% | APAC: 47% |
| Mid tier: 42% | Functional/Unit leaders: 25% | EMEA: 35% |
| Smaller Players: 19% | Managers: 56% | Americas: 18% |
Market-Sizing & Forecasting
Sizing is built primarily using a top-down and bottom-up approach where maritime activity and compliance needs are translated into an addressable demand pool, and then filtered through adoption and spend intensity by application. In practice, we use indicators such as vessel traffic volumes, coverage needs for coastal and open-sea monitoring, uptake of AIS and satellite data feeds, port call trends, and the frequency of safety and security mandates that trigger procurement.
Those demand signals are then converted into value using a clear set of assumptions on subscription pricing, contract duration, and the mix between real-time information, historical datasets, and analytics. To keep the totals realistic, results are corroborated with selective bottom-up approximations such as sampled price points, channel checks with integrators, and a roll-up of revenue disclosures for a limited set of visible suppliers, with gaps handled through conservative ranges when disclosures are incomplete.
For forecasting, scenario analysis is used so that expected, conservative, and faster-adoption paths can be tested against variables like trade growth, offshore activity, satellite capacity availability, and public sector budget cycles. When the model is stressed using these drivers, the final forecast is then aligned to what industry experts describe as plausible adoption and renewal behavior over the next few years.
Data Validation & Update Cycle
Outputs are checked against independent signals, such as regional vessel movement trends, visible tender activity, and changes in public safety and surveillance programs, so outlier growth rates can be questioned early. If a region or application shows an unusual jump, we revisit the assumptions behind pricing, contract timing, and adoption, and we re-contact selected respondents when a specific gap remains.
Before sign-off, the model goes through a multi-step review where calculations are rechecked, year-over-year movements are compared to known market events, and currency conversions are validated using consistent timing. Reports are refreshed annually, and interim updates are made when material events occur, followed by a final pre-delivery pass so clients receive the latest updated view.
Mordor Intelligence's Maritime Information Market Sizing Compared With Other Published Estimates
Published market sizes for maritime information can look far apart because firms do not always count the same revenue streams, and they also choose different base years and forecasting windows. The differences usually come from how AIS, SAR, satellite imaging, weather analytics, and port intelligence are bundled, and whether the numbers represent recurring data services, one-time projects, or both.
Some external estimates appear to pull in wider maritime digital or hardware-led revenues, or they assume faster price expansion without checking renewal patterns. Some estimates fold in adjacent marine electronics and connectivity revenues, and then the total rises quickly. For Mordor Intelligence, only paid maritime information services and platforms are counted when the value is directly tied to data delivery and analytics (not stand-alone equipment).
Benchmark comparison
| Source | Market Size | Gaps in Research Methodology |
|---|---|---|
| Mordor Intelligence | USD 3.19 B (2026) | |
| Industry Publisher A | USD 2.30 B (2025) | Uses an earlier base year and a longer forecast window, and the scope reads closer to core vessel tracking and AIS related services, which can undercount port intelligence and wider analytics use cases. |
| Global Consultancy B | USD 3.60 B (2024) | Anchors on a broader 2024 base and applies a higher growth path that may include adjacent maritime digital spending and bundled solution revenue, which can inflate the information-only portion if service boundaries are not separated. |
The spread in the table is mainly explained by base-year choice and how strictly information services are separated from adjacent maritime technology spend. When the model is tied to observable activity signals and then validated through repeated checks on pricing and adoption, the output stays traceable to inputs that can be revisited and updated as market conditions change.


Key Questions Answered in the Report
What is the current value of the maritime information market in 2026?
The market stands at USD 3.19 billion in 2026, reflecting the sector's accelerating digitalization.
How fast is the sector expected to grow through 2031?
The maritime information market is forecast to post a 7.18% CAGR, reaching USD 4.52 billion by 2031.
Which region leads spending today?
Europe leads with 28.61% of 2025 revenue, anchored by strict emissions and port-digitization initiatives.
Which segment is expanding the quickest?
Maritime Weather Analytics is advancing at a 7.52% CAGR as insurers and operators incorporate climate-risk scoring.
Why are cloud deployments dominant?
Cloud offerings combine scalability, lower upfront costs, and integrated AI toolkits, capturing 62.11% of 2025 spending.
What is the chief restraint to wider adoption?
High retrofit costs for legacy fleet IT present a -0.7% drag on CAGR as older vessels need costly hardware upgrades.
Page last updated on:


 Your data is secure and never sold or shared.


