Container Monitoring Market Size and Share
Market Overview
| Study Period | 2020 - 2031 |
|---|---|
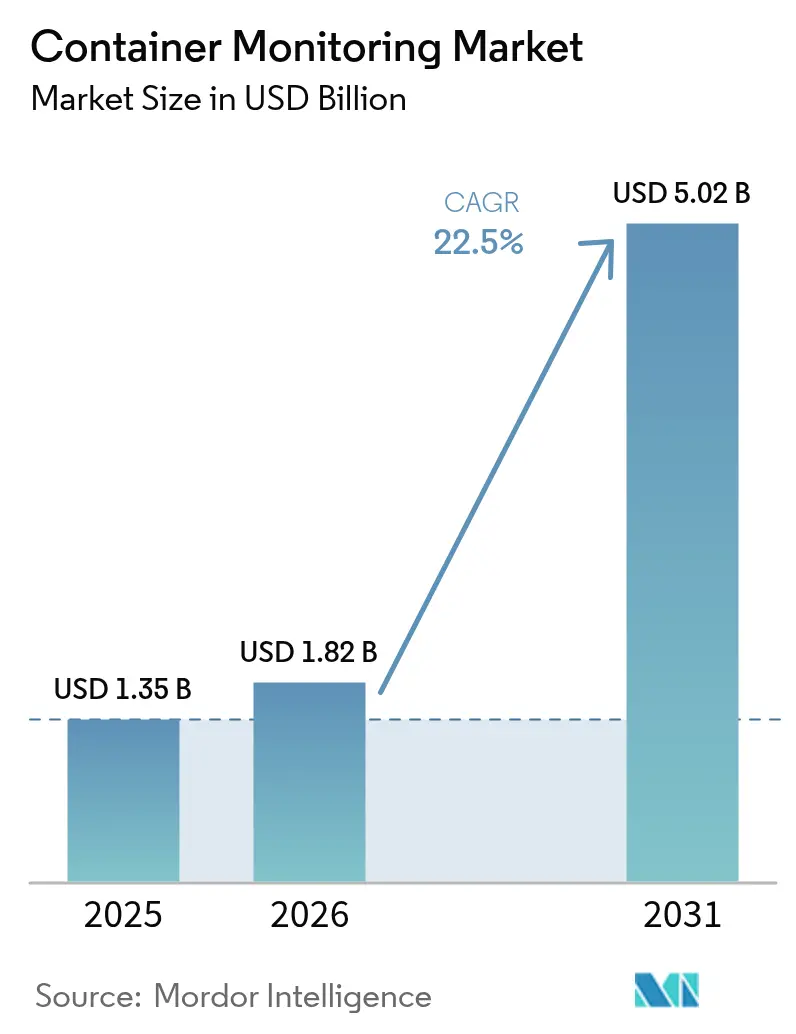
| Market Size (2026) | USD 1.82 Billion |
| Market Size (2031) | USD 5.02 Billion |
| Growth Rate (2026 - 2031) | 22.50% CAGR |
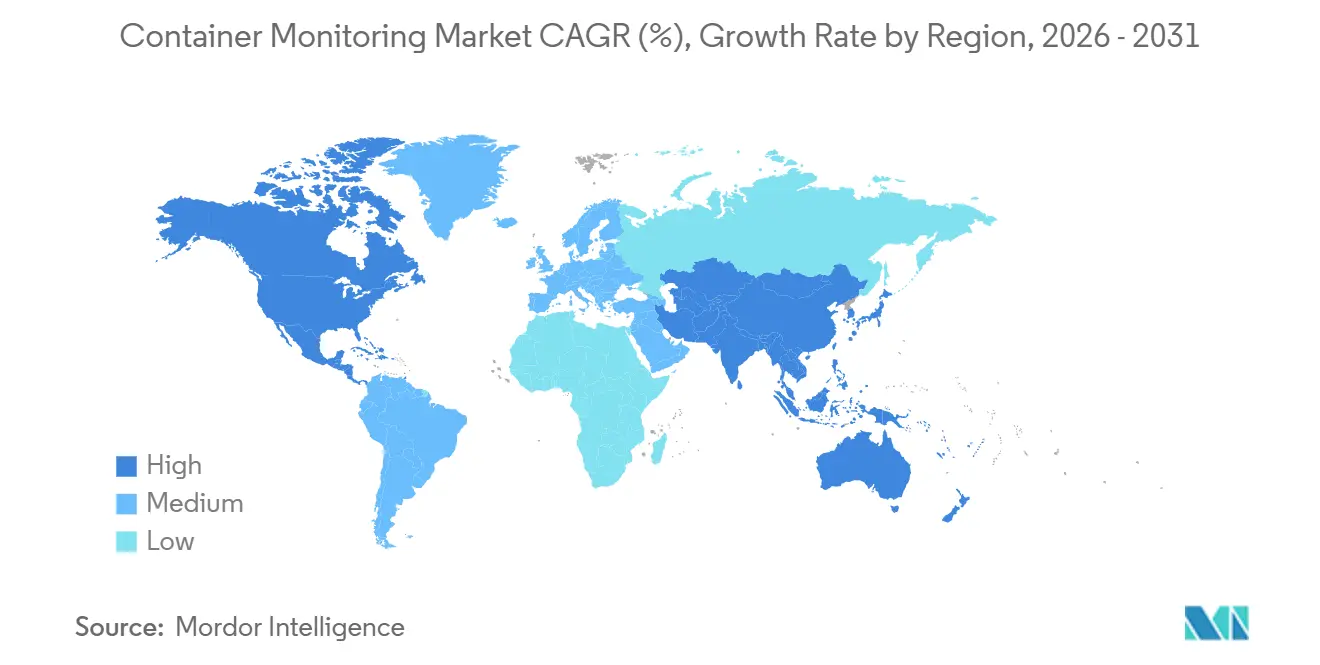
| Fastest Growing Market | Asia Pacific |
| Largest Market | North America |
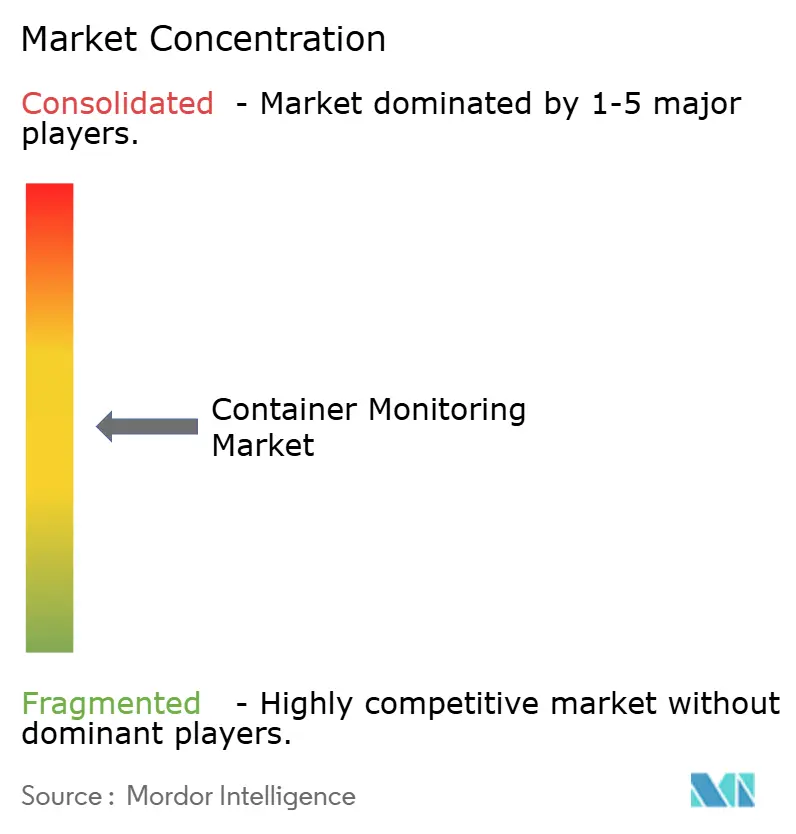
| Market Concentration | Medium |
Major Players *Disclaimer: Major Players sorted in no particular order Image © Mordor Intelligence. Reuse requires attribution under CC BY 4.0. | |
Container Monitoring Market Analysis by Mordor Intelligence
The container monitoring market size is projected to expand from USD 1.35 billion in 2025 and USD 1.82 billion in 2026 to USD 5.02 billion by 2031, registering a CAGR of 22.5% between 2026 and 2031. Rapid migration from virtual machines to containerized microservices is amplifying the volume, velocity, and variety of telemetry, creating urgent demand for platforms that correlate metrics, logs, and traces in near-real time. eBPF-powered instrumentation now captures kernel-level events with negligible CPU overhead, enabling sub-second latency visibility across short-lived pods while lowering data-ingest bills. FinOps teams increasingly tag cost metrics at the container layer, uncovering stranded resources and driving automated rightsizing. Compliance frameworks such as the Digital Operational Resilience Act and HIPAA have begun to require continuous workload monitoring, further accelerating tool adoption. Competition centers on AI-assisted root-cause analysis, open-standards telemetry pipelines, and pricing models that align vendor revenue to customer consumption.
Key Report Takeaways
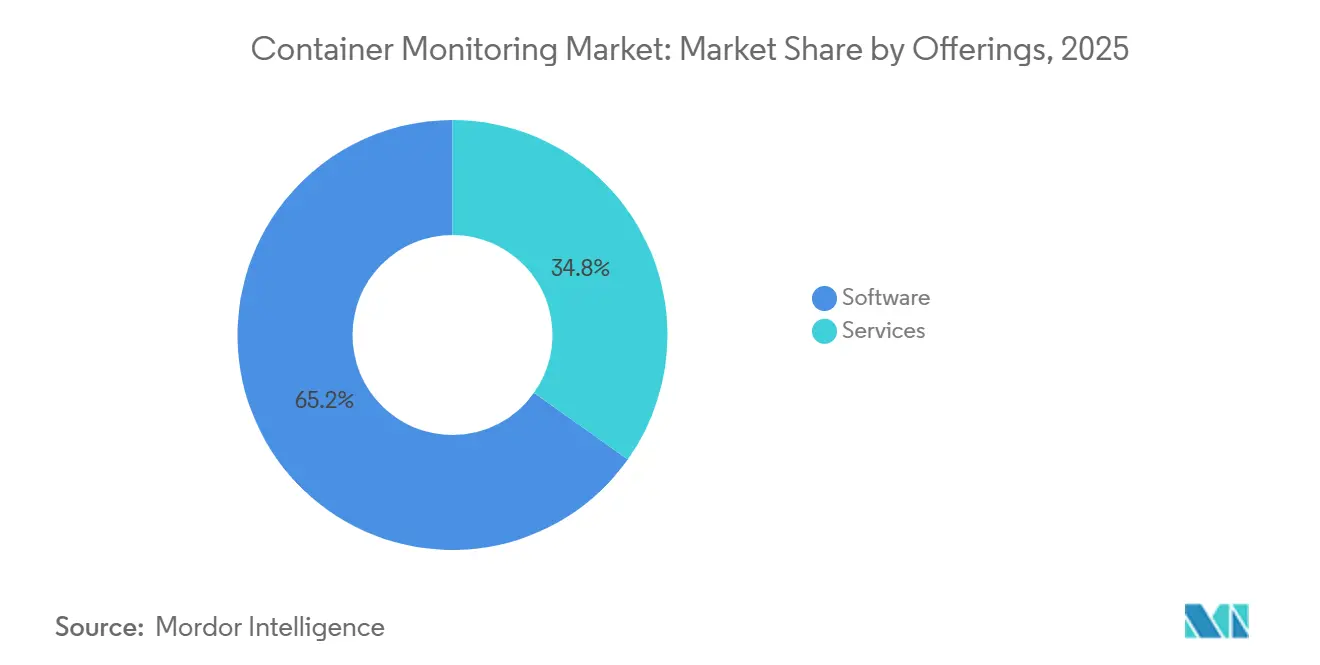
- By offerings, software captured 65.18% of container monitoring market share in 2025, services are forecast to outpace all other offerings at a 22.83% CAGR through 2031.
- By deployment model, cloud-based solutions held 57.83% of the container monitoring market size in 2025, whereas hybrid architectures are advancing at a 22.58% CAGR over 2026-2031.
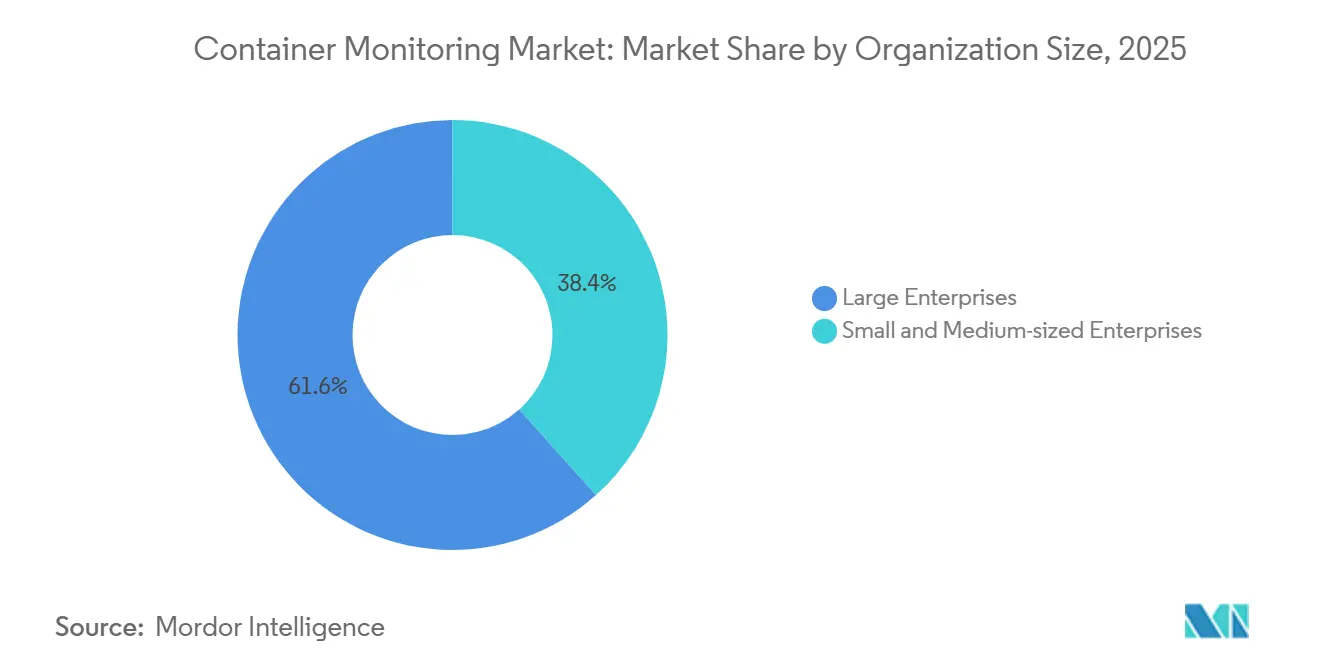
- By organization size, large enterprises accounted for 61.64% of 2025 spend, while small and medium-sized enterprises are expanding at 22.91% during the forecast window.
- By container platform, Kubernetes led with 72.93% container monitoring market share in 2025, yet HashiCorp Nomad is projected to grow at 22.52% CAGR through 2031.
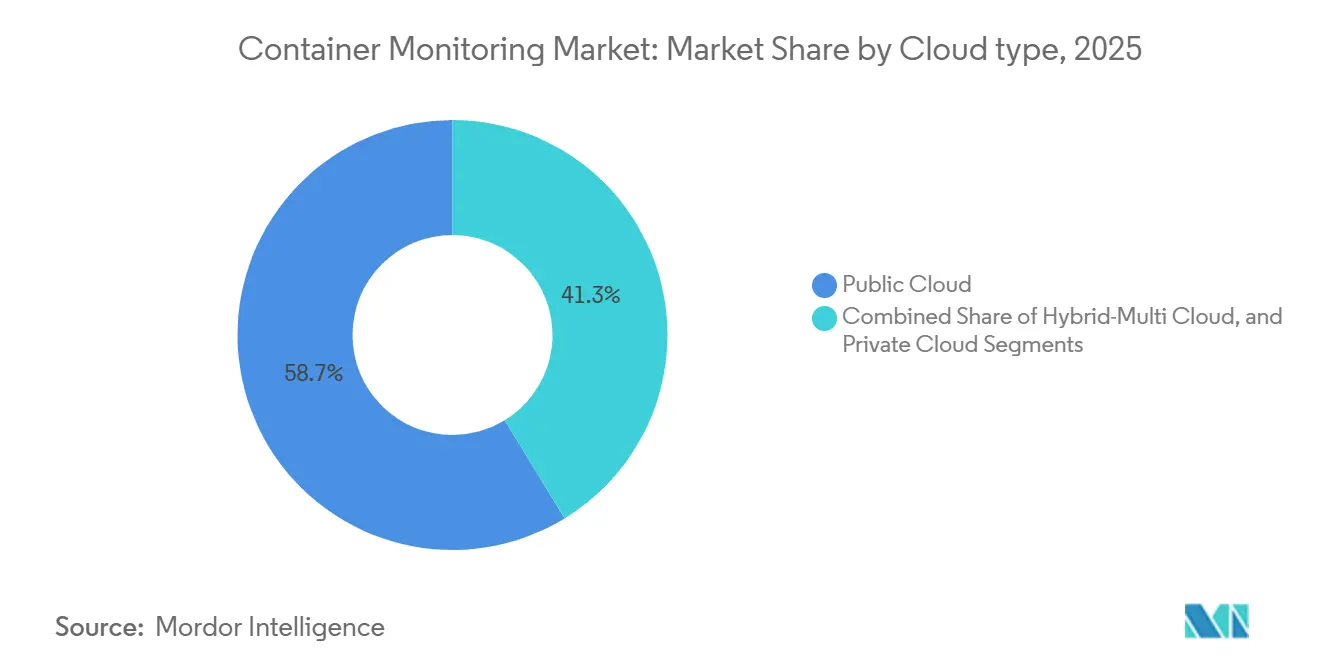
- By cloud type, public cloud deployments represented 58.74% of revenue in 2025; hybrid multi-cloud is the fastest sub-segment at 23.02% CAGR to 2031.
- By end-user industry, IT and telecom delivered 31.68% of 2025 revenue, whereas healthcare and life sciences is poised for the highest 23.16% CAGR through 2031.
- By geography, North America commanded 31.94% of the 2025 container monitoring market; Asia-Pacific is forecast to advance at a 23.61% CAGR across the outlook period.
Note: Market size and forecast figures in this report are generated using Mordor Intelligence’s proprietary estimation framework, updated with the latest available data and insights as of 2026.
Global Container Monitoring Market Trends and Insights
Drivers Impact Analysis*
| Driver | (~) % Impact on CAGR Forecast | Geographic Relevance | Impact Timeline |
|---|---|---|---|
| Growing Adoption of Cloud-Based Services | +4.2% | North America, Asia-Pacific | Medium term (2-4 years) |
| Proliferation of Micro-Services Architecture | +3.8% | Global (IT and telecom, retail) | Medium term (2-4 years) |
| DevOps Shift-Left Culture Driving Continuous Monitoring | +3.5% | North America, Europe | Short term (≤ 2 years) |
| Rising Compliance and Container-Security Mandates | +3.1% | Europe, North America | Long term (≥ 4 years) |
| eBPF-Enabled Deep, Low-Overhead Observability | +2.9% | Global (early U.S. adoption) | Short term (≤ 2 years) |
| FinOps Cost-Optimization Pressures at Container Level | +2.7% | North America, Europe | Medium term (2-4 years) |
| Source: Mordor Intelligence | |||
Growing Adoption of Cloud-Based Services
Managed Kubernetes services—Amazon EKS, Azure AKS, and Google GKE—eliminate control-plane upkeep yet introduce highly ephemeral workloads that traditional agents cannot follow. Cloud-native collectors based on OpenTelemetry discover pods automatically and attach trace context without recompilation, giving teams end-to-end visibility even as clusters autoscale. Multi-cloud deployment spreads risk and bargaining power but splinters telemetry formats, prompting demand for unified dashboards with schema-normalization layers. Consumption-based pricing further lowers entry barriers, letting organizations meter observability spend in lockstep with actual resource usage.
Proliferation of Micro-Services Architecture
Breaking monoliths into dozens of loosely coupled services multiplies network hops and failure points. A single e-commerce checkout can now traverse inventory, payments, shipping, and notification microservices, all orchestrated in separate pods. Distributed tracing injects unique identifiers into every request, while service-mesh sidecars such as Istio propagate that context across languages. The Cloud Native Computing Foundation recorded that 61% of enterprises run containers in production, up from 49% two years earlier, underscoring the irreversible march toward microservices.[1] Cloud Native Computing Foundation, “CNCF Annual Survey 2024,” cncf.io
DevOps Shift-Left Culture Driving Continuous Monitoring
Continuous integration pipelines now gate production deployments on performance budgets as strictly as on functional tests. Synthetic traffic replay in staging flags telemetry regressions early, cutting mean time to resolution. NIST SP 800-190 recommended embedding vulnerability scans and runtime policy enforcement into build workflows, leading DevOps teams to treat observability configurations as version-controlled code.[2]National Institute of Standards and Technology, “SP 800-190: Application Container Security Guide,” nist.gov The approach trims post-production firefighting and elevates monitoring from reactive insurance to proactive quality control.
eBPF-Enabled Deep, Low-Overhead Observability
Extended Berkeley Packet Filter programs run inside the Linux kernel, capturing syscalls, network packets, and file I/O with <1% CPU overhead. Vendors such as Grafana Labs and Datadog employ eBPF to auto-instrument even closed-source binaries, slashing rollout friction.[3]Grafana Labs, “Introducing Grafana Beyla,” grafana.com Security teams leverage the same hooks to enforce zero-trust egress policies at the socket layer without decrypting payloads, satisfying privacy rules in finance and healthcare. Kernel-level insight marries infrastructure and application telemetry on a unified clock, sharpening root-cause correlation.
Restraints Impact Analysis*
| Restraint | (~) % Impact on CAGR Forecast | Geographic Relevance | Impact Timeline |
|---|---|---|---|
| Tool-Chain Complexity and Skills Gap | –2.8% | Global (acute in emerging markets) | Medium term (2-4 years) |
| Escalating Telemetry Storage and Licensing Costs | –2.3% | Global (SMEs hardest hit) | Short term (≤ 2 years) |
| Shortage of Container-Observability Talent | –1.9% | North America, Europe | Long term (≥ 4 years) |
| Data-Sovereignty Limits on Cross-Border Telemetry Flows | –1.6% | Europe, Middle East, Asia-Pacific | Long term (≥ 4 years) |
| Source: Mordor Intelligence | |||
Tool-Chain Complexity and Skills Gap
Many enterprises juggle Prometheus metrics, Elasticsearch logs, and Jaeger traces in bespoke pipelines that break whenever an API version shifts. Kubernetes itself imposes a steep learning curve—network policies, persistent volumes, sidecar proxies—so few engineers can also fine-tune high-cardinality dashboards. Reliance on multiple user interfaces fragments incident response, prolonging outages and dampening enthusiasm for broader rollouts.
Escalating Telemetry Storage and Licensing Costs
High-cardinality labels such as pod_name, customer_id, or git_sha explode time-series cardinality, generating terabytes per day in large clusters. ISPs charge egress fees, vendors meter ingest bytes, and auditors demand multi-year retention, pushing observability bills beyond infrastructure budgets. Downsampling alleviates cost but loses granularity precisely when root-cause clues hide in outlier traces. The tension forces teams to prioritize mission-critical workloads, leaving blind spots in less visible services.
*Our forecasts treat driver/restraint impacts as directional, not additive. The impact forecasts reflect baseline growth, mix effects, and variable interactions.
Segment Analysis
By Offerings: Services Scale as Complexity Outpaces DIY Skills
Services are projected to expand at 22.83% CAGR through 2031, edging above the overall container monitoring market size trajectory despite software’s 65.18% revenue lead in 2025. Organizations increasingly outsource deployment, tune anomaly-detection models, and manage alert fatigue, freeing developers to focus on feature velocity. eBPF-based agents cut software footprint, but the know-how to operationalize them still commands premium consulting rates.
Annual renewals reveal that customers stick with managed engagements once service-level objectives improve; churn falls sharply when vendors own 24/7 runbooks. Integrators bundle observability-as-code templates in Git, aligning dashboard changes with the same peer-review gates that govern application releases. This governance best practice, initially seeded by service partners, often becomes institutionalized, widening the moat for providers.


By Deployment Model: Hybrid Bridges Compliance and Cloud Economics
Hybrid environments are advancing at 22.58% CAGR, closing the gap with cloud-native modes that held 57.83% share in 2025. Financial firms governed by the Digital Operational Resilience Act keep raw payment traces on-premise but burst aggregated metrics into cloud AI engines for predictive scaling. Edge proxies perform local downsampling to meet air-gap rules in defense and critical infrastructure.
Public cloud dominates greenfield projects thanks to zero-maintenance control planes and granular cost tagging. Yet rising egress charges and sovereignty laws nudge even start-ups toward hybrid setups, especially once monthly cloud bills surface line items for telemetry storage that rival compute spend. Vendors respond with tiered storage—hot data in-memory, warm data on object stores, cold data compressed on cheaper archival layers.
By Organization Size: SMEs Leverage Managed Kubernetes to Level the Field
Small and medium-sized enterprises are tracking a 22.91% CAGR, slightly eclipsing large-enterprise growth despite controlling only 38.36% of 2025 spend. Turnkey Kubernetes clusters, provisioned via web console and billed per-node-hour, let lean teams deploy without hiring platform engineers. Consumption-priced observability pairs seamlessly, offering entry tiers that include 10,000 span-per-minute quotas at no charge.
Large enterprises, however, still drive absolute dollars, stitching multiple clusters across regions for disaster recovery. They demand single-pane role-based access control and integration with ticketing systems, features that skew R&D roadmaps toward enterprise SKUs. Vendors thus segment their catalogues—SME SaaS plans with click-to-connect wizards, and enterprise on-premise offerings with Hardware Security Module support.
By Container Platform: Kubernetes Hegemony Faces Edge-Centric Nomad Surge
Kubernetes owned 72.93% of 2025 workloads, cementing its role as the default orchestrator. Yet HashiCorp Nomad’s lightweight binary and Consul/Vault integration fuel 22.52% CAGR at the edge, where air-gapped oil rigs or retail kiosks lack the resources for a multi-component control plane. Docker Swarm continues a gentle decline as organizations rewrite legacy stacks for Helm chart portability.
Monitoring vendors prioritize Kubernetes operators—custom resource definitions that deploy DaemonSets for collectors and manage automatic upgrades—thereby deepening lock-in. Nomad-first providers carve a niche with compact binaries and offline-friendly license servers. Apache Mesos remains a specialist option for mixed big-data and container scheduling but shows little incremental net-new adoption.
By Cloud Type: Hybrid Multi-Cloud Complexity Elevates Single-View Dashboards
Public clouds retained 58.74% of 2025 spend, driven by managed services and global network reach. Hybrid multi-cloud is the bright spot, advancing at 23.02% as firms split workloads across Amazon, Microsoft, and Google to curb vendor power and meet jurisdictional rules. Private clouds persist in defense and national-critical sectors, yet most roadmap discussions now assume eventual cloud adjacency for analytics layers.
Unified observability renders cloud heterogeneity invisible. OpenTelemetry collectors normalize Amazon CloudWatch logs, Google Cloud Operations metrics, and Azure Monitor traces before forwarding them to a central lake. This abstraction cushions provider switches and clarifies cost attribution, feeding FinOps dashboards that rebalance workloads according to spot-instance arbitrage.

By End-User Industry: Compliance-Driven Healthcare Outpaces High-Tech Pioneers
Healthcare and life sciences top the growth chart at 23.16% CAGR, spurred by HIPAA mandates for immutable audit trails on patient-data flows. Containerized Electronic Health Record modules now emit structured traces, writing protected health information hashes rather than plaintext identifiers, which satisfy privacy audits while enabling root-cause triage.
IT and telecom dominated 2025 revenue at 31.68%, reflecting streaming-media carbohydrate spikes and SaaS platform ubiquity. Financial institutions embed latency Service Level Objectives in payment gateways—sub-100 ms end-to-end times are no longer aspirational but published regulatory thresholds. Retail-e-commerce leans on auto-scaling to weather Black Friday bursts; observability drives capacity rightsizing that saves millions in over-provisioned nodes. Manufacturing deploys ruggedized clusters on factory floors, marrying OT sensor feeds with IT analytics to predict equipment failure in seconds, not hours.
Geography Analysis
North America held 31.94% of 2025 revenue, anchored by Silicon Valley cloud natives and Wall-Street fintechs that run thousands of clusters across availability zones. United States federal agencies adopted Kubernetes Security Benchmarks in 2025, compelling prime contractors to include real-time monitoring in project bids. Canada’s major banks mirror these controls, while Mexico’s automotive plants implement edge collectors that buffer traces during intermittent connectivity, uploading once bandwidth frees overnight.
Asia-Pacific is racing ahead at a 23.61% CAGR to 2031. China’s sovereign-cloud edicts propelled domestic providers to embed observability agents as default add-ons, turning monitoring into a bundled utility rather than an upsell. India’s Digital Personal Data Protection Act limits metric egress, so hyperscalers opened regional zones with in-country storage tiers, immediately lifting container monitoring market size in Bangalore and Hyderabad. Japan’s Industry 4.0 factory retrofits require latency dashboards for robotic cells; South Korea’s telcos bake monitoring SLAs into 5G slicing contracts.
Europe’s trajectory aligns more with regulatory cadence than pure tech enthusiasm. The Digital Operational Resilience Act, live since January 2025, obligates financial entities to stress-test IT systems under live-production loads, creating a hard mandate for granular telemetry. Germany’s auto giants monitor over-the-air software updates for millions of vehicles, pushing petabyte-scale trace stores. France and the United Kingdom emphasize data residency, turning to regional cloud resellers certified under ISO 27001 to host telemetry lakes. The Middle East and Africa lag on absolute spend but post double-digit growth where sovereign-funded hyperscale builds in Riyadh and Abu Dhabi demand certified observability stacks.
Mordor Intelligence provides coverage of the container monitoring market across other key regional markets, including Asia, each with their regulatory frameworks and demand patterns.

Competitive Landscape
Incumbent APM vendors, cloud-native disrupters, and open-source guardians share the battlefield. Datadog, Dynatrace, Splunk, New Relic, and Cisco’s AppDynamics bundle AI assistants that surface anomalous golden signals—latency, traffic, errors, saturation—without custom queries. Grafana Labs and Elastic steward communities around open dashboards and query languages, monetizing through hosted SaaS tiers with enterprise support. Sysdig and Aqua pivot from container security to runtime visibility, offering single agents that stream both security and performance events.
Partner ecosystems matter as much as feature checklists. Hyperscalers list third-party collectors in their marketplaces, enabling click-through procurement that bypasses lengthy vendor-risk reviews. OpenTelemetry breaks data-format lock-in, forcing vendors to differentiate on analytics sophistication and workflow integration rather than proprietary protocols. Price—for-value trends downward as entrant startups court cost-sensitive SMEs with “always-free” ingestion thresholds and per-span billing.
Consolidation is inevitable: heavyweights acquire niche compression engines or edge-collector start-ups to close multi-cloud gaps. Yet open source remains a potent counterweight, with CNCF incubating projects that commoditize yesterday’s premium features. Talent scarcity keeps managed-service revenue buoyant; enterprises gladly offload 24/7 telemetry plumbing to specialists, especially when every minute of SRE time saved translates into new customer-facing releases.
Container Monitoring Industry Leaders
Datadog, Inc.
Dynatrace, LLC
Splunk Inc.
New Relic, Inc.
Sysdig, Inc.
- *Disclaimer: Major Players sorted in no particular order

Recent Industry Developments
- November 2025: Dynatrace’s fiscal Q2 2026 report showed annual recurring revenue exceeding USD 1.6 billion, citing 70% of new deals bundling Kubernetes modules.
- August 2025: Grafana Labs unveiled Grafana Cloud Kubernetes Monitoring, a managed Prometheus-compatible offering with pre-built failure-mode dashboards.
- June 2025: Cloudflare unveiled Containers in public beta, blending global edge deployment with built-in metrics and logs.
- May 2025: Microsoft released the OpenTelemetry agent GA and the Aspire dashboard for Azure Container Apps, backed by an AI-powered SRE agent.


Global Container Monitoring Market Report Scope
Container monitoring is the activity of monitoring the performance of microservice containers in different environments for optimizing and improving its performance. Container monitoring is an important capability required for applications that are built on modern microservices architectures to ensure optimal performance. It gives IT teams a quick overview to rapidly develop and deploy applications using DevOps principles. Containers are transient and are critical to monitor as compared to traditional applications running on virtual servers or bare metal servers.
The Container Monitoring Market Report is Segmented by Offerings (Software, Services), Deployment Model (Cloud-based, On-Premise, Hybrid), Organization Size (Small and Medium-sized Enterprises, Large Enterprises), Container Platform (Kubernetes, Docker Swarm, Apache Mesos, HashiCorp Nomad, Other Runtimes), Cloud Type (Public Cloud, Private Cloud, Hybrid Multi-Cloud), End-User Industry (IT and Telecom, BFSI, Retail and E-commerce, Manufacturing and Industrial, Healthcare and Life Sciences, Other End-User Industries), and Geography (North America, Europe, Asia-Pacific, South America, Middle East, Africa). The Market Forecasts are Provided in Terms of Value (USD).
| Software |
| Services |
| Cloud-based |
| On-Premise |
| Hybrid |
| Small and Medium-sized Enterprises |
| Large Enterprises |
| Kubernetes |
| Docker Swarm |
| Apache Mesos |
| HashiCorp Nomad |
| Other Runtimes |
| Public Cloud |
| Private Cloud |
| Hybrid Multi-Cloud |
| IT and Telecom |
| BFSI |
| Retail and E-commerce |
| Manufacturing and Industrial |
| Healthcare and Life Sciences |
| Other End-User Industries |
| North America | United States |
| Canada | |
| Mexico | |
| Europe | Germany |
| United Kingdom | |
| France | |
| Russia | |
| Rest of Europe | |
| Asia-Pacific | China |
| Japan | |
| India | |
| South Korea | |
| Australia | |
| Rest of Asia-Pacific | |
| South America | Brazil |
| Argentina | |
| Rest of South America | |
| Middle East | Saudi Arabia |
| United Arab Emirates | |
| Rest of Middle East | |
| Africa | South Africa |
| Egypt | |
| Rest of Africa |
| By Offerings | Software | |
| Services | ||
| By Deployment Model | Cloud-based | |
| On-Premise | ||
| Hybrid | ||
| By Organization Size | Small and Medium-sized Enterprises | |
| Large Enterprises | ||
| By Container Platform | Kubernetes | |
| Docker Swarm | ||
| Apache Mesos | ||
| HashiCorp Nomad | ||
| Other Runtimes | ||
| By Cloud Type | Public Cloud | |
| Private Cloud | ||
| Hybrid Multi-Cloud | ||
| By End-User Industry | IT and Telecom | |
| BFSI | ||
| Retail and E-commerce | ||
| Manufacturing and Industrial | ||
| Healthcare and Life Sciences | ||
| Other End-User Industries | ||
| By Geography | North America | United States |
| Canada | ||
| Mexico | ||
| Europe | Germany | |
| United Kingdom | ||
| France | ||
| Russia | ||
| Rest of Europe | ||
| Asia-Pacific | China | |
| Japan | ||
| India | ||
| South Korea | ||
| Australia | ||
| Rest of Asia-Pacific | ||
| South America | Brazil | |
| Argentina | ||
| Rest of South America | ||
| Middle East | Saudi Arabia | |
| United Arab Emirates | ||
| Rest of Middle East | ||
| Africa | South Africa | |
| Egypt | ||
| Rest of Africa | ||


Key Questions Answered in the Report
How large will the container monitoring market be by 2031?
The container monitoring market size is forecast to reach USD 5.02 billion by 2031.
Which segment is growing fastest within container observability?
Services are projected to expand at a 22.83% CAGR, the highest among all offerings.
Why are healthcare companies investing heavily in container monitoring?
HIPAA audit-trail mandates require immutable, real-time visibility into patient-data flows, driving a forecast 23.16% CAGR for healthcare and life sciences workloads.
What role does eBPF play in modern observability?
EBPF runs inside the Linux kernel, capturing low-level events with <1% CPU overhead, enabling deep yet efficient container visibility.
How are hybrid multi-cloud strategies influencing monitoring tool choice?
Hybrid multi-cloud’s 23.02% CAGR fuels demand for platforms that normalize telemetry across AWS, Azure, and Google Cloud while keeping regulated data in-region.
Page last updated on:


