Container Security Market Size and Share
Market Overview
| Study Period | 2020 - 2031 |
|---|---|
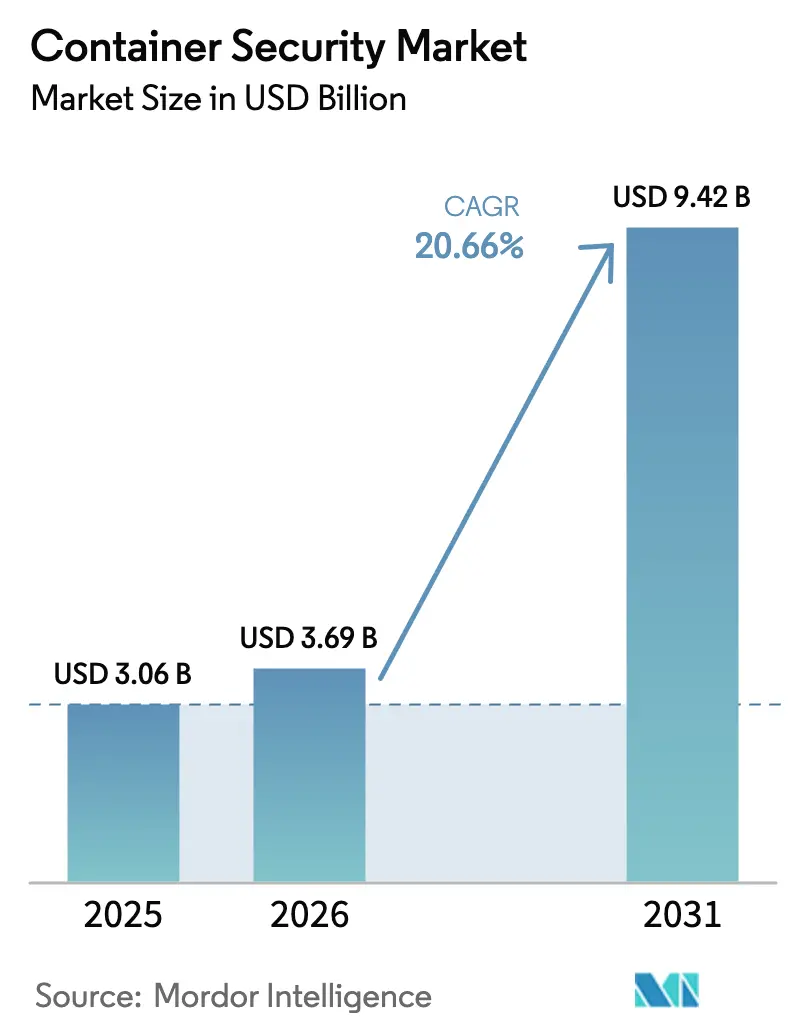
| Market Size (2026) | USD 3.69 Billion |
| Market Size (2031) | USD 9.42 Billion |
| Growth Rate (2025 - 2030) | 20.66% CAGR |
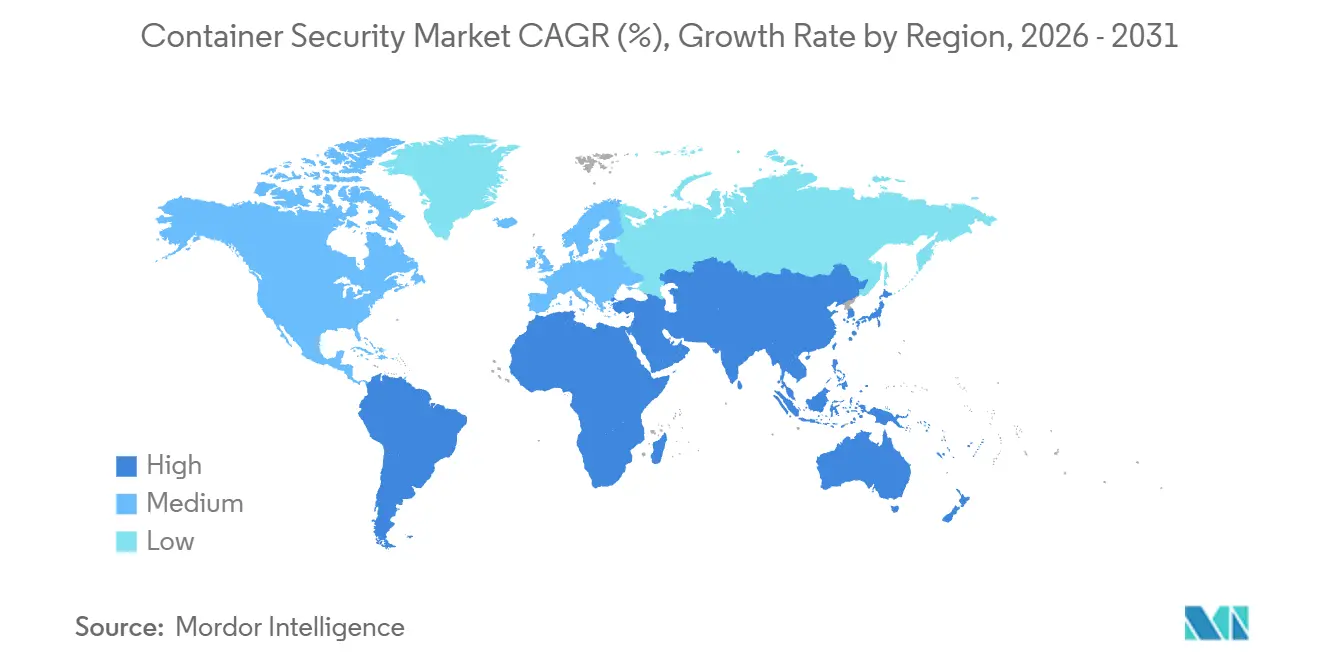
| Fastest Growing Market | Asia Pacific |
| Largest Market | North America |
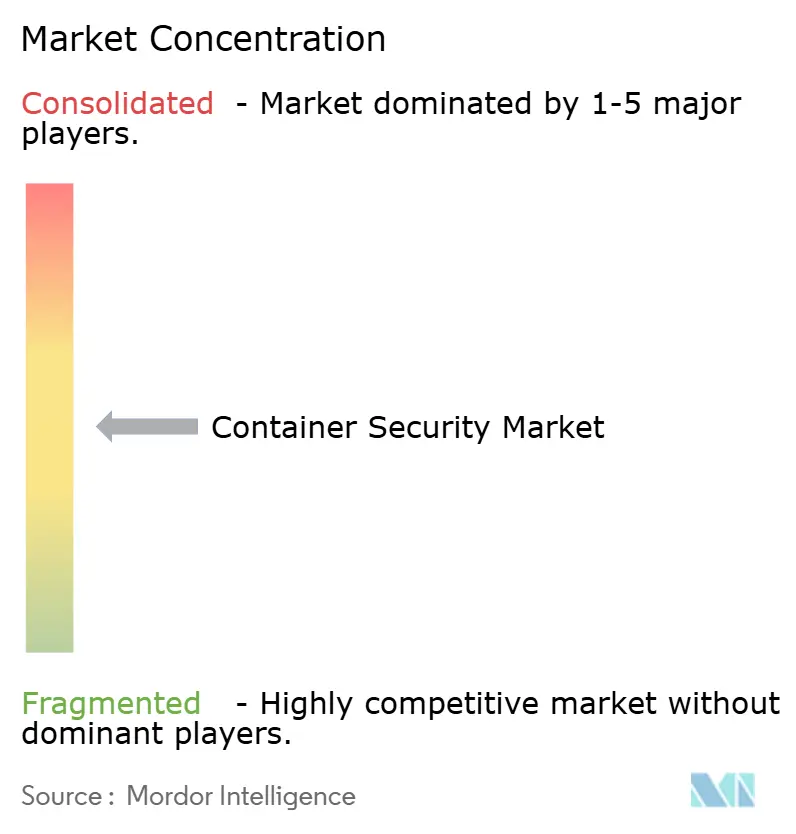
| Market Concentration | Medium |
Major Players *Disclaimer: Major Players sorted in no particular order Image © Mordor Intelligence. Reuse requires attribution under CC BY 4.0. | |
Container Security Market Analysis by Mordor Intelligence
The Container Security Market size was valued at USD 3.06 billion in 2025 and is estimated to grow from USD 3.69 billion in 2026 to reach USD 9.42 billion by 2031, at a CAGR of 20.66% during the forecast period (2026-2031). Growth is fueled by mandatory software-bill-of-materials controls in PCI-DSS 4.0, NIS2, and emerging SBOM legislation, the rapid pivot to microservices, and a steady rise in supply-chain exploits targeting container images. Vendors are embedding image scanning, runtime telemetry, and policy-as-code into CI/CD workflows to satisfy these compliance and threat pressures. North America remains the largest regional buyer because U.S. financial-services and healthcare enterprises must log every container execution for audit, while Asia-Pacific shows the fastest expansion on the back of China’s sovereign-cloud rules and India’s digital-public-infrastructure rollout. Competition is intense as hyperscale clouds bundle native protection, prompting independent vendors to focus on agentless scanning, eBPF runtime data, and policy automation.
Key Report Takeaways
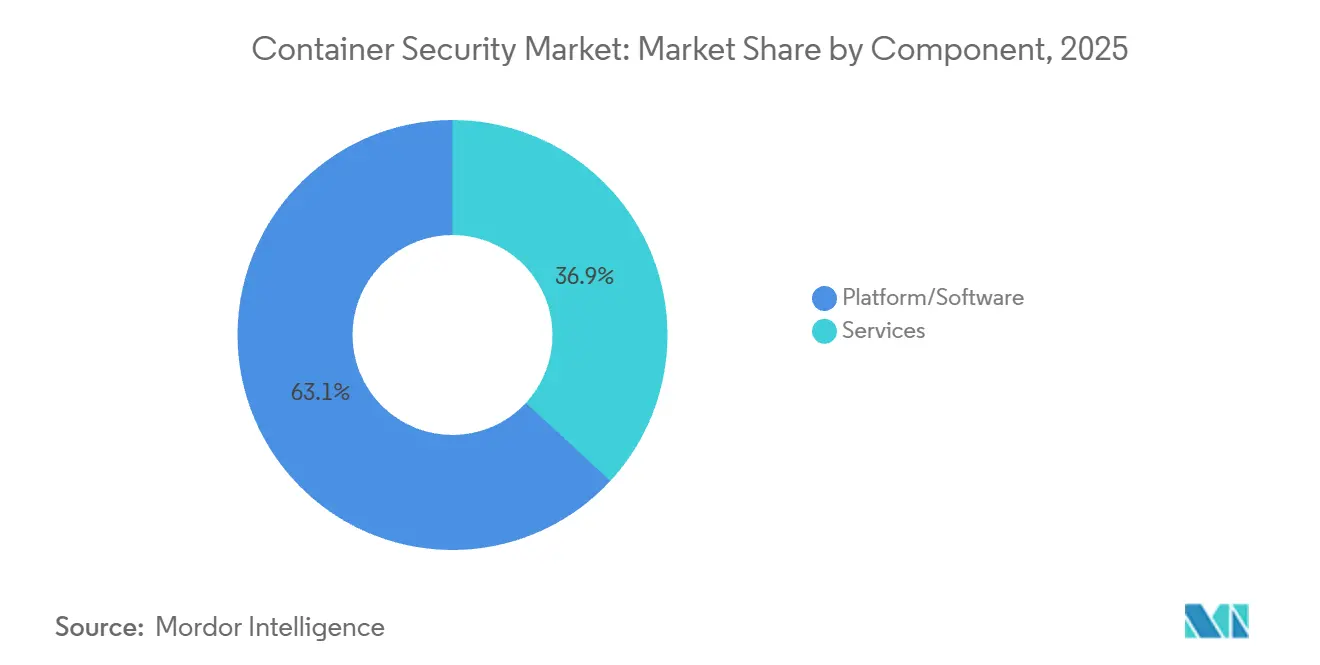
- By component, platforms and software captured 63.13% of 2025 container security market share, while services are projected to post a 21.41% CAGR to 2031.
- By organization size, large enterprises contributed 71.28% of 2025 revenue; small and medium enterprises are forecast to grow at a 22.93% CAGR through 2031.
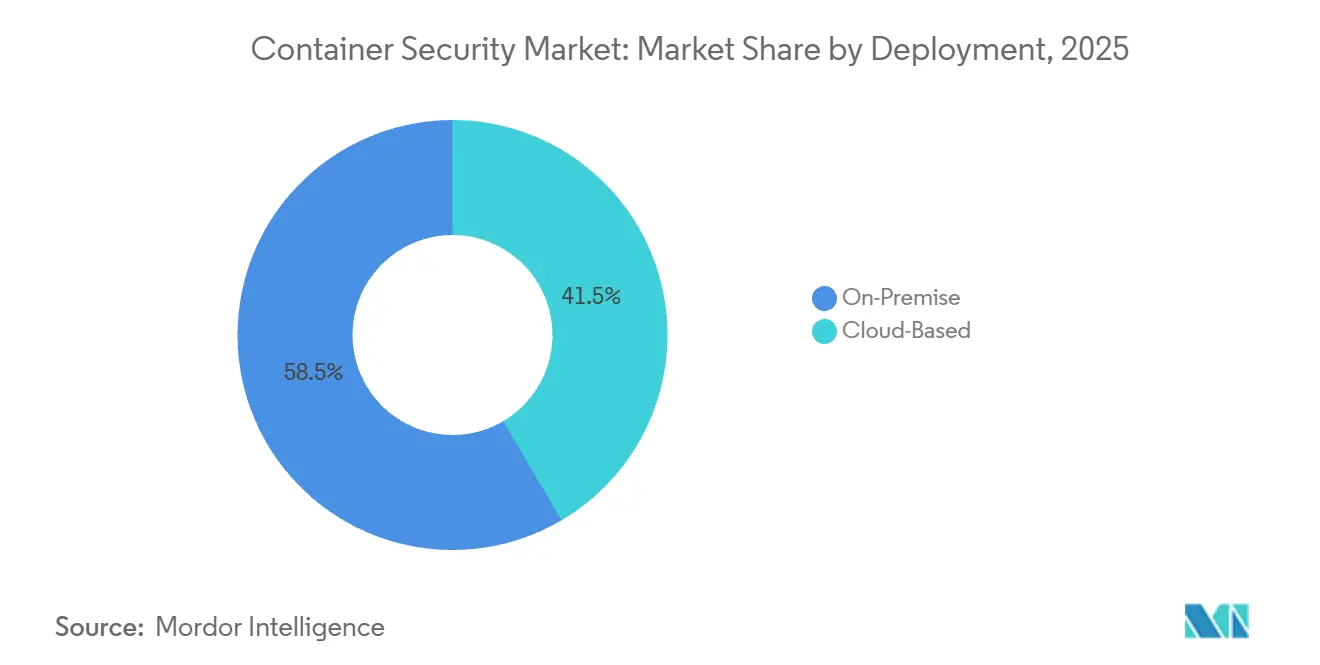
- By deployment, on-premise environments held 58.47% of 2025 revenue, yet cloud-based offerings are expected to expand at a 23.11% CAGR during 2026-2031.
- By security control, image scanning accounted for 46.72% of 2025 spending, but runtime protection is projected to rise at a 21.18% CAGR to 2031.
- By end-user industry, IT and telecom led with 29.81% of 2025 sales, while healthcare and life sciences are forecast to grow at 23.76% through 2031.
- By geography, North America dominated with a 42.42% share in 2025, while Asia Pacific is moving ahead at a 22.64% CAGR.
Note: Market size and forecast figures in this report are generated using Mordor Intelligence’s proprietary estimation framework, updated with the latest available data and insights as of January 2026.
Global Container Security Market Trends and Insights
Drivers Impact Analysis*
| Driver | (~)% Impact on CAGR Forecast | Geographic Relevance | Impact Timeline |
|---|---|---|---|
| Rising adoption of hybrid and multi-cloud container workloads | +4.20% | Global, with Asia-Pacific leading adoption | Medium term (2-4 years) |
| Rapid shift toward micro-services and DevSecOps pipelines | +3.80% | North America and EU, expanding to Asia-Pacific | Short term (≤ 2 years) |
| Mandatory security mandates (e.g., PCI-DSS 4.0, NIS2, SBOM) | +3.10% | EU-driven globally, US financial sector | Long term (≥ 4 years) |
| Rising frequency of supply-chain attacks on container images | +2.90% | Global, concentrated in developed markets | Short term (≤ 2 years) |
| Proliferation of edge and 5G container runtimes | +2.70% | Asia-Pacific core, spill-over to MEA | Medium term (2-4 years) |
| Hardware-level container isolation innovations | +1.80% | North America and EU technology hubs | Long term (≥ 4 years) |
| Source: Mordor Intelligence | |||
Rising Adoption of Hybrid and Multi-Cloud Container Workloads
Eighty percent of enterprises now run workloads across two or more public clouds, which fragments identity management and multiplies misconfiguration risk. Security teams seek Kubernetes posture-management tools that normalize AWS, Azure, and Google policies inside one dashboard. NIS2 requires supply-chain assessments for critical infrastructure, so multi-cloud users must add provenance tracking and cryptographic attestation to container registries. PCI-DSS 4.0 extends continuous monitoring mandates to ephemeral containers, reinforcing demand for real-time visibility across hybrid estates.[1]PCI Security Standards Council, “PCI-DSS 4.0 Requirements and Testing Procedures,” pcisecuritystandards.org Financial institutions and payment processors therefore invest heavily in unified scanning and runtime analytics.
Rapid Shift Toward Microservices and DevSecOps Pipelines
GitHub’s Advanced Security for Azure DevOps introduced secret scanning and dependency review within pull requests, shrinking the gap between code commit and remediation. Teams must codify policies using Open Policy Agent or admission webhooks so developers can consume rules without friction. AI and machine-learning containers grew fivefold year over year, exposing new inference APIs that attackers probe for data exfiltration. Runtime anomaly detection through eBPF probes baselines syscall behavior and flags cryptomining or privilege escalation, but tuning models to limit false positives remains difficult.
Mandatory Security Mandates (PCI-DSS 4.0, NIS2, SBOM)
PCI-DSS 4.0 requirement 6.3.3 makes software inventories compulsory, effectively enforcing SBOM generation for payment workloads. Docker’s native SPDX and CycloneDX output embeds dependency data at build time, easing audits. NIS2 extends obligations to cloud operators, compelling container-platform vendors to align with ETSI EN 303 645 when orchestrating edge workloads. Binary Authorization in Google GKE enforces signed images only, matching NIST guidance and giving European banks a ready-made attestation path. Healthcare and finance organizations face the highest penalties for non-compliance, driving accelerated adoption.
Rising Frequency of Supply-Chain Attacks on Container Images
Three critical runc flaws disclosed in November 2025 proved that container escapes still threaten every Kubernetes distribution. Attackers increasingly poison upstream base images, inserting backdoors that developers trust by default. Amazon Inspector now scans images at push time and blocks critical CVEs before deployment. Microsoft Defender for Containers correlates image vulnerabilities with runtime calls, prioritizing patches for packages actually executed. Distroless images reduce attack surface but complicate debugging, forcing teams to balance security and operability.
Restraints Impact Analysis*
| Restraint | (~)% Impact on CAGR Forecast | Geographic Relevance | Impact Timeline |
|---|---|---|---|
| Shortage of container-security skillsets in DevOps teams | -2.80% | Global, acute in emerging markets | Medium term (2-4 years) |
| Operational complexity of multi-cloud and multi-cluster estates | -2.10% | Enterprise-focused, North America and EU | Short term (≤ 2 years) |
| Alert-fatigue and false-positive overload | -1.60% | Global, affecting security operations centers | Short term (≤ 2 years) |
| Advanced container-escape kill-chains | -1.30% | High-security environments globally | Long term (≥ 4 years) |
| Source: Mordor Intelligence | |||
Shortage of Container-Security Skillsets in DevOps Teams
The global cybersecurity talent gap stands at 4.8 million, and Kubernetes expertise is even rarer.[2] ISC2, “Cybersecurity Workforce Study 2024,” isc2.org DevOps engineers often lack threat-modeling skills, and analysts unfamiliar with pods struggle to interpret audit logs. Managed Kubernetes services now embed hardened defaults, yet human judgment remains vital for novel attack chains. Training programs cannot match quarterly Kubernetes releases, forcing many enterprises to outsource monitoring and forensics.
Operational Complexity of Multi-Cloud and Multi-Cluster Estates
Organizations juggle dozens of clusters across AWS, Azure, and Google Cloud, each with different ingress, network, and secret frameworks. Red Hat Advanced Cluster Security centralizes views but needs custom connectors for every provider.[3]Red Hat, “OpenShift Advanced Cluster Security Overview,” redhat.com Misconfiguration scanners surface thousands of alerts per cluster, overwhelming staff who must separate genuine risk from noise. GitOps helps codify desired state, but demands rigid change discipline. Service-mesh overlays further complicate debugging when mutual TLS certificates or sidecar proxies malfunction.
*Our forecasts treat driver/restraint impacts as directional, not additive. The impact forecasts reflect baseline growth, mix effects, and variable interactions.
Segment Analysis
By Component: Services Gain as Enterprises Outsource Policy Tuning
Platform and software offerings led the container security market size with 63.13% of 2025 revenue. Integrated suites delivering image scanning, admission control, and eBPF runtime monitoring dominate because buyers prefer a single interface for policy creation and compliance reporting. Managed services are projected to grow at a 21.41% CAGR, outpacing overall growth as enterprises hire providers to tune rules and triage incidents 24/7. Professional engagements focus on threat modeling and least-privilege policy design for microservices. This outsourcing trend highlights the shortage of in-house expertise and positions service providers as strategic partners in continuous security improvement.
Aqua Security, Sysdig, and Palo Alto Networks bundle consulting with product subscriptions, while cloud providers wrap advisory support into premium tiers. As a result, the container security market continues shifting from pure-play software toward hybrid delivery models that blend platforms with managed detection and response.


By Organization Size: SMEs Accelerate Cloud-Native Adoption
Large enterprises represented 71.28% of 2025 spending because regulated verticals maintain hundreds of clusters that require premium solutions. These buyers integrate container telemetry with SIEM and SOAR to speed remediation. Small and medium enterprises, in contrast, favor lightweight scanners and cloud-native policies that ship with managed Kubernetes. The segment is expected to deliver a 22.93% CAGR as cloud providers embed default protection, closing capability gaps and lowering barriers to entry.
SMEs tap agentless scanning from vendors like Wiz, anchoring security directly in CI pipelines without dedicated staff. Community projects such as Falco give startups baseline runtime defense at zero licensing cost, letting scarce budgets fund growth. The democratization of functionality broadens the container security industry customer base and diversifies revenue away from only large buyers.
By Security Control: Runtime Protection Rises as Static Scans Plateau
Static image scanning owned 46.72% of 2025 revenue, but customers increasingly recognize that only 6% of registry vulnerabilities manifest at runtime. Runtime protection and anomaly detection are projected to expand at a 21.18% CAGR. eBPF agents collect granular syscall and network data, establishing behavioral baselines that expose cryptomining, data exfiltration, or unauthorized privilege escalations.
The integrated approach pairs admission controllers that block risky images with runtime engines that watch live workloads, correlating findings to prioritize patches that matter. This convergence helps security teams reduce alert volume and focus on active threats, reinforcing runtime analytics as the next growth vector.
By Deployment: Cloud Gains Despite On-Premise Inertia
On-premise clusters held 58.47% of 2025 revenue because defense, intelligence, and critical-infrastructure operators keep air-gapped environments for data sovereignty. The container security market size inside these sectors is stable but grows slowly. Cloud deployments are forecast to rise at a 23.11% CAGR as hybrid architectures become mainstream. Hardware-level isolation, agentless posture management, and unified dashboards reduce historic objections to public-cloud security.
Confidential computing chips now underpin many regulated workloads, while centralized scanning normalizes findings across EKS, AKS, and GKE. Edge scenarios introduce micro-Kubernetes on devices, pushing vendors to offer light collectors and offline policy enforcement to maintain protection when connectivity drops.
By End-User Industry: Healthcare Surges on HIPAA Cloud Migration
IT and telecom operators led spending with 29.81% of 2025 sales because containerized 5G cores and network functions require low-latency security. Healthcare and life sciences are forecast to grow at a 23.76% CAGR through 2031 as HIPAA guidance now labels cloud providers as business associates, compelling encryption, detailed audit logs, and SBOMs for medical data. Banks and payment processors remain heavy buyers due to PCI-DSS 4.0 continuous monitoring mandates, while retail adopts Kubernetes for seasonal scalability and relies on runtime protection to detect credential-stuffing attacks.
Industrial manufacturers place operational technology workloads onto edge Kubernetes, blending IT and OT realms and creating demand for security that respects real-time constraints yet still logs every packet for forensics.
Geography Analysis
North America delivered 42.42% of 2025 revenue thanks to stringent HIPAA, PCI-DSS, and SOC 2 rules that force enterprises to deploy container security market controls in every DevSecOps stage. U.S. hyperscalers accelerate adoption by bundling native features, while Canada’s banks implement posture management to satisfy OSFI cyber guidelines. Mexico’s manufacturers, bolstered by nearshoring, deploy containerized apps and adopt security scanning to protect supply chains.
Asia-Pacific is forecast to grow at 22.64% through 2031. China’s sovereign-cloud directives require domestic stacks, driving demand for local security platforms that map Kubernetes settings to national standards. India’s digital public infrastructure containerizes citizen services, introducing scale that mandates automated runtime visibility. Japan’s factories and South Korea’s telecoms use edge Kubernetes for IoT and 5G, relying on lightweight eBPF telemetry to guard latency-sensitive flows. Australia’s regulators issued cloud-risk guidelines, prompting banks to adopt Kubernetes posture management.
Europe benefits from NIS2, which took effect in October 2024 and expands requirements to every managed-service provider across 27 states. Germany’s BaFin rules and the UK’s operational resilience framework extend to containers, driving platform investments. France’s health-data regulations demand cryptographic attestation before containers touch patient records. Southern Europe experiences uplift as telcos deploy containerized 5G with runtime protection tuned for throughput.
The Middle East accelerates under Saudi Arabia’s Vision 2030 and UAE digital mandates, pushing government and state entities onto cloud-native platforms that need robust security. Turkey’s financial regulators craft cloud frameworks that spur container security adoption. Africa remains early stage; South African banks pilot runtime analytics, Nigerian fintechs use agentless scanners, and Egypt digitalizes services, though skills gaps slow momentum. South America grows as Brazil’s banks embrace Kubernetes for payments, but currency volatility tempers large upfront commitments.

Regulatory Landscape
Container security purchasing is increasingly anchored to software supply chain and product-security obligations that extend into build pipelines and runtime enforcement. In Europe, NIS2 took effect in October 2024 and expands cybersecurity and supplier-risk duties to a broader set of essential and important entities, pushing managed service providers and cloud operators to formalize container image provenance, vulnerability management, and incident readiness. The EU Cyber Resilience Act (Regulation (EU) 2024/2847) adds product-centric requirements for software sold in the EU, with mandatory vulnerability reporting obligations taking effect from September 2026 and full enforcement of essential requirements scheduled for December 2027. This timeline raises the operational bar for SBOM workflows and coordinated disclosure processes, shifting them from best practice to compliance workstreams.
Standards bodies are also defining technical baselines that map to container execution environments. ETSI adopted a work item for EN 304 635 covering cybersecurity requirements for container execution stacks in June 2025 and initiated the deliverable approval procedure in June 2026, creating a clearer conformity target for runtime hardening, isolation, and secure configuration in container platforms. As these obligations mature, organizations are operationalizing policy-as-code, signed images, and audit logging across Kubernetes and CI/CD to demonstrate traceability from source to deployment.
Value Chain Analysis
The container security value chain starts upstream with open-source components and base images (Kubernetes distributions, container runtimes, and libraries), then moves into build and release systems that generate artifacts (CI runners, registries, and packaging). SBOM generation and provenance tooling sits in the middle of the chain, using formats and frameworks such as SPDX/CycloneDX for inventories, SLSA and in-toto for provenance and attestations, and Sigstore for signing, before artifacts enter registries and are promoted through environments. Industry initiatives like OpenSSF GUAC 1.0 (released June 2025) add a graph layer to aggregate and enrich SBOM and provenance data, helping security teams answer dependency and exposure questions across many images and repositories.
Downstream, enforcement and detection take place at cluster admission and runtime. Kubernetes Pod Security Standards and admission controllers (for example, Kyverno and OPA Gatekeeper) gate deployments by checking signatures, attestations, and configuration policies, while runtime sensors and eBPF-based telemetry feed security analytics and response. Distribution is primarily via vendor SaaS platforms and hyperscaler marketplaces, complemented by SIs and MSSPs that tune policies, integrate SIEM and SOAR, and run 24/7 operations. Bottlenecks cluster around transitive-dependency visibility, inconsistent metadata across registries and build systems, and operational overload from multi-cluster estates, so suppliers package hardened images, automated remediation, and consolidated posture plus runtime tooling into unified platforms and managed services.
Competitive Landscape
The container security market shows moderate concentration. Hyperscalers AWS, Microsoft, and Google bundle inspection, admission control, and runtime alerts with their managed Kubernetes offerings, squeezing pure-play vendors on price. Independent providers answer with agentless discovery, deep eBPF analytics, and policy-as-code. Palo Alto Networks offers Prisma Cloud to unify container, serverless, and CSPM in one console, while Aqua and Sysdig court DevOps teams with API-first designs.
Acquisitions cluster around SBOM creation, admission-controller engines, and runtime analytics to deliver unified end-to-end stacks. Open-source projects such as Falco, Open Policy Agent, and Sigstore provide building blocks that vendors package with enterprise support.
Edge computing creates new white space where lightweight collectors and offline enforcement become differentiators. Platform-engineering teams expect self-service security, so vendors prioritize GitOps integration over traditional GUIs.
Container Security Industry Leaders
Google Cloud Security
Red Hat, Inc.(IBM Corporation)
Trend Micro Incorporated
Qualys, Inc.
Rapid7, Inc.
- *Disclaimer: Major Players sorted in no particular order

Market Opportunities and Future Outlook
A near-term opportunity is in converting compliance-driven software inventory and disclosure requirements into automated controls embedded in the container lifecycle. The EU Cyber Resilience Act introduces mandatory vulnerability reporting from September 11, 2026, which elevates continuous SBOM and provenance capture, signed image promotion, and evidence retention into day-to-day requirements rather than periodic audit tasks. Vendors that operationalize these needs through policy-as-code (admission checks for signatures and attestations, registry promotion gates, and auditable runtime telemetry) can reduce the manual effort that slows regulated enterprises and managed service providers.
Supply-chain hardening is also shifting from ad hoc best practices to productized building blocks, creating whitespace around trusted base images, standardized runtime hardening, and automation-first remediation. Red Hat announced general availability of Red Hat Hardened Images in May 2026, and CNCF reported the Security Profiles Operator reaching v1.0.0 stable APIs in June 2026, signaling increasing standardization for hardened defaults at the image and Kubernetes runtime layers. At the same time, operational security teams are pushing machine-speed response in production, supported by reports such as Sysdig highlighting increased use of automated process termination in 2026. This creates room for integrated runtime protection that couples eBPF detections with policy-driven containment, while minimizing false positives and preserving developer workflow velocity.
Recent Industry Developments
- May 2026: Red Hat announced the general availability of Red Hat Hardened Images, offering a catalog of trusted, micro-sized container images designed to support Zero-CVE strategies. The change shifts part of container security spend upstream toward verified base images and away from relying solely on downstream scanning. It also strengthens Red Hat’s position with OpenShift users seeking standardized, supportable supply chain controls.
- April 2026: Red Hat released OpenShift sandboxed containers 1.12 and Red Hat build of Trustee 1.1, moving confidential containers on bare metal from Technology Preview to General Availability. This expands hardware-attested isolation options for sensitive container workloads and supports security-by-design requirements where encryption of data-in-use is needed. It also raises the competitive bar for runtime protection in regulated and high-assurance environments.
- November 2025: Critical runc vulnerabilities (CVE-2025-31133, CVE-2025-52565, CVE-2025-52881) triggered emergency patching across Docker, containerd, and CRI-O ecosystems. The incident highlighted how a single runtime component can create systemic risk across Kubernetes distributions and managed services. It reinforced demand for continuous vulnerability management, image provenance controls, and runtime detections that can spot escape and privilege-escalation behaviors.


Research Methodology Framework and Report Scope
Market Definition and Coverage
For this report, the container security market covers revenues earned from tools and related support services used to secure containerized applications across their lifecycle, including image scanning, policy controls, and runtime protection in clustered environments.
Scope exclusions: We exclude general network security and host security tools that do not provide container-level visibility or controls.
Segmentation Overview
- By Component
- Platform / Software
- Services
- By Organisation Size
- Large Enterprises
- Small and Medium Enterprises
- By Security Control
- Image Scanning and Vulnerability Management
- Runtime Protection and Anomaly Detection
- Compliance and Configuration Management
- By Deployment
- Cloud-Based
- On-Premise
- By End-User Industry
- IT and Telecom
- BFSI
- Retail and e-Commerce
- Healthcare and Life Sciences
- Industrial and Manufacturing
- Other End-User Industries
- By Geography
- North America
- United States
- Canada
- Mexico
- South America
- Brazil
- Argentina
- Rest of South America
- Europe
- Germany
- United Kingdom
- France
- Italy
- Spain
- Rest of Europe
- Asia Pacific
- China
- Japan
- India
- South Korea
- Australia
- Rest of Asia Pacific
- Middle East
- Saudi Arabia
- United Arab Emirates
- Turkey
- Rest of Middle East
- Africa
- South Africa
- Nigeria
- Egypt
- Rest of Africa
- North America
Data Sources, Market Sizing, and Validation
Desk Research
Desk research helped us set the market boundary, confirm common buying patterns, and collect baseline indicators that can be checked year to year. We referenced public sources such as NIST publications, CISA advisories, MITRE ATT&CK, and OWASP guidance to anchor typical container risk areas and control categories.
To support sizing inputs, we also reviewed public cloud and cybersecurity statistics from sources such as the US Bureau of Labor Statistics (for workforce trends), the World Bank (for macro and enterprise environment context), and OECD digital economy materials, along with company SEC filings, investor presentations, and reputable press. For cross-check steps, we used paid subscriptions for company financials and intelligence, news and financials, and patent databases to validate timelines, solution focus, and reported revenue cues. These examples are illustrative and not exhaustive, and many other public documents were also used for data collection, validation, and research clarification.
Primary Interviews and Surveys
Primary interviews focused on confirming what gets counted as container security spend in real buying cycles, and how customers split budgets across image scanning, runtime controls, and compliance needs. We spoke with a mix of technology providers, channel partners, and enterprise security and platform teams across APAC, EMEA, and the Americas, then used the input to tighten assumptions and close gaps that public sources alone did not resolve.
Distribution of primary research fieldwork respondents
| Company type | Respondent position | Region |
|---|---|---|
| Top tier: 39% | CXOs: 18% | APAC: 46% |
| Mid tier: 43% | Functional/Unit leaders: 32% | EMEA: 29% |
| Smaller Players: 18% | Managers: 50% | Americas: 25% |
Market-Sizing & Forecasting
Sizing starts with a top-down rebuild of the reachable demand pool using cloud and container adoption signals, then maps security spending intensity to containerized workloads that are actively deployed and managed. Before the final total is set, we run selective bottom-up checks such as sampled pricing ranges, channel feedback on deal sizes, and supplier revenue cues tied to container workload protection and image risk management.
The model uses practical inputs that can be explained and revisited easily, including the installed base of Kubernetes and container platforms, the share of enterprises running production containerized workloads, vulnerability and misconfiguration pressure that drives scanning frequency, compliance and audit requirements that increase policy enforcement spend, and the typical split between platform subscriptions and support services. When a variable is not consistently available by country, proxy indicators are applied at the regional level, then allocated using enterprise IT spending patterns and cloud maturity indicators.
For forecasting, we use scenario analysis to keep the outlook linked to realistic adoption and budget paths, especially as security platforms bundle multiple modules into one contract. Growth rates are then stress-tested with interview feedback on buying cycles, renewal behavior, and expected pricing progression, and the final curve is adjusted only when multiple signals point in the same direction.
Data Validation & Update Cycle
Validation is handled through cross-checks that look for range breaks, unit mismatches, and unrealistic jumps in regional totals, and then the model is reworked until the variances can be explained. We compare outputs against independent signals such as cloud workload growth, security budget direction, and documented incident and vulnerability trends relevant to containerized environments.
Before sign-off, the work is reviewed in multiple steps so assumptions, conversions, and math links stay consistent across the model and narrative. If a material gap shows up during review, we re-contact respondents for clarification and update the affected inputs. Reports are refreshed annually, with interim updates for material events that can shift adoption, pricing, or compliance urgency, followed by a final pre-delivery pass so clients receive the latest updated view.
Mordor Intelligence's Container Security Market Estimate Compared With Other Published Estimates
Published market sizes for container security do not always match because the counted revenue scope can shift, the treatment of services can differ, and some models show faster pricing expansion than what buyers describe. Differences also show up when studies blend container-specific controls with broader cloud security categories, or when currency normalization is handled using different timing.
Signals such as growth in production Kubernetes clusters, the cadence of vulnerability scanning driven by CI/CD workflows, and renewal based subscription trends are used to validate the 2025 total for Mordor Intelligence. We count container image and runtime specific security revenue only when it is tied to containerized workload protection, instead of general cloud posture spend.
Benchmark comparison
| Source | Market Size | Gaps in Research Methodology |
|---|---|---|
| Mordor Intelligence | USD 3.06 B (2025) | |
| Global Consultancy A | USD 2.88 B (2025) | Appears to apply a narrower capture of services linked to container security deployments, which can reduce the reported total even when core platform subscriptions are similar. |
| Industry Publisher B | USD 3.07 B (2025) | Public notes indicate broad component coverage, but the split between container specific controls and adjacent cloud security items is not clearly separated, which can shift totals depending on categorization rules. |
Overall, the numbers sit close in 2025, and most differences come from how services are counted and how strictly container-only security controls are separated from neighboring cloud security spending. Our method stays traceable to a few observable demand signals and repeatable checks, which keeps the sizing easier to reconcile when assumptions are reviewed.


Key Questions Answered in the Report
What is the forecast growth rate for the container security market to 2031?
The container security market is projected to expand at a 20.66% CAGR from 2026 to 2031.
Which component category is expected to grow fastest?
Services are forecast to grow at a 21.41% CAGR as organizations outsource policy tuning and incident response.
Why is runtime protection gaining traction over static image scanning?
Fewer than 6% of registry vulnerabilities are exploited at runtime, so teams prioritize behavioral monitoring to catch live attacks.
Which region will post the highest growth through 2031?
Asia-Pacific is expected to lead with a 22.64% CAGR driven by sovereign-cloud and public-infrastructure programs.
How do PCI-DSS 4.0 rules affect container security spending?
Requirement 6.3.3 mandates SBOMs and continuous monitoring, pushing financial institutions to adopt end-to-end container security controls.
What technologies enable secure container deployment in public clouds?
Confidential computing features like Intel TDX, AMD SEV-SNP, and AWS Nitro Enclaves encrypt memory to guard against hypervisor compromise.
Page last updated on:


